


National Partnership Agreement on Remote Service Delivery Evaluation 2013
Indigenous AffairsEvaluations and EvidenceLand and HousingRemote Australia Strategies Programme
Wednesday, 30 July 2014
Publication author(s):
Publication abstract:
The National Partnership Agreement on Remote Service Delivery (NPA RSD) was a commitment by the Australian, New South Wales, Queensland, South Australian, Western Australian and Northern Territory Governments to address local Indigenous disadvantage. The NPA RSD officially commenced on 27 January 2009 and expired on 30 June 2014.
The broad intent of the NPA RSD, together with other relevant Council of Australian Governments (COAG) agreements, was to contribute to improved access, range and coordination of services, improved levels of governance and leadership, and increased economic and social participation in 29 priority locations.
The NPA RSD required that the agreement be reviewed prior to its completion. An evaluation of the NPA was undertaken in 2013 and comprised:
- in-depth research with 207 key stakeholders
- a survey and qualitative research with 726 community members
- a survey of 338 local service providers
- analysis of outcome data from administrative sources and Australian Bureau of Statistics.
Both the survey of local service providers and outcome data included an analysis of outcomes in other remote communities to establish whether any improvements were part of a broader trend.
The evaluation was guided by four key questions:
- Has access to and delivery of services improved?
- Has the capacity of communities and governments to engage with one another improved?
- Have there been changes in the RSD sites that contribute to the Closing the Gap objectives?
- What have we learned from the initiative that can inform remote service delivery, community capacity building, and place-based approaches?
The report's appendices can be accessed at National Partnership Agreement on Remote Service Delivery Evaluation 2013 Appendices.
| Attachment | Size |
|---|---|
| 2.97 MB |
© Commonwealth of Australia 2014
Ownership of intellectual property rights in this publication
Unless otherwise noted, copyright (and any other intellectual property rights, if any) in this publication is owned by the Commonwealth of Australia (referred to below as the Commonwealth).
Creative Commons licence
With the exception of the Coat of Arms, this publication is licensed under a Creative Commons Attribution 3.0 Australia Licence.
Creative Commons Attribution 3.0 Australia Licence is a standard form license agreement that allows you to copy, distribute, transmit and adapt this publication provided that you attribute the work. A summary of the licence terms is available from. http://creativecommons.org/licenses/by/3.0/au/deed.en. The full licence terms are available from http://creativecommons.org/licenses/by/3.0/au/legalcode.
The Commonwealth’s preference is that you attribute this publication (and any material sourced from it) using the following wording:
National Partnership Agreement on Remote Service Delivery Evaluation 2013
Source: Licensed from the Commonwealth of Australia under a Creative Commons Attribution 3.0 Australia Licence.
The Commonwealth of Australia does not necessarily endorse the content of this publication.
ISBN PDF 978-1-922098-26-9 Remote Service Delivery Evaluation 2013 (PDF)
Doc 978-1-922098-25-2 Remote Service Delivery Evaluation 2013 (Hardcopy)
Print 978-1-922098-27-6 Remote Service Delivery Evaluation 2013 (RTF)
Foreword
The National Partnership Agreement on Remote Service Delivery (NPA RSD) is a commitment by the Australian, New South Wales, Queensland, South Australian, Western Australian and Northern Territory Governments to address local Indigenous disadvantage. The NPA RSD officially commenced on 27 January 2009 and expires on 30 June 2014.
The broad intent of the NPA RSD, together with other relevant Council of Australian Governments (COAG) agreements, is to contribute to improved access, range and coordination of services, improved levels of governance and leadership, and increased economic and social participation in 29 priority locations.
The NPA RSD requires that the agreement be reviewed prior to its completion. An Implementation Review was conducted in 2012 and an evaluation undertaken in 2013. This report provides the results of the evaluation. Given the diverse nature of the evaluation itself, the report has multiple elements and authors. Dr Michael Limerick was commissioned to write an overview that assesses and summarises all the various elements of the evaluation.
To capture a diversity of voices, the evaluation incorporated several qualitative and quantitative methods conducted by a number of specialists. Data collection was conducted in two stages, commencing with over 200 stakeholder interviews by O’Brien Rich Research Group, and a survey of 338 service providers overseen by Dr Judy Putt between March and May 2013, followed by a community research study by Colmar Brunton Social Research between September and November 2013. The Australian Institute of Criminology (AIC) collated crime data and the Australian Institute of Health and Welfare (AIHW) collated and analysed health data.
Importantly, the community research study was designed to capture peoples’ lived experience of change and includes a survey of 726 residents in a sample of RSD communities. Local Indigenous people were employed and trained to assist in conducting this study which involved both a quantitative survey and qualitative data collection and analysis.
A range of data on social and economic outcomes were collated and analysed for the evaluation. In analysing these data an assessment was made as to whether any changes were unique to the RSD communities or whether they were part of a broader trend.
The evaluation was managed by the Evidence and Evaluation Branch, which was part of the former Department of Families, Housing, Community Services and Indigenous Affairs (FaHCSIA). Following recent machinery of government changes this branch is now part of the Department of the Prime Minister and Cabinet (PM&C).
To provide overall direction for the evaluation, an Evaluation Advisory Group (EAG) was formed. The EAG comprised representatives from the Australian Government, state/territory governments, an Indigenous organisation and the former Office of the Coordinator General for Remote Indigenous Services. An existing Inter-Department Committee also provided data, advice and information to inform the evaluation.
Four key evaluation questions guided the evaluation:
- Has access to and delivery of services improved?
- Has the capacity of communities and governments to engage with one another improved?
- Have there been changes in the RSD sites that contribute to the Closing the Gap objectives?
- What have we learned from the initiative that can inform remote service delivery, community capacity building, and place-based approaches?
The evidence and findings are presented under the following chapter structure:
- Executive summary
- Chapter 1 - Evaluation overview, Dr Michael Limerick
- Chapter 2 - Introduction, Evidence and Evaluation Branch
- Chapter 3 - Progress in implementing the NPA RSD, compiled by Evidence and Evaluation Branch
- Chapter 4 - Community research study, Colmar Brunton Social Research
- Chapter 5 - Stakeholder interviews, O’Brien Rich Research Group
- Chapter 6 - Survey of local service providers, Dr Judy Putt
- Chapter 7 - Outcomes was compiled by the Evidence and Evaluation Branch incorporating crime data analysis by AIC and health data analysis by AIHW.
The executive summary provides high-level findings specific to the key evaluation questions. The evaluation overview provides a more detailed summary of these findings and places them in context with the existing evidence base. Chapters 2 and 3 provide factual information about the NPA RSD.
To reflect the government arrangements during the period covered by the evaluation, this report refers to the agencies prior to the change of government in September 2013. The lead Australian Government agency for the NPA RSD during this period was the former Department of Families, Housing, Community Services and Indigenous Affairs (FaHCSIA). Along with the states and the Northern Territory, other Australian government agencies, particularly the former Departments of Education, Employment and Workplace Relations (DEEWR) and Health and Ageing (DoHA) provided support and services to the priority locations.
The Australian Government would like to thank the New South Wales, Queensland, South Australian, Western Australian and Northern Territory Governments for their advice and provision of data and information throughout the evaluation process. The Australian Government would also like to thank the numerous people who participated in the research, particularly community members who provided an insight into their lives and communities, and the people who participated as researchers in the community research study.
Evidence and Evaluation Branch
Contents
Dr Michael Limerick, Limerick & Associates
1.4.Introduction to the evaluation
1.6.National Partnership Agreement on Remote Service Delivery
Evidence and Evaluation Branch
2.2.Background to coordinated service delivery to overcome Indigenous disadvantage
2.3.Remote Service Delivery Approach
2.5.Funding of the NPA RSD and IRSD Special Account
2.6.Relationship between RSD and related initiatives
3 Progress in implementing the NPA RSD
Compiled by Evidence and Evaluation Branch
3.4.Key achievements in RSD locations
Colmar Brunton Social Research
4.1.Highlights of study findings
4.4.Community knowledge of the Remote Service Delivery model
4.5.Perceptions of community leadership and community behaviour
4.6.Research findings against the evaluation questions
4.7.Perceptions of change in the community and quality of life at the community and individual level
4.8.Relationship between personal circumstance and survey responses
5.1.Background to key stakeholder interviews
5.5.Improving service coordination
5.6.Enhancing infrastructure and services
5.8.Strengthening community governance and leadership
6 Survey of local service providers
7.4.Health and community services
Abbreviations and acronyms
ABS Australian Bureau of Statistics
AACAP Army Aboriginal Community Assistance Program
APY Lands Anangu Pitjantjatjara Yankunytjatjara Lands
BER Building the Education Revolution
BOM Board of Management
CDEP Community Development Employment Projects
CGRIS Coordinator General for Remote Indigenous Services
CtG IHO NPA Closing the Gap in Indigenous Health Outcomes National Partnership Agreement
CtG NT NPA Closing the Gap in the Northern Territory National Partnership Agreement
COAG Council of Australian Governments
CYWR Cape York Welfare Reform
DEEWR Department of Education, Employment and Workplace Relations
DoHA Department of Health and Ageing
EAG Evaluation Advisory Group
FaHCSIA Department of Families, Housing, Community Services and Indigenous Affairs
GBM Government Business Managers
GCO Government Coordinator Officers (Cape York Communities, Qld)
GEC Government Engagement Coordinators (NT)
GECO Government Engagement and Coordination Officers (Gulf Communities, Qld)
HOIL Home Ownership on Indigenous Land
ICC Indigenous Coordination Centre
IDC Inter-departmental Committee
IECD NPA Indigenous Early Childhood Development National Partnership Agreement
IEO Indigenous Engagement Officer
IRSD Indigenous Remote Service Delivery
IRSD SA Indigenous Remote Service Delivery (Special Account)
IPSS Indigenous Parenting Support Services
LAC Local Area Coordinator (WA)
LCAP Local Community Awareness Program
LIP Local Implementation Plan
LRG Local Reference Group
LSSSC NPA Low Socio-economic Status School Communities National Partnership Agreement
MES Municipal and Essential Services
MOU Memorandum of Understanding
NAPLAN National Assessment Program – Literacy and Numeracy
NIRA National Indigenous Reform Agreement
NPA National Partnership Agreement
NPA DER National Partnership Agreement on the Digital Education Revolution
NPARIH National Partnership Agreement on Remote Indigenous Housing
NPA RSD National Partnership Agreement on Remote Service Delivery
NSW New South Wales
NT Northern Territory
NTER Northern Territory Emergency Response
ORIC Office of the Registrar of Indigenous Corporations
PM&C Department of the Prime Minister and Cabinet
Qld Queensland
RJCP Remote Jobs and Communities Program
ROC Regional Operations Centre
RPA Regional Partnership Agreement
RSD Remote Service Delivery
RSDC Remote Service Delivery Coordinator (NSW)
SA South Australia
SFNT Stronger Futures in the Northern Territory
SGI Single Government Interface
SLA Statistical Local Areas
SRA Shared Responsibility Agreement
TTC Trade Training Centre
WA Western Australia
Executive summary
Evidence and Evaluation Branch
The National Partnership Agreement on Remote Service Delivery (NPA RSD) evaluation involved a mixed-method approach with a focus on key components of the NPA RSD outcomes. Undertaken primarily in 2013, the evaluation comprised:
- in-depth research with 207 key stakeholders
- a survey and qualitative research with 726 community members
- a survey of 338 local service providers
- analysis of outcome data from administrative sources and Australian Bureau of Statistics (ABS).
Both the survey of local service providers and outcome data included an analysis of outcomes in other remote communities to establish whether any improvements are part of a broader trend.
Findings
Service delivery
- There is strong evidence that the NPA RSD led to an increase in service provision in NPA RSD communities such as new houses, Children and Family Centres, youth services and social services particularly for families.
- The service provider survey showed that a statistically significantly higher proportion of local service providers in RSD communities (43%) reported that services had increased in the previous three years than service providers who worked in non-RSD communities (28%). However, there was less evidence of a significant and fundamental change in service practice and delivery.
- Community members recognised that there are more services available and considered key services to be more helpful. Community members identified that the challenge is now around encouraging people to take advantage of these opportunities and to use the new or improved services to help themselves and the community.
- Indigenous overcrowding rates in RSD communities fell at a considerably faster rate from 2006 to 2011 than for very remote areas in general. This reflects the fact that RSD communities were given priority under the National Partnership Agreement on Remote Indigenous Housing (NPARIH).
- There were mixed views on service coordination with some stakeholders and service providers suggesting that, in some instances, additional services had made the coordination task more challenging.
- Overall, 69 per cent of service providers reported that the NPA RSD was beneficial for the community.[1]
Coordination, engagement and capacity
- The majority of service providers were positive about the effectiveness of Government Business Managers (GBMs) – 66 per cent and Regional Operation Centres (ROCs) – 59 per cent in helping to coordinate service delivery.[2]
- There is strong support for – GBMs and Indigenous Engagement Officers (IEOs). Sixty-nine per cent of service providers believed that GBM positions were effective in helping community engagement while 68 per cent reported that IEOs were effective in assisting community engagement.[3]
- There were statistically significant differences in local service providers’ views of the NPA RSD, with those in Western Australia (78%) and Queensland (70%)[4] more likely than those in the Northern Territory (62%) and New South Wales (53%) to say the RSD was beneficial.
- The idea of Local Implementation Plans (LIPs) received good support; however in practice the experience was mixed. Around 70 per cent of service providers reported that LIPs were effective in identifying community priorities. However, lower proportions reported that LIPs were effective in generating change (34%) and increasing accountability (40%).[5]
- It was noted in previous reviews of the NPA RSD that LIPs were overly complex with a total of almost 4,000 actions initially identified.
- Awareness of LIPs was limited among community members, and although there was support for having local plans among stakeholders and local service providers, the way in which the LIPs were developed and used fell short of expectations. Of the 35 per cent of community members surveyed in the community research study who knew of the LIP, 48 per cent thought that, to some extent, it told the right story for the community.
- In a survey of 726 community members, over half the respondents knew who the IEO was (54%) and 43 per cent knew about the GBM. In relation to government in its broader sense, when asked to rate the government out of ten, only a third gave a rating of ‘seven or higher’ in relation to the effectiveness of government in helping to make the community better. Just over a quarter rated the government ‘seven or more’ for understanding community culture.
- The Local Reference Groups (LRGs) seemed to be well known with the majority of community members aware of its existence (61%). The community research survey shows relative positivity about the role of the LRG as a voice for the community and individuals (44% rated the LRG highly for talking up for the community and 37% rated them highly for talking up for the individual). However, the qualitative data indicates that this did not necessarily translate into community ownership or a feeling that the LRG was leading change or making services accountable. Critical factors that seemed to contribute to successful coordination and engagement included concerted support from the state/territory government, stable and strong leadership in government at a regional and local level and in local communities, and local commitment and resources to achieve the LIP goals.
- The objectives of the NPA RSD against which the least progress has been made are in building community capacity to engage with governments and building community governance and leadership capacity generally.
- There was a strong view amongst government stakeholders that the reporting requirements under the NPA RSD had been excessive and overly burdensome.
- Staff turnover within both government and community agencies was also reported as impacting on attempts to develop more locally-directed change or improvements. In the service provider survey, the majority of respondents (71%) said recruiting appropriately skilled or experienced staff was a ‘big’ issue for their service, while 58 per cent said staff retention was a ‘big’ issue.
Contribution to Closing the Gap
- Tangible gains did flow from the prioritisation of infrastructure and programme investment in the 29 RSD communities. Half of all community members surveyed considered that their community (50%) and their own lives (52%) were improving. Housing, infrastructure, early childhood education and employment were often cited as reasons why things were improving.
- While the outcome data showed some improvements in RSD communities this was generally part of a more general trend. For example, there were improvements in mainstream employment rates and year 12 attainment levels in almost all RSD communities from 2006 to 2011. However, with the exception of overcrowding, these improvements were part of a broader trend. In some instances, outcomes such as school attendance and National Assessment Program – Literacy and Numeracy (NAPLAN) results have shown no statistically significant overall change across the RSD communities.
- Perceptions of local service providers indicated that to those on the ground there were limited achievements against Closing the Gap targets. This is not surprising as the NPA RSD has only had a limited amount of time to influence outcomes.
Lessons learned
- There is a tension in the NPA RSD model between addressing service issues and community engagement. Future place-based initiatives should be mindful of this tension and be clear on where the balance lies. Pressure was brought to finalise LIPs quickly. This pressure may have affected community engagement. Partly reflecting the tension between these goals, stakeholders who thought that the NPA RSD was mostly about service equalisation were more positive about the NPA RSD than those that felt the NPA RSD was mostly about community development.
- The strong focus on getting the new government infrastructure and key NPA RSD coordination and engagement mechanisms in place seems to have overshadowed less concrete aspirations related to enhanced governance and leadership capacity within communities.
- The perception among some government stakeholders that the NPA RSD involved a heavy reporting burden may be related to the large number of LIP actions and the reports required by the NPA RSD. If a smaller number of action items were identified in local plans this may have reduced the reporting burden and allowed greater focus on key priorities.
- The NPA RSD has a focus on service coordination. While coordination can be beneficial, the evidence on the impact of improved service coordination is thin.[6] No credible evidence suggests that service coordination itself can bring about large improvements in outcomes. This does not mean that coordination should not be pursued but coordination alone may not bring about desired change.
- There was a view amongst many stakeholders that greater devolution of decision-making responsibility to regional and local levels would improve the ability of government to be responsive to community needs.
- The NPA RSD has clearly led to increased service provision in RSD communities over and above what would have happened in the absence of the NPA RSD. However, the impact of additional services depends on their effectiveness.
- Through the community research study, community members were asked in an open-ended question about the three most important changes needed to make their community a better place to live. The top responses were:
- a third (33%) of community members cited more jobs/relevant training
- just over a fifth (22%) mentioned more services and programmes with the same proportion (22%) specifying sport/recreation activities and services for youth
- just under a fifth (19%) mentioned more housing and housing repairs
- 17 per cent noted that kids need to be in school/education
- 17 per cent mentioned reducing the use of alcohol/drugs/kava with the same proportion mentioning improving roads/rubbish, sports facilities and infrastructure.
- The desire by community members for more employment comes out strongly. More generally, many of these responses go beyond service provision and relate to one of the objectives of the NPA RSD - ‘to increase economic and social participation wherever possible, and promote personal responsibility, engagement and behaviours consistent with positive social norms’.
- It is also worth noting that when it comes to service delivery the issues raised by community members in the community research study were similar to those raised in the baseline mapping reports, notably issues related to access roads and infrastructure.
1 Evaluation overview
Dr Michael Limerick, Limerick & Associates
1.1 Overview outline
This overview provides a summary and assessment of the evidence that was collected through the various elements of this evaluation. The overview also draws on the existing evidence base particularly in the section on lessons learned. More details on the individual elements of the evaluation are provided in other parts of the report.
The overview commences with an outline of the evaluation report, followed by a description of the evidence drawn on in this chapter to address the four evaluation questions. Section 1.4 provides an outline of the key questions and performance indicators that guided the evaluation. Section 1.5 provides contextual information that explains the origins and philosophy of the NPA RSD within the broader narrative of Indigenous policy. Section 1.6 provides a brief summary of the various elements of the NPA RSD and how they were intended to achieve objectives. Section 1.7, the findings, canvasses each of the key evaluation questions including the lessons learned and implications for future efforts to improve remote service delivery.
1.2 Report structure
The National Partnership Agreement on Remote Service Delivery Evaluation 2013 report has been prepared by a number of authors, using a range of methodologies each focusing on one or more of the key evaluation questions.
- Chapter 1: Evaluation Overview, Dr Michael Limerick
- addresses the four evaluation questions drawing on a wide range of evidence
- Chapter 2: Introduction, Evidence and Evaluation Branch[7]
- provides a factual account of and background to the NPA RSD
- Chapter 3: Progress in Implementing the NPA RSD, Evidence and Evaluation Branch
- provides a factual account on the progress of implementing the outputs specified in the NPA RSD, as well as other key investments and achievements in the priority locations
- Chapter 4: Community Research Study, Colmar Brunton Social Research
- presents the results of a study designed to capture people’s lived experience of change and includes a survey of 726 residents and participatory qualitative research
- Chapter 5: Stakeholder Interviews, O’Brien Rich Research Group
- provides findings from over 200 interviews conducted with a range of stakeholders including Australian, State and Northern Territory government policy officers, Government Business Managers (GBMs) and Indigenous Engagement Officers (IEOs), local service providers and representatives of Indigenous peak bodies
- Chapter 6: Survey of Local Service Providers, Dr Judy Putt
- presents the results from an online survey of 338 service providers
- Chapter 7: Outcomes, Evidence and Evaluation Branch incorporating crime data analysis by AIC and health data analysis by AIHW.
1.3 Overview method
This chapter provides an overview of the Evaluation of the National Partnership Agreement on Remote Service Delivery (NPA RSD). It summarises and synthesises the central themes and evidence to inform the key evaluation questions.
The chapter draws on evidence collected as part of the evaluation particularly:
- the community research study conducted by Colmar Brunton Social Research (Chapter 4)
- stakeholder interviews conducted by O’Brien Rich Research Group (Chapter 5)
- the service provider survey conducted by Dr Judy Putt (Chapter 6)
- analysis of outcome data (Chapter 7).
Additional material to inform this chapter is also drawn from:
- the six-monthly reports of the Coordinator General for Remote Indigenous Services (CGRIS)
- information on the CGRIS website, such as jurisdictional governance assessments
- Australian National Audit Office (ANAO) Audit Report No.43 2011–12 on the National Partnership Agreement on Remote Service Delivery
- reports of the Northern Territory Coordinator General for Remote Services
- Implementing Remote Service Delivery- progress towards a new way of working with remote Indigenous communities to Close the Gap, 2013, FaHCSIA’s Implementation Review
- various reports produced as part of the NPA RSD initiative, including NPA RSD Annual Reports to the Council of Australian Governments (COAG)
- evaluations and reports into other initiatives that have touched on aspects of the NPA RSD implementation, including the review of coordination and engagement conducted for the Northern Territory Emergency Response evaluation and the Cape York Welfare Reform (CYWR) Evaluation 2012
- relevant program information about the implementation and outcomes of the NPA RSD initiative.
Academic and policy literature has also been used to position the evaluation findings in the broader context of current thinking about leading practices in service delivery to remote Indigenous communities.
1.4 Introduction to the evaluation
1.4.1 Key questions
This evaluation was conducted as a requirement of Paragraph 41 of the NPA RSD which stated that, ‘the Agreement will be reviewed prior to its completion in 2013-14, the final year of the Agreement, with regard to progress made by the Parties in respect of achieving the agreed outcomes’.
To measure progress in achieving the agreed outcomes, the evaluation is guided by four key questions:
- Has access to and delivery of services improved?
- Has the capacity of communities and governments to engage with one another improved?
- Have there been changes in the RSD sites that contribute to the Closing the Gap objectives?
- What have we learned from the initiative that can inform remote service delivery, community capacity building, and place-based approaches?
The questions were derived from the outcomes listed under Paragraph 16 of the NPA RSD that the Agreement will contribute to:
- standards of services and infrastructure to be comparable with non-Indigenous communities of similar size, location and need elsewhere in Australia;
- clear roles and responsibilities identified with all levels of government working together;
- community organisations deliver government services that meet relevant legislative requirements and are accountable to their constituents and funding bodies;
- improved access to services for Indigenous people in remote locations to support achievement of the COAG Targets. Ensuring:
- it is simpler to negotiate government services for Indigenous Australians;
- it is easier for Indigenous Australians to engage government services; and
- user-friendly services are provided to Indigenous Australians by government;
- better coordinated, consistent and connected government services and more highly developed capacity in Indigenous communities; and
- enhanced workforce planning including the development of local skills and a stable local workforce.
1.4.2 Performance indicators
Evaluating any place-based initiative is difficult as many factors can affect what happens in a particular place. Care is also required to measure the counterfactual – that is what would have happened in the absence of the specific policy or programme.
Evaluating the agreement was particularly difficult as it was not always clear what happened as a result of the NPA RSD itself. In a place-based initiative it is often possible to identify the additional services or programmes introduced as a result of the policy. To take the Northern Territory Emergency Response (NTER), as an example, it was possible to identify additional police and night patrol services to each location.[8]
Identifying additional services provided under the NPA RSD[9] is difficult as many services were provided through other NPAs and some of these investments would probably have occurred in any case. Making this assessment is not straightforward. While the NPA RSD locations were meant to be given priority, it is not easy to establish that these locations would have received these additional services anyway. The Local Implementation Plans (LIPs) do not fully inform this assessment as they do not always articulate the additional investments. On the other hand it is clear that some additional services such as those provided through the Indigenous RSD Special Account[10] would not have occurred in the absence of the NPA RSD.
At one level it does not matter whether the additional services were provided as a result of the NPA RSD itself as the services were provided. An evaluation, however, needs to look beyond what was provided to attribute benefits to the policy itself. If the investments would have happened anyway then these investments cannot be claimed as a benefit of the NPA RSD.
Some complex implementation issues around things such as staff housing and land tenure also impacted on the extent to which broader RSD NPA outcomes were attained.[11]
Another challenge in evaluating the NPA RSD was the selection of performance indicators. Paragraph 23 of the NPA RSD states:
Under this proposal, performance benchmarks and indicators will differ from location to location. Performance indicators and benchmarks will be developed as part of the process of developing Local Implementation Plans.
While performance indicators were not developed as part of the LIP development process, the RSD Implementation Review[12] states ‘performance indicators for Local Implementation Plans in Northern Territory (NT) and Western Australia (WA) have been finalised and indicators for South Australia (SA), New South Wales (NSW) and Queensland (Qld) were due to be finalised’. As the indicators for SA, NSW and Qld had not been agreed at the time of the Implementation Review and the indicators for the NT and WA are high level indicators similar to those agreed by all jurisdictions through the performance management framework[13]; the outcome indicators used in this evaluation are consistent with those specified in the performance management framework.
If indicators had been developed as part of the LIP development process it would have been possible to measure each LIP against the key priorities in those LIPs. As this was not done, high level outcome indicators, aligned where possible, to the Council of Australian Governments (COAG) Closing the Gap targets have been chosen. It is important to have realistic expectations about what changes might be discernable or attributable to the NPA RSD within the timeframe of the evaluation. Many of the high level indicators used for this evaluation change slowly. Health outcomes, for example, tend to change gradually. Also worth noting is that most of the LIPs were agreed in 2010 with some agreed in 2011. Given that much of the evaluation data refer to 2012 or earlier, if LIPs are taken as the starting point, the NPA RSD has only had a limited amount of time to influence outcomes. Despite this limitation, care has been taken to not only look at trends in outcomes in the RSD communities but to also make comparisons with other communities to assess whether changes are part of a broader trend.
The evaluation, therefore, did not just focus on outcome indicators as the impacts of the NPA RSD relate to measuring changes in the way government services are delivered and coordinated and the way in which governments and communities work together. Information on changes of this nature is best collected from service providers, government officials and community members themselves.
It is also important to have realistic expectations about what changes might be discernable or attributable to any service delivery initiative. As Stewart, Lohoar and Higgins[14] have noted there is only limited evidence to understand whether service delivery coordination leads to better outcomes either in Australia or internationally. There is no real evidence to suggest that service coordination itself will provide large benefits. The NPA RSD was not just about better coordination it also entailed the provision of additional services and involved a type of community planning which does not occur in all communities.
1.5 Historical context
To understand the scope and intent of the NPA RSD, it is important to consider governments’ evolving approaches to service delivery in remote Indigenous communities in recent decades. For much of the twentieth century, the majority of remote community services – municipal, essential and social – had been delivered by missionary or government administrations. From the late 1970s to the 1990s, the advent of self-determination policy led to the proliferation of Indigenous community organisations and representative councils, which assumed the funding and decision-making authority for the delivery of many local services.[15] [16] By the late 1990s, in most remote Aboriginal and Torres Strait Islander communities, local councils or community organisations delivered the majority of municipal and essential services, public housing, employment programs (e.g. Community Development Employment Projects (CDEP)), social programs (e.g. crime prevention, suicide prevention, alcohol rehabilitation, family support), sport and recreation, social security advice, banking and postal services (through agency arrangements), childcare, broadcasting, and land management. The only services primarily delivered by external agencies were schooling, health, and statutory services such as child protection and justice services. Even in these areas, many local councils and community organisations were involved in delivering primary health services, child protection, community corrections and even community policing and community courts.
By the early 2000s, it was clear that despite the reforms in remote Indigenous service delivery, limited progress was being made in overcoming Indigenous disadvantage. In fact, there were concerns that conditions in many communities were deteriorating.[17] There was an increasing focus on the governance and financial management deficiencies of many Indigenous councils and organisations as well as concerns about whether mainstream service standards were being achieved. There were concerns that Indigenous councils in remote areas were burdened with too wide an array of services, which was beyond their capacity to deliver.
At the same time, the administrative reforms associated with ‘New Public Management’[18] were filtering through to Indigenous affairs, with a shift to competitive tendering of service delivery, along with a focus on systematic measurement of outputs and outcomes. The dominant view was that the imperative for achieving mainstream standards of service delivery in remote Indigenous communities should be placed ahead of considerations of self-determination and community capacity-building. The pathway to overcoming Indigenous disadvantage was envisioned through services targeted at the gaps in Indigenous living standards and delivered to a higher standard under a strict framework of measurement and accountability for outcomes. Services and programs delivered by the original flagship for Indigenous self-determination, Aboriginal and Torres Strait Islander Council (ATSIC), were progressively transferred to mainstream government agencies until the Commission was abolished in 2004. Delivery of services was put out to competitive tendering and contracts were increasingly entered into with larger non-Indigenous non-government organisations (NGOs) or private providers. This trend extended to programs with community development objectives, such as CDEP.
The new directions in Indigenous service delivery can be discerned in the various strategic reforms initiated by COAG through the past decade. In 2002, COAG commissioned the Productivity Commission’s Overcoming Indigenous Disadvantage reports, published every two years containing key indicators intended to measure the impact of reforms to policy settings and service delivery. In 2004, COAG agreed to a National Framework of Principles for Delivering Services to Indigenous Australians, which emphasised sharing responsibility, harnessing the mainstream (including corporate, non-government and philanthropic sectors), streamlining service delivery, establishing transparency and accountability, developing a learning framework, and focusing on priority areas. By 2008, COAG had cemented the new outcomes-focused approach to Indigenous service delivery in the National Indigenous Reform Agreement, committing governments to six high level Closing the Gap targets across seven ‘building blocks’.[19] At the same time, COAG finalised National Partnership Agreements committing to significant new investments in services and infrastructure designed to close the gap on Indigenous disadvantage. New service delivery principles in the Agreement emphasised priority against the Closing the Gap targets, Indigenous engagement, sustainability, accessibility, integration between and within governments, and accountability. Specific principles for investment in remote locations emphasised achieving standards of services and infrastructure equivalent to comparable mainstream communities.
While the language of self-determination faded from government pronouncements in Indigenous policy,[20] the new language emphasised the engagement and participation of Indigenous communities, service delivery responsiveness to Indigenous needs, and partnerships and shared responsibility between governments and communities. The vacuum in Indigenous governance left by the abolition of ATSIC and other representative structures and the diminished role of Indigenous community organisations necessitated new approaches by government in seeking to engage with Indigenous communities. The Australian state and territory governments’ concept of Shared Responsibility Agreements represented an effort to enter agreements about services directly with Indigenous groups at the community level, or sometimes even the family level. Regional Partnership Agreements applied the same engagement principles at a regional level.[21] At the state and territory level, government policy frameworks emphasised ‘partnerships’ directly with Indigenous communities, through engagement mechanisms such as ‘negotiation tables’ in Qld and ‘Community Working Parties’ in NSW.[22]
Running parallel to governments’ core focus on mainstream service standards and its ancillary focus on better engagement with Indigenous communities has been the perennial challenge of how to improve coordination of service delivery across and within governments. The COAG trials agreed by COAG in 2002 were intended as a ‘whole-of-government cooperative approach’ in selected sites across Australia to ‘improve the way governments interact with each other and with communities to deliver more effective responses to the needs of Indigenous Australians’.[23] State and territory governments were also grappling to identify structural solutions to government coordination. For example, the Qld Government appointed Government Coordinators in remote communities and nominated agency CEOs as ‘Government Champions’ to lead engagement and coordinated government responses in specific Indigenous communities. These new approaches to coordination are underpinned by a belief that whole-of-government effort can best be coordinated, as well as aligned with community needs, by adopting a place-based approach focusing on an Indigenous community or region.
The NTER launched in 2007 reflected many of the principles in the new Indigenous policy orthodoxy. It represented a significant injection of funds for a suite of new services designed to close the gap in priority areas, with these services to be delivered by a combination of government agency staff and service providers contracted through competitive tenders. Coordination was to be achieved through GBMs in each community and new IEO positions were subsequently created to facilitate better engagement with communities.
1.6 National Partnership Agreement on Remote Service Delivery
The antecedents for the NPA RSD can be clearly identified in the preceding discussion of the evolving policy framework for remote Indigenous service delivery. In particular, the NPA RSD enshrines the three core themes of improving services, engagement and coordination.
The predominant focus continues to be on improving services as a means to close the gap between Indigenous and non-Indigenous life outcomes. The imperative for performance measurement can be seen in the commitment to baseline mapping and benchmarking against the range and standard of services in comparable non-Indigenous communities. LIPs were devised as a place-based mechanism to focus efforts on the priority actions and to reinforce the concept of accountability of governments and service providers for delivery of agreed outcomes. The elaborate reporting framework surrounding the implementation of the NPA RSD, including tracking every action in the LIPs as well as independent six-monthly reports by the Coordinator General for Remote Indigenous Services, give further effect to the principles of measurement and accountability for outcomes that have come to the fore in Indigenous policy in the past decade.
Complementary to the core focus on enhancing services, RSD continues the theme of improving coordination. Coordination was to be achieved by creating a ‘Single Government Interface’ co-locating Australian and State/Territory officers in Regional Operations Centres (ROCs) and employing GBMs or equivalents to lead coordination within each community. The GBM positions had direct precursors in the NTER, and similar positions also existed in Qld, employed by the State Government. Although not explicit in the NPA RSD, LIPs are also recognised as a tool to facilitate greater coordination by ensuring clarity and complementarity of the respective roles of various agencies and service providers.[24] This is especially important in areas where there are no defined statutory roles and a greater risk of duplication and overlap, such as delivery of programs for early childhood, parenting, family support and other areas of social and community development. Under the NPA RSD, like previous initiatives, coordination is an activity intended to be place-based, with a particular focus on the community level.
The principle of engagement is reflected in the RSD model through the elements of Local Reference Groups (LRG) and the IEOs, with the latter also drawn from the NTER model. The LRG was developed as the vehicle for the Single Government Interface (SGI) and participating agencies to engage with the community around the negotiation of the LIPs and then to progress the LIP actions.[25] The IEO is intended as a conduit for engagement between government and the local community. However, the RSD model envisages that engagement with the Indigenous community should not just be an activity led by ROC staff and the GBM in the negotiation and implementation of the LIP; it should also be part of the core business of service providers in their ongoing service delivery.[26] Thus, the model aims to change the way government and non-government service providers work in remote Indigenous communities.
A further objective of the RSD, closely linked to the theme of engagement, is to improve the level of governance and leadership within Indigenous communities and Indigenous community organisations (NPA RSD, Paragraph 15(c)). Inclusion of this objective appears to acknowledge one of the key lessons of the COAG trials, that stronger leadership and governance capacity is a prerequisite for Indigenous communities to be able to effectively engage or partner with governments and service providers.[27] In other words, governments cannot expect Indigenous communities to actively engage in planning and negotiation about service delivery priorities if they are not first supported to build functional governance and leadership structures that can represent and give voice to the community’s needs and aspirations. In the context of the RSD, building the governance and leadership capacity of the LRGs is important to continuing to negotiate and implement a LIP that reflects community priorities and engenders a sense of partnership. To support the governance and leadership objective, the agreement committed $67.7 million[28] over five and a half years for ‘Building community governance capacity’.
1.7 Findings
This section discusses each of the four key evaluation questions.
1.7.1 Service delivery improvements
Evaluation Question 1: Has access to and delivery of services improved?
This question is discussed under two sub-topics, quantum of services and quality and use of services.
Quantum of services
The evaluation found that the NPA RSD has had an impact in expanding the quantum of services and infrastructure.[29] The extent to which the prioritisation of RSD communities has had a net effect in closing the overall gap in levels of services across remote Indigenous Australia is more difficult to gauge. However, there are indications that the RSD planning and service improvement model, if used effectively by staff leading whole-of-government responses, can effectively leverage and optimise government investments to address service gaps and community priorities.
Examples of additional investments to RSD communities, arising from a suite of other NPAs[30] include the construction of new houses,[31] [32] Children and Family Centres; new or enhanced training; well‑being centres and health services; infrastructure to schools; expanded services and infrastructure related to men’s groups, women’s safe houses, youth sport and recreation programs; additional job opportunities through expanded services; housing construction; and new enterprises in areas such as arts and visitor accommodation.
While some of these service enhancements would have occurred regardless of the NPA RSD, stakeholders generally expressed the view that NPA RSD had contributed to these outcomes by bringing greater focus to drive change in these communities.[33] This perception is also mirrored in the online survey of local service providers. There was clear evidence of more services being provided to the communities, with a statistically significantly higher proportion of local service providers in RSD communities (43%) reporting that services had increased in the previous three years than those who worked in non-RSD communities (28%).[34]
The view that NPA RSD had contributed to expanding services and infrastructure was not uniform across the jurisdictions.[35] It seems that this outcome has depended on how effectively the NPA RSD has been used to leverage additional attention or funding for particular communities.[36] As the NPA RSD did not include significant new funding[37] for direct service delivery or infrastructure, the ability to expand services relied on using structures and processes (notably the ROC, community-based officers and the LIP process) to generate new focus and effort on addressing service gaps. This included leverage funding or enhanced services from mainstream sources that would not otherwise have been directed to remote Indigenous communities.[38]
The qualitative data in the community research study showed that generally people feel there are more services ‘on the ground’ in their community. In particular, more services for young children and parents like Save the Children, Family Support Program, KidsMatter, new crèches and preschool centres were often mentioned.
The biggest changes nominated by community members included more houses or houses were fixed up (39%), improvements in infrastructure such as buildings, water, roads and sport facilities (15%), more jobs (10%) and more services for the people (10%).
One of the outputs of the NPA RSD was the detailed baseline mapping of social and economic indicators, government investments, services and service gaps in each of the 29 priority locations. The development of the LIPs was intended to be informed by the results of the baseline mapping reports. There are clear links between the baseline reports and the LIPs, with some LIPs explicitly mentioning the baseline reports. In addition some of the issues and service gaps identified in the baseline reports were included in the LIPs. However, there are not consistent links between the baseline reports and the LIPs. This is understandable as it would not have been appropriate for the LIP actions to simply reflect service gaps identified through baseline mapping, not least because the LIPs were also to be informed by community priorities.
While the mapping process identified a number of systemic service and infrastructure deficits, in many instances the findings reveal that service levels in RSD communities were the same if not better than their non-Indigenous comparative communities.[39] The mapping exercise revealed that service levels in the areas of education, employment, policing and social services (including welfare, youth, sport and recreation), were broadly consistent with those provided to non-Indigenous communities of a similar size and location. For example, all NPA RSD and comparative communities had a preschool and a primary school and all the NPA RSD schools were funded in accordance to broader state and NT Government funding formulas and approaches that give more resources to remote schools. This overall finding is not surprising as Australian Governments collectively spend more on Indigenous Australians than non-Indigenous Australians reflecting the relative need across the two groups for services. According to the Indigenous Expenditure Report (IER), estimated expenditure per head of population was $44,128 for Indigenous Australians, compared with $19,589 for other Australians (a ratio of 2.25:1) in 2010‑11. While the IER data are not available by remoteness area, unpublished data from the Commonwealth Grants Commission show that in 2010-11, state and territory spending on Indigenous Australians in very remote areas was $46,490 per person compared to $15,160 for non-Indigenous Australians: a ratio of over three to one.[40]
There were however notable gaps in the areas of municipal and essential services, primary access roads and emergency services. For example, the National Audit of Municipal and Essential Services found that there was a significant gap in infrastructure, and municipal and essential service delivery in RSD communities when assessed against the agreed base level standards[41] and compared to the non-Indigenous comparison communities.[42] Services and infrastructure in a number of RSD communities did not meet these base level standards, particularly in relation to water, waste, animal management and environmental health provision.[43]
Another notable gap was primary access roads, with access roads in a number of RSD communities partly unsealed. In contrast, all of the comparison communities in the baseline mapping exercise, with the exception of Nhulunbuy had all-weather sealed access roads. [44] Another notable issue was the level of private sector activity. The baseline reports showed that most RSD communities had considerably less private sector activity and services than comparable non-Indigenous communities. The RSD communities that are towns such as Walgett and Fitzroy Crossing had better access to private sector services than other RSD communities.
Providing standards of services comparable to those of non-Indigenous communities of similar size and location does not necessarily guarantee service equity[45] and the baseline mapping exercise highlighted that where gaps in services exist, the reasons are complex. They arise from a mix of historical, social and economic causes that will not be remedied by matching the range and class of service levels to those of non-Indigenous communities of similar size and location. In addition the needs of remote Indigenous communities are considerably different from those of the comparison communities.
The availability of services and other factors are considered in decisions people make about where they are going to live. Biddle and Markham conducted a regression analysis of population mobility using 2011 Census data.[46] Controlling for a number of factors, the regression analysis shows that RSD communities and Territory Growth Towns (TGT)[47] had, other things being equal, a lower level of outward migration than other areas. The authors also found that those Indigenous people who left a remote dispersed settlement, were significantly and substantially more likely to move to a RSD community or a TGT than another location type. While it is not possible to establish causality, this analysis suggests that the additional services provided to RSD communities may have affected migration patterns.
Quality and use of services
The NPA RSD included a number of measures intended to improve the quality, availability, accessibility and cultural appropriateness of services. Staff delivering government services were given cultural awareness training and interpreter services were made more widely available, which contributed to services being more culturally appropriate and accessible. GBMs and IEOs assisted community members and organisations to navigate, negotiate with and access services.
The available evidence, however, does not permit a robust assessment of whether quality[48] and usage of services has improved in RSD communities to date.
In practice, service quality benchmarks framed in terms of suitability, cultural inclusiveness or comparability with other communities are difficult to precisely define. There are few existing national standards that can be referenced for remote Indigenous community service delivery. The concept of uniform standards across all Indigenous communities also runs counter to the NPA RSD’s philosophy of negotiating place-based service priorities through dialogue with local communities. Nevertheless, the Australian Government has been working to develop suitable service standards during the implementation of the NPA RSD. The ANAO notes that agreed standards for municipal and essential services were able to be negotiated with jurisdictions at the time of the baseline mapping but this was not possible for other areas such as education.[49] The agreed standards for municipal and essential services were based on pre-existing service guidelines and in some cases they were based on existing service standards. Similar pre-existing guidelines and standards did not exist for most services as was noted in the development of the baseline mapping reports.[50] The RSD Implementation Review reports that development of further service standards is in progress and was expected to be completed in 2013.[51]
In the absence of defined standards and the challenges of performance measurement, the evaluation is unable to assess whether the ‘quality’ of services has improved in this strict technical sense. In the broader sense of ‘higher quality’, some information is available from the community research study, service provider survey, and the stakeholder interviews.
The community research study asked community members if they thought five key services (police, health clinic, and Centrelink, school and employment services) had become more or less helpful since the start of the NPA RSD. The data show that most people think the health clinic (68%), school (63%), Centrelink (57%), employment services (51%) and to a lesser extent, the police (43%), have become more helpful over the past three years.
The community research study shows that more services are being utilised by community members. However, there was recognition by community members that behavioural change by individuals is still needed within communities to more fully utilise the services available. Examples given by respondents included sending kids to school, reducing violence and substance abuse, looking for employment and training and people taking full advantage of services. When asked who they would talk to about community needs and change, ‘people working in services’ were nominated by 25 per cent of respondents.
Half of all community members felt their community was on the way up or improving and ‘more services’ was one of the main four reasons given for this perception of life in community.
However, the qualitative data also revealed the following concerns: coordination in service delivery, duplication of effort, people ‘falling through the cracks’, and a lack of follow up. Generally it was felt that if services coordinated their efforts more effectively these problems would be mitigated. The qualitative data also show a strong desire for more local people to be employed in local services, particularly management positions. This would provide more sense of community involvement and control.
The survey of service providers suggests that while the focus on service delivery may have had some positive impact, there is an anecdotal view in some locations that rapid expansion of services has meant a trade-off in the short-term quality of services and the ability to engage the community to ensure high service usage levels. This view was substantiated in the stakeholder interviews[52] with some stakeholders concerned that the increase in services actually had a detrimental effect, by exacerbating competition between providers and confusing the community. On the other hand, an acknowledgment by some government stakeholders that the establishment of new services had been expedited to address urgent shortfalls, the focus now needed to switch to improving service quality and coordination.
The survey of service providers[53] found that providers were slightly more positive about improvements in accessibility of services in the RSD communities than the non-RSD communities. However, the most common response was that accessibility had remained about the same in both RSD and non-RSD communities.
In the qualitative interviews, stakeholders raised various issues about the accessibility of both existing services and the newly introduced services.[54] A key issue was the ability of residents to access visiting services that are funded to occasionally visit remote communities. In some locations, the accelerated roll-out of services and perceptions about poor engagement (see Engagement, coordination and capacity below) led to confusion amongst community members about the roles of different services.
1.7.2 Coordination, engagement and capacity
Evaluation Question 2: Has the capacity of communities and governments to engage with one another improved?
Due to the complexity of this question, the section has been divided into three sub-topics: coordination of government services, government capacity to engage communities, and community capacity to engage with government. Each topic starts with a brief description of the context followed by a summary of the evaluation findings. Further discussion is provided in Appendix A.
Coordination of government services
A broad aim of the NPA RSD is to improve the coordination efforts of government agencies.[55] Government coordination effort has been commonly cited as an impediment to overcoming Indigenous disadvantage[56], with the historically complex demarcations between different levels of government and the increasing number of NGO service providers[57] exacerbating the problem. The past decade has seen considerable focus on more coordinated approaches, often described in terms of ‘whole-of-government’ or ‘joined-up government’.[58]
In remote Indigenous communities, the goal of service delivery coordination involves improving the connections between service entities to improve the service delivery outcomes. Coordination in this sense can be seen as a continuum that extends from creating simple linkages between discrete entities; to increased coordination in a structured and planned manner; to full integration where discrete services cease to exist, replaced by a new service, unit or program.[59]
The RSD model follows a succession of Australian government strategies to improve coordination at both the strategic policy and operational service delivery levels. These include the COAG trials starting in 2002, the creation of Indigenous Coordination Centres (ICCs) in 2004,[60] and the introduction of GBMs as part of the NTER in 2007. At the strategic policy level, the bilateral plans and Boards of Management (BoMs) within each jurisdiction are intended to drive high-level coordination between and across governments.[61] At the service delivery level, the key element intended to contribute to better coordination between governments is the creation of a ‘Single Government Interface’ for each NPA RSD site, comprising the ROC and the community-based GBM and IEO positions. The LIP is intended as a further tool to facilitate a joint effort by governments and community to identify local priorities, actions for future investment and respective accountability roles.
The service delivery principles[62] espoused in the NPA RSD extend governments’ coordination role to include coordination with the myriad NGOs delivering services funded by governments.[63] Thus, the LIP priority planning process, in keeping with a philosophy of shared responsibility has also sought to capture the roles, responsibilities and contributions of NGOs and Indigenous communities themselves. In these regards, the RSD model is more ambitious than strategies focused purely on coordination between government agencies. This approach is consistent with trends in public policy literature emphasising the importance of ‘networked governance’ and ‘governance partnerships’.[64]
The evaluation found that components of the RSD model intended to improve coordination between governments had varying degrees of success in practice:
- some early gains in strategic coordination between levels of government, diminished over time[65]
- ROCs were considered to be effective in some jurisdictions but not others[66]
- local service provider meetings were viewed as having only limited impact in improving service coordination.
In the service provider survey the most common response from local service providers was that the key components of the SGI (ROCs, GBMs and IEOs) were ‘quite effective’, although more respondents were positive about the effectiveness of the locally based GBMs than they were about the ROCs.[67]
GBMs were widely considered by stakeholders as the most effective element of the model for improving coordination.[68] [69] [70] [71]
While most stakeholders considered the concept of the LIP to have merit as a means of strategically planning and coordinating service delivery at a place-based level,[72] the actual implementation of the LIP concept has tended to fall short of this objective.[73] [74]
The utility of LIPs as a tool to assist in coordinating government service delivery was perceived by many stakeholders to be constrained by the format of the plans. Most observers commented on the size and ambitious scope of the LIPs. The NPA RSD Implementation Review reported that the LIPs contain over 4000 action items, suggesting they ‘could be streamlined and better targeted toward high priority activities, such as addressing service gaps’.[75] Two-thirds of the respondents to the service provider survey who were able to answer the relevant question said that the LIPs have not been effective in ‘generating change in local communities’.[76]
This last point highlights the tension between instituting whole-of-government planning and coordination of services at the same time as trying to provide the vehicle to engage and partner the community.[77] It has proven a difficult exercise for the LIP process to perform both functions. Shorter plans containing priority actions achievable in the short to medium term would be more effective as the catalyst for proactive partnerships. However, such a plan may not be comprehensive enough as a tool for whole-of-government service delivery planning that locks in the accountability of a wide range of agencies for their service delivery commitments in a community.
What, then, has been the net effect of all of these measures on the perceived overall level of coordination of government service delivery in remote Indigenous communities? There were differing views expressed by stakeholders on this question. Some stakeholders were able to identify positive changes, some reported no improvement and others believed that the situation was, paradoxically, worse under the NPA RSD due to an increase in the number of services in communities.[78]
Stakeholders who suggested that coordination had worsened since additional services had been introduced in RSD communities often cited examples of increased duplication of services and in some cases higher levels of community confusion as a result of new organisations being funded to work with similar client groups.[79]
Key barriers to improved coordination identified in the evaluation included:
- the need for better engagement with the NGO sector
- the reliance on larger NGOs with less-developed local networks in preference to Indigenous community organisations that are better linked into local networks[80]
- the competitive funding environment for NGO service delivery[81]
- the tendency for some government and NGO service providers to operate in ‘silos’ rather than valuing linkages to coordinate and integrate their efforts[82] [83]
- the need to develop capacity or skills of service provider staff to work collaboratively or to adopt a more holistic, community development framework
- the lack of authority for local staff to go beyond existing structures in order to innovate and collaborate[84]
- a deeper capacity issue for government.[85] [86]
Local service providers were more positive than negative in the online survey on the question of whether coordination had improved in RSD communities in the past three years. On this measure, 35 per cent said coordination of services was better and 16 per cent said it was worse, however 37 per cent said it was about the same (and 12% did not know).
The above evaluation findings are consistent with research on the ICC model for whole-of-government coordination.[87] That research found that mechanisms such as co-locating staff from multiple agencies within a single office were insufficient to improve coordination in the face of unsupportive system architecture for joined up government, a programmatic focus and centralised decision-making. Many of these barriers were also identified in the evaluations of the COAG trials.[88] While the NPA RSD coordination mechanisms have gone some way, more fundamental reforms are needed to achieve fully integrated, seamless service delivery systems in remote Indigenous communities.[89]
Governments capacity to engage communities
Effective processes of engagement are critical for achieving a conversation not just to improve coordination and align services with priorities, but also to improve responsiveness to community needs and aspirations.
In this context, engagement refers to how governments and service providers (including NGOs and funded services) interact with members of remote Indigenous communities. Engagement by governments with the ‘community’ takes place at several levels, including: individual service recipients, families, leaders, Indigenous organisations and representative bodies.
Key elements in the NPA RSD to improve engagement by governments with communities include:
- the SGI (comprising the ROC and the community-based GBMs and IEOs) is intended to lead government’s processes of engagement with communities
- the LIPs are intended to be the vehicle for governments to engage and partner with the community to identify priorities and plan collaborative responses
- the LRG is intended to be the focal point for government’s engagement with community around LIP planning and implementation, and for discussing service delivery issues more generally.
By late 2011, the Coordinator General concluded that the SGI is working and showing positive results, noting that ‘one of the strengths of the Remote Service Delivery approach is the provision of a strong and permanent presence in Indigenous communities that allows the building of long-term relationships with community members’.[90]
The evaluation, through the stakeholder interviews and service provider survey has also confirmed that the community-based GBM and IEO staff[91] had a significant and positive impact on government’s engagement with remote Indigenous communities. The majority of stakeholders considered the IEO role to be critical. Government stakeholders in particular felt that the IEO provided valuable information about the community that they would not otherwise be able to access.
Excluding not stated responses, 69 per cent of respondents to the service provider survey reported that GBMs were effective in helping community engagement while 68 per cent of respondents noted that IEOs were effective.[92]
Despite some general criticisms around the LIP processes, there have clearly been jurisdictional and regional differences, with better engagement processes adopted in some locations. Although the aggregated service provider survey varied in relation to the effectiveness of the LIPs in helping community engagement, there was a very positive response in WA, compared to a largely negative response in NSW and SA; while the response in the other two jurisdictions was more or less split.[93] The stakeholder interviews[94] contained several positive endorsements of the engagement approaches used by some ROCs and some of these good practice case studies such as governance and cultural mapping are highlighted in the Coordinator General’s reports.[95] A different view was the lack of feedback to some communities around the LIP implementation and that the LIP review process has been slow in most locations.[96]
There is a tension between the LIP’s dual functions as a tool for service delivery coordination and community engagement. Over time, stakeholders have reported that the model has become inwardly focused on government service provision and coordination issues, with increasingly limited involvement of the community in discussions about the progress of the LIP, ongoing planning and priority-setting.[97]
The community research study tried to measure the engagement of local people in the communities by investigating the knowledge level of the SGI components. The LRG was the most well-known component with 61 per cent of respondents being aware of their LRG. Over half of the people knew about the IEO in their community (54%) while less than half knew about the GBM in their community (43%). Knowledge of the RSD model appears to be higher for older respondents.
In relation to the LIP, over half (52%) answered ‘no’ when asked if they knew about the LIP, with one third (35%) of respondents answering ‘yes’.
Of the people who had heard of the LIP, thirty per cent thought that it told the ‘right story’ about their community and a further 18 per cent thought it told the right story ‘a little bit’. Quite a number knew about the LIP but had not seen it (34%). Older community members (45 plus) and the employed were more likely than others to be aware of the plan.
While the development of LIPs led to a short burst of positive community engagement during 2010, this largely fell short of a genuine negotiation about service delivery priorities to institute an ongoing partnership between governments and Indigenous communities. Reasons identified by stakeholders included:
- the short timeframes for LIP completion
- in some locations, top-down engagement approaches
- the design of LIPs needing to address multiple areas simultaneously rather than strategically focused plans on place-based enablers for change
- governments’ evolving capacity to engage communities in the way the NPA RSD intended
- in practice, the aspect of the LIP concept focused on service delivery coordination and accountability has taken precedence over its other intended function as a partnership and engagement mechanism
- while the LIP has been a useful coordination tool, in most places it has not fulfilled the NPA RSD goal of serving as a focal point for an ongoing conversation about service delivery improvement
- the variable effectiveness of the LRG concept as a mechanism for governments’ engagement with communities around the LIPs in many places
- insufficient governance capacity-building assistance to these LRGs.
In respect of service providers, there is limited clear evidence to date that service providers have improved the quality of their engagement with Indigenous communities. Some providers have benefited from using the IEOs and have participated in the ROC-led engagement processes around the LIPs, but there are concerns about the sustainability of engagement if the NPA RSD mechanisms do not continue. The increase in external organisations delivering new services in RSD communities heightens the need for community engagement, and the difficulty in achieving it.
Ultimately, the evaluation found that the LRG concept has worked as an effective community engagement channel where it was built on strong, functional community governance structures already in place. The concept has not been effective in locations where community governance and leadership capacity was underdeveloped. The RSD model has generally had limited impact in building this capacity where it was lacking and is further discussed under the subsection Community capacity to engage with government.
The variable quality of the government’s engagement with Indigenous communities underscores a frequently raised question about the capacity of government staff for effective community engagement. A 2004 parliamentary committee inquiry into capacity-building and service delivery in Indigenous communities concluded that the capacity of governments itself was ‘the area in which the most significant effort was needed in order to facilitate capacity-building in Indigenous organisations and communities’.[98] The report emphasised that ‘the capacity of agency staff is particularly important for the establishment and maintenance of partnerships with Indigenous communities’.[99] The evaluation of the COAG trials in 2006 also noted that ‘government staff need training in how to engage with respect for the protocols and processes in Indigenous communities’.[100]
The Coordinator General flagged this issue in his first report, stating that ‘[i]t is critical for governments to recognise that there is a capacity gap with respect to the new ways of working required under the National Partnership Agreement on Remote Service Delivery which goes well beyond basic cultural competency training for staff’.[101] By the time of his second report, with the LIP process well underway, the Coordinator General had reiterated this concern in the following terms: ‘While there was active engagement in all communities, I have concerns about the readiness or capacity of some officers to effectively engage with Indigenous communities’.[102]
Specific measures to increase the capacity of government staff under the RSD model include:
- delivery of thirteen ‘Building Government Capacity Workshops’ to approximately 420 participants across the country between December 2009 and May 2011[103]
- significant new funding for interpreter services was provided under the NPA RSD. Over the course of the Agreement the interpreting sector has developed considerably in the NT, Kimberley and Anangu Pitjantjatjara Yankunytjatjara (APY) lands[104] [105]
- an increased focus on cultural awareness training for staff working in remote communities. For example, the Local Community Awareness Program (LCAP) was established to provide Australian, State and local government staff working in whole-of-government business in the RSD communities with an induction to community, place, history and culture.[106] At the end of June 2013, 212 government employees and service provides have completed the programme.
As the evaluation did not ask about changes in these measures over time or compare RSD with non-RSD communities, it is not possible to measure the increased capacity and skill of government staff to engage effectively with Indigenous communities or say whether these scores represent an improvement on past practice. It is clear that the NPA RSD has brought greater focus to this issue.
The central challenge for implementing the NPA RSD’s aspiration for a more engaged approach to service delivery in remote Indigenous communities is the capacity of government systems and the staff within them to transition to a new way of working. The RSD model has enabled pockets of innovation that demonstrate the value of governments embracing the principles and practices of engagement, partnership and community development, but achieving the requisite changes in government systems and culture and the building of the requisite government capacity is a long‑term enterprise.
Community capacity to engage with governments: Community governance and leadership capacity
The RSD model recognises that engagement and partnership is two-way. Governments cannot unilaterally institute an engaged partnership with Indigenous communities; rather, communities require capacity to participate in (and initiate) the engagement and partnering relations. This is recognised through the community research study where the qualitative data show that there are two perceptions about community and individual change and development. Many people say it is a two way process and that individuals and the community has to take responsibility and change their behaviours around some aspects of community life. Others strongly feel that governments needs to listen more, be more accountable and involve more local people in employment and management roles.
A key lesson from the COAG trials was that ‘communities and their leaders need to be supported and resourced to enable development of capabilities which will assist in engaging in whole-of-government and community-led solutions’.[107] The NPA RSD recognised this critical requirement in the areas of effective governance and leadership and included an objective to ‘improve the level of governance and leadership within Indigenous communities and Indigenous community organisations’ (Paragraph 15(c)).
In addition to the shared planning and prioritised service delivery improvements embodied in LIPs, the NPA RSD also identifies an important role in the delivery of services through community organisations and Indigenous staff. This is implicit in Paragraph 15(c) and is reinforced in several of the outcomes sought from the NPA RSD.[108] The role of Indigenous community capacity in the direct delivery of services is also recognised in the ‘Service delivery principles for programs and services for Indigenous Australians’.[109]
The relevant output from the NPA RSD is the delivery of community leadership skills programs.[110] The importance of this output is recognised in the agreement through a commitment of $67.7 million over four years[111] for ‘Building community governance capacity,’ which is almost a quarter of the total funding commitment of $291.1 million.
In 2009, the Coordinator General emphasised the importance of community governance and leadership as key determinants of success:
Strong and effective leadership and good governance are a precondition for the effective roll out of the remote service delivery approach. It is clear from my early visits that around half of the 29 priority communities face governance challenges. For this reason I have focused in this report on the issue and I will be monitoring the level of support provided to assist communities to strengthen governance in the short term.[112]
In implementing the NPA RSD, activities to build community capacity for governance and leadership have occurred in the following areas:
- support for input into LIP development and implementation, through the LRGs
- culturally appropriate local research and planning projects[113]
- nationally delivered governance training
- LIP actions for the ‘community governance and leadership’ building block, which typically involve local-level community governance training and leadership programs
- capacity-building support for Indigenous community organisations.
Overall, the evaluation found little evidence of improvement in communities’ capacity to engage with governments about service planning and delivery or to bring enhanced governance and leadership capacity to bear on these matters. The evaluation found that the various activities intended to build community capacity have not been part of a consistent or integrated strategy to achieve this objective. While many activities have been worthwhile, they have not necessarily linked to the remote service delivery planning and implementation processes, tending to be patchy and time-limited.[114]
Given that community governance capacity and leadership accounted for almost a quarter of the committed funds in the NPA RSD ($67.7 million over four years[115]), the piecemeal efforts in this area have given cause for the ANAO, the Commonwealth Coordinator General[116] and the Northern Territory Coordinator General[117] to question precisely what this investment has entailed. The ANAO report on implementation of the NPA RSD stated that: ‘Internal and external stakeholders identified that governance capacity and leadership activities have not performed as expected, given the level of funding provided for it in the NPA RSD’.[118]
The current evaluation heard similar comments from a range of stakeholders, with the overall view that NPA RSD had not yet delivered any substantial improvements in strengthening community governance and leadership capacity.[119] The general impression was that community governance and leadership capacity-building has been less important than other priorities under the RSD initiative, particularly governments’ inward-looking focus on increasing service levels, improving coordination and instituting greater accountability for delivering service commitments.[120] In the view of some stakeholders, the service delivery system focus has crowded out any systematic focus on community governance and leadership by favouring external providers over community controlled service delivery.[121]
The stakeholder feedback about limited progress in building community governance and leadership capacity is corroborated by the feedback of local service providers in the online survey.[122] Around 50 per cent of local service providers perceived no difference in community governance and leadership in RSD communities in the past three years. Smaller proportions perceived either an improvement or worsening in governance and leadership.[123] The feedback for RSD communities and non- RSD communities was not significantly different in relation to this question.[124] A common theme to improve service delivery in the open-ended responses was the need for community empowerment, local ownership and community-driven responses. In a question about future priorities, the most common response was the need for improved or greater community ownership, input or governance.[125]
As the LRG was the mechanism for engagement with Indigenous communities, the community research survey asked respondents who knew about their LRG to rate its performance. Survey results show that over one third of the respondents who were aware of the LRG[126] rated them highly (7‑10 out of 10) for three separate components: talking up for the community (44%); talking up for individuals (37%); giving information back to individuals (35%).
In the survey[127], 24 per cent of community members were or had been LRG members. Of these, only 18 per cent reported that they had received training and over two thirds (69%) said they would like to receive more training, indicating a need for more training opportunities.
When respondents were asked who they talk to about community needs and what should be happening in their community. The most common response was to talk with community Elders - who would talk to the LRG member for me (54%). This was followed by family members (39%), members of the LRG (26%) and people working in services (25%). Only 14 per cent said they would approach the GBM or the IEO.
In the service provider survey, the LRGs or equivalent were perceived to be most effective in helping community engagement in WA followed by NSW and NT. Views were split about the effectiveness of LRGs in Qld, where they were not established on a community-wide basis in some communities. There were also mixed views and little knowledge about the LRGs in SA; although this could be because the LRGs were called Community Councils in SA and respondents to the survey may not have made this link.[128]
Ultimately, the lack of progress in building community capacity seems to be a function of the underlying tensions within the RSD model (between a service focus and a community engagement focus), the methodologies adopted in its implementation and the capacity of government staff to change traditional modes of operating. The Coordinator General has always emphasised that achieving a new, more engaged partnership between governments and communities will require a ‘community development’ approach that represents a new way of working in remote Indigenous communities.[129] Effective community development is a complex undertaking that has numerous pre-requisites, including systemic changes around flexible, multi-year funding, and investment in the capacity of government staff to better engage communities and adopt community development methods. The evidence suggests that in practice, it has been difficult to implement such fundamental shifts in systems, mindsets and capacities.[130]
Fisher[131] has also pointed to a ‘strategy ceiling’ in the remote Indigenous service delivery environment, whereby broader strategic goals about engagement and community development give way over time to day-to-day management concerns around the complex business of planning and budgeting service delivery. Fisher considers this strategy ceiling as ‘the most important barrier to the prospects of achieving development approaches to remote services in Australia’. He notes that the tendency of strategies to default back to a managerial focus is often expedited by reporting frameworks that focus attention on measuring service inputs and outputs, rather than strategic goals around community development. This analysis provides a good summary of how the focus on the strategic goals of building community governance and leadership capacity diminished during implementation of the NPA RSD.
1.7.3 Closing the Gap outcomes
Evaluation Question 3: Have there been changes in the RSD sites that contribute to the Closing the Gap objectives?
The Closing the Gap framework
An important test for any government initiative in remote Indigenous communities is whether it contributes to the government’s strategic aim of closing the gap between life outcomes for Indigenous and non-Indigenous Australians. Under the National Indigenous Reform Agreement (NIRA), COAG committed Australian governments to six high level ‘Closing the Gap’ targets across seven ‘building blocks’.[132] The seven building blocks are early childhood, schooling, health, healthy homes, safe communities, economic participation and governance and leadership.
The high level targets are:
- close the current life expectancy gap within a generation
- halve the gap in mortality rates between Indigenous and non-Indigenous children under five within a decade
- halve the gap in reading, writing and numeracy achievement between Indigenous and non-Indigenous students within a decade
- halve the gap in employment outcomes between Indigenous and non-Indigenous Australians within a decade
- ensure access to early childhood education for all Indigenous four years olds in remote communities within five years
- halve the gap for Indigenous students aged 20 to 24 years old in Year 12, or equivalent, attainment rates by 2020.
Assessing progress towards Closing the Gap in RSD sites
The preamble to the NPA RSD states that the agreement ‘contributes to the Closing the Gap targets agreed in the National Indigenous Reform Agreement’ (Paragraph 5). As it does not itself provide significant new funding for services in the seven building blocks, the intention implicit in the NPA RSD is that the Agreement will contribute to Closing the Gap through creating a new model for remote services that are better planned and coordinated, are comparable to mainstream standards, are better measured, and are more responsive and appropriate for community needs as a result of better engagement. The model is therefore intended to enhance and optimise the Closing the Gap outcomes expected to be achieved through the significant new investments under other NPAs in specific areas such as housing, health, early childhood, education and economic participation.[133]
As such, Evaluation Question 3 does not seek to quantify the NPA RSDs specific impact on Closing the Gap but rather to assess whether there have been changes to RSD sites that are contributing to Closing the Gap objectives.
Although the NPA RSD could not be expected to close the gap on its own, improvements in Closing the Gap will nevertheless be an important measure of its success over time. If the RSD model is achieving its objectives as shown in its logic frame,[134] then the consequent improvements to service delivery would be expected to contribute to the Closing the Gap objectives. At a systemic level, it would be hoped that implementing a better system for coordination and engagement around services would improve service delivery outcomes. More specifically, the concerted effort to implement LIPs to address priority service and infrastructure gaps could be expected to influence the Closing the Gap outcome areas over time. Although the LIPs are tailored place-based interventions that prioritise some building blocks over others depending on local needs and preferences, they are intended to reduce Indigenous disadvantage. Thus, measuring progress against Closing the Gap objectives in the RSD communities is necessary to assess whether the new service delivery model and the LIP planning efforts are making a difference to life outcomes for Indigenous people.
There are two main difficulties for this evaluation in seeking to assess progress against the Closing the Gap objectives in the RSD sites. First, implementation of the RSD model has not been in place long enough to expect to see significant changes in the Closing the Gap indicators. Second, there are several limitations regarding the data available to make reliable assessments of change.
In relation to the first challenge, although the Single Government Interface was being established in late 2009 and early 2010, the key element of the RSD model that is intended to initiate actions to address the various Closing the Gap outcome areas is the LIPs, which were only in place in most sites by late 2010 or the first few months of 2011. For most indicators, data are only available for either 2011 (such as the census data and most of the health data) or 2012 (such as most of the administrative data). Therefore, the time from implementation of LIPs commencing to the measurement of outcomes will in most cases range between about six to 18 months. At the most, LIP implementation might have been underway for about two years at the time that data are available to measure outcomes.
In relation to the second evaluation challenge, regarding data limitations, it should be noted that for many outcome areas it is not possible to reliably analyse data at the community level. This is due to either the level at which data are reported or the fluctuations that result when small numbers are involved. As explained in Chapter 7, available data such as police statistics may be imperfect indicators of the underlying outcome being measured.
In this overview chapter, consideration of the NPA RSD’s contribution to the Closing the Gap objectives has been guided by the following information and data sources:
- Census data covering housing, education and employment reported in Chapter 7
- administrative data relating to policing, school attendance, employment services and other outcome areas, reported in Chapter 7
- data about health indicators analysed by the Australian Institute of Health and Welfare in Chapter 7
- the perceptions of community residents about changes in remote Indigenous communities, as reported in the community research study findings in Chapter 4
- the perceptions of service providers about changes in remote Indigenous communities, as reported in the survey data in Chapter 6
- the regular observations and assessments of progress by the Coordinator General for Remote Indigenous Services, reported in his six-monthly reports.
The stakeholder interviews reported in Chapter 5 did not canvass participants’ perceptions of changes in Closing the Gap outcome areas. However, the community surveys (Chapter 4) did investigate community perceptions of changes in key outcome areas and provide a useful contrast with the quantitative data about Closing the Gap progress.
The rest of this section will review the evidence available to date in relation to each of the Closing the Gap building blocks.
Early childhood
Progress is being made across remote Australia, including in RSD communities, towards universal access to early childhood services for Indigenous children. The Closing the Gap target is, within five years, to provide all Indigenous children in remote communities with access to early childhood education. Administrative data show that in 2012 there were 550 Indigenous children aged four and five years old living in RSD communities who were enrolled in an early childhood education program, representing 95 per cent of the eligible population. This matches the target of 95 per cent and is higher than the Indigenous rate in remote Australia, which was 88 per cent in August 2012.[135]
In late 2012, the Coordinator General observed that ‘there has certainly been progress in early childhood services across the Remote Service Delivery communities’.[136] He noted that the State and NT governments are ‘on track to providing the facilities to ensure that all children will have universal access to a preschool program for 15 hours per week, 40 weeks per year, delivered by a teacher who is university trained and degree qualified’. However, the Coordinator General pointed out that just because the facilities are in place, this does not guarantee that families will access early childhood programs. He noted that many Indigenous families were ‘not regularly utilising the services available to provide education for young children’ so ‘more active engagement with community members’ will be needed.[137]
The community research study quantitative survey shows that the majority of respondents consider that more young children are going to preschool now compared to three years ago; over half said it was ‘happening all of the time’ and a further 28 per cent said it was ‘happening some of the time’.
A good measure of how young children are developing in Australian communities as they enter their first year of formal full-time school is the Australian Early Development Index (AEDI). The early childhood development areas assessed in the AEDI are important markers of the welfare of children, and can predict future health and human capital outcomes.[138] For children starting school, teachers complete a checklist measuring five areas of early childhood development.[139] A baseline for the RSD communities is available through the data collection in early 2009 (supplemented by further collection in early 2010), which was before implementation of key elements of the NPA RSD. Progress can be measured by considering the data from early 2012, although this will still only capture 12 to 18 months of NPA RSD implementation. Data comparing 2012 to the pre-NPA RSD baseline are available at the community level for nine of the 29 RSD communities.
The AEDI results for each of the five domains assessed for a child are classified as ‘on track’, ‘at risk’ or ‘vulnerable’ in that domain. The level of vulnerability in RSD communities is much higher than the national levels. In 2009 with 66 per cent of Indigenous children in the nine RSD communities assessed as vulnerable on one or more domains compared to 23.6 per cent of all children in their first year of school nationally (and 48.5 per cent for Indigenous children nationally). By 2012 there was no statistically significant change in these measures in the RSD communities. The proportion of Indigenous children in these same nine RSD communities assessed as vulnerable on one or more domains increased slightly in 2012 to 67.9 per cent (an increase of 1.9 percentage points, which is not statistically significant).
Schooling
This building block includes two Closing the Gap targets: Year 12 or equivalent attainment rates; and achievements in reading, writing and numeracy. The third indicator reported here is school attendance.
The proportion of Indigenous 20-24 year olds attaining Year 12 (or equivalent) rose in 21 of the 29 RSD communities between the 2006 and 2011 census. However, this is not unique to RSD communities - but mirrors a broader trend across Indigenous Australia, in remote areas.
There were no statistically significant changes overall in achievement of reading, writing and numeracy[140] for Indigenous students attending schools in RSD communities in Years 3 and 5 between 2008 and 2012 (see Chapter 7). Substantial yearly variations in the NAPLAN results at school level reflect community differences and volatility of test results caused by small numbers of students in each year.
The vast majority of Indigenous students in very remote areas do not meet national minimum standards in NAPLAN and this was the case for schools in RSD communities. In several RSD communities the proportion of students meeting national minimum standard in Year 3 reading is very low – below 20 per cent.
Improving school attendance is a strong focus in many LIPs. The Coordinator General’s review of NPA RSD progress in 2012 acknowledged that a number of truancy programs had been initiated.[141] Annual school attendance data are available up to 2012, enabling comparison of the first two years of the NPA RSD with the years before implementation in most jurisdictions (shown in Chapter 7). There is no clear trend in average school attendance rates across jurisdictions or RSD sites since the NPA RSD commenced.
However, there are many individual schools where attendance rates have increased over the NPA RSD period. There were significant improvements at Mornington Island and Aurukun in Qld[142] and improvements for primary schools in NSW. However there were small declines across both primary and secondary schools in the NT, and larger declines in SA.[143]
The service provider survey of RSD and non-RSD communities in March to April 2013 asked about perceived changes in the past three years in ‘Adults studying’, ‘Children going to school’, and ‘High school kids going to boarding school’. For ‘Adults studying’, there was no perceived improvement. For the school attendance questions, although the most common answer was that things were about the same, a much larger proportion of respondents perceived improvement than those who thought attendance had declined.[144]
Most community members in the community research study were of the opinion that local schools are culturally friendly (53% happening, 28% sometimes happening), however fewer (though still the majority) were of the opinion that more children were going to school compared to three years ago (32% happening, 36% sometimes happening). The dichotomy between the administrative attendance records and the community perceptions also occurred in the Community Safety and Wellbeing Research undertaken for the evaluation of the NTER.
Health
The Australian Institute of Health and Welfare (AIHW) was engaged to analyse the available data for RSD communities relating to a range of health indicators (shown in Chapter 7). The most recently available data for most indicators was for 2010–11, the year in which most LIPs were started.
Health indicators show areas of significant need in the RSD communities. But so far, the timeframe of implementation is too short to expect to see change in indicators such as hospitalisations for chronic disease, low birth weight or mortality rates. Progress can only be assessed in one area of community service use, for disability services. From 2006–07 to 2010–11, use of disability services was higher among Indigenous than non-Indigenous people in all RSD locations.
Numbers for both aged care and alcohol and other drug treatment services are too small to report on trends, but aggregated figures indicate that services are being used. Aged care provided through Home and Community Care (HACC) was used in all RSD communities between 2004–05 and 2010‑11. There is a higher level of use of alcohol and other drug treatment among Indigenous compared with non-Indigenous residents of RSD communities, predominantly for alcohol misuse. This appears consistent with a greater level of need, as hospitalisation for alcohol-related conditions is five times as likely for Indigenous people in RSD communities than for other Australians nationally[145], up from 4.4 times based on combined data for 2003–04 to 2007–08.
The extent of need is indicated by the gap in the health status of RSD communities compared with the population generally. Residents of RSD communities generally have higher rates of low birth weight babies and mortality rates for all causes and for preventable diseases. They also have higher rates of hospitalisation[146] for diabetes, assault, dialysis, diseases associated with poor environment and for potentially preventable hospitalisations (such as vaccine-preventable conditions or those arising from acute infection or asthma).[147]
The available health data do not reveal any consistent prior trend for improvement in health status of Indigenous residents of RSD communities. The AIHW suggests that measurement of progress will not be possible until data are available for 2013, 2014, 2015, or 2020 depending on the indicator. While current data do not allow evaluation of the impact of the NPA RSD, it could provide a baseline against which to evaluate future progress when data are available spanning further years. A key lesson is that more timely data are required to evaluate a place-based initiative such as the NPA RSD.
Community members in the community research study were less positive about health outcomes in their community when compared with schooling and early childhood indicators. Around six in ten community members (63%) were of the perception that the community had a good understanding why people should not drink alcohol, sniff petrol or smoke too much. However, fewer (48%) were of the opinion that these health outcomes have been improving in their community.
Healthy homes
A critical ingredient for addressing the Closing the Gap building block of ‘healthy homes’ is reduction of overcrowding, homelessness and poor housing conditions in Indigenous communities. The 2008 National Partnership Agreement on Remote Indigenous Housing (NPARIH) committed $5.48 billion over 10 years for the construction and refurbishment of homes in remote Indigenous communities. Early work on new house construction was prioritised towards the RSD communities.[148] It was intended that government’s planning, coordination and engagement efforts under the NPA RSD would work in concert with the housing construction and refurbishment efforts under the NPARIH to optimise outcomes from new investment. In RSD communities, 1261 new houses have been constructed and 1847 houses have been refurbished as at December 2013.[149]
Census data on overcrowding show progress from 2006 to August 2011, at which time only some of the new housing work had been completed. In RSD communities to 2010–11, 439 new houses had been constructed and 945 houses refurbished. The outcomes of this work are nonetheless evident in the census data. In the RSD communities, overcrowding fell 4.6 percentage points from 2006 to 2011, which exceeds the fall in Indigenous households in very remote Australia of 1.6 percentage points.[150] In addition, the level of severe overcrowding in RSD communities (dwellings needing three or more extra bedrooms) fell by 6.4 percentage points, compared to a fall of 1.4 percentage points for very remote Indigenous households.[151] An example of the apparent direct impact of new housing is Wadeye in the NT, where 100 new houses were built and 104 houses were refurbished to 2010‑11.[152] The 2011 census indicated a reduction in overcrowding at Wadeye since 2006 from 89.6 per cent of households to 64.9 per cent of households, and a reduction in severe overcrowding from 66.9 per cent to 30.6 per cent of households.
Community members in the community research study held relatively positive views regarding the availability of healthy homes in their community. Almost all were of the opinion that people are taking responsibility for their homes (87%) and that houses are better looked after than they were three years ago (86%). Improvements to housing and other infrastructure were among the most common themes expressed by community members when asked about improvements to their communities.
The response to the service provider survey did not indicate a view that people in RSD communities were ‘looking after houses’ to any greater extent than before the RSD initiative started.[153] In fact, service providers commenting about RSD communities were less positive in this regard than those commenting about non-RSD communities. These results differ from the findings from the surveys with RSD community residents which report perceptions of changes from residents’ point-of-view and from observations by some of the community research study field work teams
Another source of data that relates to the healthy homes outcome area is the rate of hospitalisation for diseases associated with poor environmental health. As indicated in Chapter 7, between 2003‑04 and 2010–11, these rates fell significantly in six RSD communities and increased significantly in four RSD communities. This does not indicate a uniform improvement in environmental health conditions across RSD communities as at mid–2011, but these results reflect a very early stage in the implementation of both the NPARIH and the NPA RSD.
In summary, the data available to the evaluation to date show early improvement in the overcrowding situation in RSD communities but no uniform improvement yet in relation to other indicators of healthy homes. However, the Coordinator General believes there has been improvement through the NPA RSD in the way that governments work together to deliver enhancements to infrastructure and housing.[154] Noting the ‘considerable investment in infrastructure’ in RSD communities, he said that ‘I am pleased to see that generally there are improvements in the coordination of government activity, in the capacity to plan more effectively and to ensure sustainable employment opportunities are realised, especially in Queensland and the Northern Territory’.[155]
Safe communities
To assess progress against the ‘safe communities’ building block, the Australian Institute of Criminology (AIC) analysed a range of police data for the RSD communities. This analysis is summarised in Chapter 7.
There are differences in the way data about incidents and offences are collected and reported across jurisdictions and data are not available at the community level for every RSD community. The most recent data are typically for 2011–12, which can only capture changes in the RSD communities in the first one to two years of implementation of the LIPs. Significant impacts from the NPA RSD could not be expected in this timeframe, particularly as early LIP actions related to this area were typically centred on development of Community Safety Plans, rather than enhancing facilities, services or other responses to offending behaviour in the short-term. The Coordinator General has suggested that ‘progress has been patchy in this significant area’ and he has called for community safety planning to be given a higher priority.[156]
The police data do not indicate any consistent trend in levels of offending across RSD communities in the early years of the NPA RSD’s implementation. There are significant variations across and within jurisdictions, with some locations experiencing increased offence levels and some experiencing improvements. For example:
- In WA, there was no clear difference in offence patterns between RSD and non-RSD communities used for comparison. Of the RSD communities, Halls Creek saw improvements in indicators such as numbers of police recorded incidents, rates of assault and incidence of offences between 2004–05 and 2011–12, while Fitzroy Crossing saw increases.[157]
- In Qld, there was considerable variation between communities and broadly similar trends in key offence categories for both the RSD and non-RSD communities. For example, Mornington Island and Hope Vale exhibited large increases in police recorded incidents[158], while Aurukun and Doomadgee experienced reductions in alcohol-related offences in recent years.
- In NSW, there was a general downward trend for offence rates in both RSD and non‑RSD communities.
- In SA, the two RSD communities experienced a downward trend in the rate of police recorded offences from 2004–05 to 2012–13, interrupted by a sudden increase in 2009–10 that is likely the result of increased police presence in both communities.
- In the NT RSD communities, recorded incidents that had at least one offence attached increased to a peak in 2009–10 and are now generally decreasing (particularly in relation to public order, traffic and drink driving offences). A reduction in recorded incidents that had at least one offence also occurred in non-RSD communities, but the fall has been greater in the RSD communities. Alcohol-related offences have fallen steadily since 2008–09.
The analysis of police data show some encouraging signs of declines in offence levels in remote Indigenous communities in recent years. Given the timeframes of the NPA RSD implementation and the reporting of the data, it is not possible to attribute improvements to the RSD model. In some locations where there have been sharp falls in recorded offences, the most likely causal factor is introduction of new alcohol restrictions. For example, significant falls in offences at Halls Creek occurred in 2009–10 and have been attributed to the introduction of new alcohol restrictions in May 2009.[159] Similarly, the Cape York Welfare Reform evaluation found that the rate of assaults causing bodily injury in Aurukun fell dramatically (by more than half) in 2008–09 and that this is highly likely to be related to reduced trading and closure of the Aurukun tavern from March 2008.[160]
Most community members in the community research study[161] indicated that their communities were a safe place to live (82%). A smaller proportion (34%) definitely thought there was less fighting in their community than three years ago, and a further 32 per cent thought there may be less fighting. Concerns over fighting and domestic violence were very prevalent in the views expressed by community members in the qualitative research.
Some respondents to the service provider survey perceived that behaviours influencing community safety had not changed in the last three years, reporting negative changes in some places. Particular behaviours reported as becoming more common, included more ‘drinking alcohol/grog’ (25%), ‘smoking marijuana/gunja’ (34%), ‘gambling’ (27%), fighting in families (22%), fighting between families (23%), and vandalism or damage to property (22%). Overall, it is clear that service providers do not perceive any improvement in this range of social indicators during the implementation of the NPA RSD to date.[162]
Economic participation
One of the Closing the Gap targets is to halve the gap in employment outcomes between Indigenous and non-Indigenous Australians within a decade. Progress in Closing the Gap in economic participation for residents of RSD communities can be measured by examining the census data on employment outcomes, along with government administrative data about changes in the number of people dependent on welfare and job seekers registered as looking for work (as explained in Chapter 7). As the Census in August 2011 took place after less than a year of implementation of LIPs in most RSD communities, it is too soon to expect to reflect any improvements in employment associated with activities in these plans.
The best measure of increased economic participation in the RSD communities is growth in non-CDEP employment. Census employment statistics are significantly affected by the wide-spread reforms to CDEP schemes since 2009. Reductions to CDEP have led to a fall in the total Indigenous employment rate across Australia between 2006 and 2011, as CDEP has been counted as employment in official figures.[163] This fall is pronounced in the many RSD communities that were heavily reliant on CDEP employment.[164] [165]
The objective of the CDEP reforms was for former participants to increasingly take up opportunities for non-CDEP ‘real jobs’. The census figures indicate that in all but two of the 29 RSD communities, non-CDEP employment rose between 2006 and 2011.[166] Most communities saw increases of over 10 percentage points. These increases in non-CDEP employment are not unique to RSD communities as they mirror a broader rise of 10.5 percentage points in non-CDEP employment in very remote areas.[167] Part of this rise is the direct result of a government process to convert previous CDEP positions into government-funded paid positions, such as municipal workers or teacher aides.
Dependency on welfare payments is another indicator that would be expected to improve with greater economic participation. Chapter 7 examines administrative data to identify trends regarding levels of welfare dependency. The changes to CDEP also have a significant impact on these figures, as the vast majority of residents who became ineligible for CDEP transferred to other Income Support Payments (ISPs) such as Newstart or Disability Support Pension. The best measure of reduced welfare dependency is therefore the proportion of people on CDEP and ISPs combined. Between 2009 and 2012, the actual number of working age people (15 to 64) on welfare (CDEP wages or ISP) in RSD communities has remained fairly stable at around 10,700. However, because population levels have increased in RSD communities, this represents a reduction in real terms of the proportion of working age residents on welfare payments. An analysis by individual communities shows declines in working age welfare recipients in 11 RSD communities, increases in 17 communities and one with no change.[168] Overall, the data indicate some pockets of change during the first three years of the NPA RSD in residents of RSD communities moving from welfare dependency to participation in the economy.
The trend in job seekers registered as looking for work is assessed using the figures from Job Services Australia (JSA) providers in RSD communities (see Chapter 7). These data show no significant differences between RSD and non-RSD communities in the numbers of job seekers registered with JSAs, commencing with JSAs or being placed into jobs from 2010 to 2013. Across remote areas, JSA caseloads declined, commencements with JSAs stayed much the same (although there was a slight increase in RSD communities), and the number of job placements fell slightly.[169] The fall in JSA caseloads by about 7.4 per cent in RSD communities suggests some improvement in economic participation levels in these locations, although there is a similar trend in non-RSD communities, where caseloads fell by about 11 per cent.
Consistent with the NPA RSD outcome around an enhanced workforce,[170] there is evidence that some stakeholders perceive that the RSD model has provided increased employment opportunities for residents of RSD communities as a result of the expanded level of services and infrastructure in many locations. In the survey of service providers, almost a third of respondents who could answer the question expressed the view that there were more people in local jobs in RSD communities in the past three years.[171] In the stakeholder interviews, government staff in some locations pointed to increased local employment in newly funded services in RSD communities as a key achievement of the initiative.
The community surveys show that residents were very positive about attitudes towards economic participation, with almost all stating the people think it is a good idea to have a job (88%). This optimism was not however matched by perceptions of participation on the ground. Thirty nine per cent definitely thought that more people have jobs compared with three years ago while 26 per cent thought that it may be the case that more people have jobs. The lack of employment opportunities was also expressed in the qualitative research by a number of community members, who often linked the lack of jobs to other issues such as drinking and violence. It also shows strongly that people believe that many local jobs are given to outside people. They want locals to be trained so they have the skills and capacity to be employed in these local positions.
Governance and leadership
The last building block in the government’s Closing the Gap framework relates to building governance and leadership in Indigenous communities. This outcome is very difficult to measure, but the qualitative information from the evaluation about progress under the NPA RSD has been discussed above. The evidence from the stakeholder interviews and service provider survey did not indicate substantial progress in building governance and leadership within Indigenous communities and the general impression being that this area had received insufficient focus in the NPA RSD implementation.
Community members in the community research study were divided in their opinions about changes in the strength and leadership in their communities. Equal proportions of community members indicated that leadership had been strengthened in their community (35%) or that leadership had weakened (31%).[172]
The nature of this division of opinion is not immediately clear from the quantitative research. No differences were apparent by age, gender or community size. It is most likely that the strength of leadership is something that varies community by community. Positive and negative perceptions of local leadership were also apparent in the qualitative research.
1.7.4 What have we learned?
Evaluation Question 4: What have we learned that can inform remote service delivery, community capacity building, and place-based approaches?
The Evaluation of the NPA RSD affords an opportunity to reflect upon lessons learned and to inform arrangements from 1 July 2014.
Achieving expanded and better coordinated remote service delivery
Importance of a mandate for coordination and collaboration
The NPA RSD experience highlights the importance of an unambiguous, high level mandate to enable local service providers to work together and drive positive changes in service delivery.[173] The NPA RSD, signed by COAG heads of government, was considered by many stakeholders as a strong political mandate-authorisation for changing the way governments do business in remote communities. How that political mandate-authority translates to high-level organisational mandates at a state/territory and regional management level has been equally important. The stakeholder interviews revealed that differences in the success of the RSD model between jurisdictions partly reflect the relative strength of the mandate available to those implementing the initiative. In one jurisdiction, a Cabinet decision reinforced the mandate by setting out specific expectations about all state government agencies’ participation in the NPA RSD. This Cabinet decision was frequently leveraged by the officers driving the implementation. By contrast, in another jurisdiction, many state government officials saw only a weak imperative to participate in the planning and whole-of-government coordination efforts, with the result that these efforts were largely unsuccessful.
The importance of a mandate authority is illustrated by the following comment:
The mandate around the single government interface and the coordination role allows us to be in people’s faces. We’ve been running ICCs through FAHCSIA for some time – that’s been based on good will and the good skill of individuals to get people around the table but there’s nothing like having it written in stone. And that flows down to our community staff as well. ROC staff member
Senior managers then have to convert the mandate into the hard currency of relationships, agreements and partnerships to achieve the reforms.
The role of leadership within the bureaucracy
Converting a high-level mandate into genuine influence and change on the ground requires good leadership. Several stakeholders noted consistency and strength of leadership as key factors in the success of some ROCs. A feature of these successful ROCs has been low turnover in management roles, while unsuccessful ROCs have typically seen very high turnover.[174] This finding about the importance of leadership in whole-of-government working is supported from the COAG trial evaluation.[175]
Research into whole-of-government coordination has identified that a key enabler is a ‘craftsmanship’ leadership style, characterised by managing and nurturing relationships, steering change, negotiating, marshalling expertise, and using persuasion and influence’.[176] Exponents of this approach showed a commitment to creativity and innovation and were prepared to give staff permission and latitude to ‘think outside the box’, challenge established work practices and solve problems creatively. The current evaluation has shown that the strongest outcomes have been where ROC staff have strategically leveraged the process and the mandate to secure additional resources or service enhancements to institute new collaborative arrangements. The NPA RSD experience has shown that attracting staff with this skill set and orientation is a key success factor.
Capacity of government staff for whole-of-government work
The NPA RSD experience has shown the importance of attracting staff who can effectively lead whole-of-government reform, and developing the capacity of staff to work in a whole-of-government manner.[177] While there has been some investment in this training, the persistence of ‘silo’-based behaviours and an unwillingness or incapacity to share information or collaborate effectively underlines that more needs to be done. This issue has been acknowledged in reports and evaluations since government announced its intention in the early 2000s to reform service delivery on the basis of stronger engagement in government-community partnerships.[178] The need for training to better equip staff for this new ‘new way of working’ has been frequently raised by the Coordinator General.[179]
More devolved decision-making
Greater devolution of decision-making to regional and local levels was identified to improve collaboration and responsiveness of front line staff.[180] Devolving appropriate authority to ROC managers and GBMs to allocate resources, negotiate local agreements and facilitate inter-agency collaboration would strengthen delivery of ‘integrated service planning and service delivery mechanisms’.
Adequate authority is needed for staff to lead other agencies in whole-of-government coordination and community engagement. This question was raised frequently by stakeholders in relation to the crucial role of GBM positions and is consistent with other research findings that centralised decision-making has been an inhibitor to new whole-of-government initiatives in Indigenous affairs.[181]
The optimal geographic scale for place-based coordination
The results of the evaluation have posed the question of the optimal scale of ‘place’ for the purposes of whole-of-government coordination. In some sites a place-based approach at a regional level might be more effective than a focus on individual communities. Many stakeholders in NSW felt that a whole-of-government approach would have worked better at the Murdi Paaki region level, rather than in only two of the 16 communities. A regional approach in this instance may have provided levels of authority and strategic perspective to institute coordinated service delivery partnerships, and prevented the RSD initiative from ‘cutting across’ the existing Murdi Paaki regional structures and processes. Similar views were expressed in the APY lands in SA, where some of the initial RSD community-based coordination mechanisms have given way over time to regional mechanisms. For example, the Board of Management, which originally focused only on the two RSD sites, became the APY Lands Joint Steering Committee in late 2011.
Other considerations in support of a more regional approach included:
- a push in some NT towns for the LIP to become a regional plan, which would ‘align closely with the longer term government objective of developing a “hub-and-spoke” model of service delivery, where the RSD sites are central to the coordination of services to smaller outlying towns and potentially homelands and outstations’[182]
- success of the Groote Eylandt and Bickerton Island Regional Partnership Agreement.[183]
On the other hand, a place-based approach focused on individual communities has been effective and appropriate in many locations, and was supported by:
- the most positive feedback about the RSD model focused on the role of the GBMs and IEOs working at the community level to drive local coordination and engagement
- LIPs were also considered to be a valuable concept for community-level coordination and engagement.[184]
The evaluation results do not identify an optimal geographical scale (i.e. community, sub-regional or regional) for place-based coordination. Some suggested that a focus on specific communities could lead to a situation where those communities are over-serviced, at the expense of other communities in the region.[185] Decisions will depend on a range of circumstances, including geography, cultural connections between communities and historical arrangements for governance and service delivery.
A lesson from the NPA RSD is that a ‘one-size-fits-all’ model that assumes the community as the optimal level will not succeed in all locations and may even risk disrupting effective existing arrangements. Future models may need greater flexibility to tailor to particular places that embrace sub-regional or regional locations. Engaging Indigenous people about service delivery at a regional, community or even sub-community level, will be dependent on the affiliations of Indigenous groups and the current governance structures used to engage with outsiders. This geographical scale may be different to the factors relevant for place-based service planning and coordination.
Improving community engagement and capacity-building
The tension between a service enhancement focus and a capacity-building focus
The evaluation has revealed inherent tensions in the objectives of the NPA RSD that have affected the way stakeholders have approached the initiative and an assessment of its success. The dominant focus on enhanced service delivery levels has, in practice come at the expense of the goals related to building enhanced governance and leadership capacity for the community to engage with government. This tension has made it difficult to achieve a shared understanding and unified narrative around the objectives and implementation of the model.[186]
The evaluation found that:
- the urgency to focus on service gaps and improving coordination made good community engagement processes and capacity-building more difficult
- the haste to draw up LIPs meant insufficient time for adequate community engagement in many locations
- the urgency of addressing service gaps identified in LIPs meant that there was insufficient time to build the capacity for local Indigenous governance, management and delivery of the new services. Instead, there was a reliance on established NGOs with existing capacity to quickly set up new services.
The result is an impression from stakeholders[187] that the RSD model is all about government processes, rather than a genuine partnership with community where community members are empowered to drive the service improvement agenda. As a government officer observed: ‘It’s all about government, not about the community. That’s one of the big issues’.[188]
Efforts to build community capacity for engagement, governance and leadership have not been drawn together in a coherent strategy that integrates with the LIP and the LRG focal elements of the NPA RSD.[189] Stakeholders interviewed for the evaluation[190] were unable to cite examples where investments in governance or leadership development had directly contributed to the NPA RSD processes. Not surprisingly, the Coordinator General recommended the development of a specific governance, leadership and related capacity building framework with agreed measures and outcomes integrated under the LIPS.[191] The absence of this framework at the outset of the NPA RSD could be considered a ‘design flaw’ in the whole model.
Capacity of government staff for community development
Objectives in the NPA RSD to improve community governance and leadership, increase social and economic participation[192] as well as mechanisms to negotiate service delivery priorities through LIPs required a shift in the way governments had traditionally worked to encompass community development approaches. The Coordinator General identified the following key areas of a community development focus for a government service delivery perspective:
- local participation in the design, delivery and management of programs and services
- leadership and skill development of community members
- building social capital through strong networks of local groups, non-government organisations and community associations.[193]
Although the NPA RSD does not use the term ‘community development’, these principles are implied either in the Agreement or the accompanying service delivery principles.
Implementing an effective community development approach has been an immense challenge during the roll-out of the NPA RSD. Facilitating community development requires skills and mindsets fundamentally different to the aptitudes of program management. Rather than being risk averse, measured and driven by organisational structure and process; community development practitioners need to be entrepreneurs, big picture strategists, cross-sectoral networkers and cross-cultural communicators. Throughout the NPA RSD implementation, the Coordinator General has urged governments to equip staff with the skills and knowledge to undertake community development effectively. The sheer scale of the challenge in facilitating this transition is the most likely explanation as to why the NPA RSD implementation has not focused successfully on the broader goals around community capacity-building.
While the ambitious goal of shifting to a new way of working has not yet been fully realised, governments have made significant headway in positioning themselves for more engaged relationships by expanding their on-the-ground presence. Stakeholders’ comments valuing the contribution of GBM and IEO roles were often qualified with observations that these positions could be even more effective in driving and leading community improvements. The groundwork is in place and further attention to the capacity needs of staff working in remote communities could yield significant results.
Sustaining engagement between government and community
A further lesson has been that new approaches are required to sustain engagement between governments and communities. The engagement between government and community has been largely unilaterally driven by government, through the ROCs, GBMs and IEOs utilising the LIP negotiation and implementation processes. The evaluation found that the quality of this engagement was variable, and even where it was positive, it was difficult to sustain.
The fundamental challenge has been to engender a sense of community ownership in the process. If community members do not perceive a genuine influence or shared ownership in the process, it is difficult to inspire their continued participation. The perception that the RSD model has been more focused on government priorities around service delivery and coordination than community priorities around capacity-building has made it more difficult to achieve this sense of community ownership.
New ways of sustaining meaningful engagement are required to achieve the NPA RSD objectives. The Coordinator General believes a community development approach holds the best prospect of mobilising community participation in service planning and implementation:
One of the things that is so important about Remote Service Delivery is helping to put communities in the driving seat. It’s not about telling them what we’re going to do, or about just asking them what they want. It’s about the patient work of developing knowledge and understanding, of developing the capacity of local organisations to take charge and of working at their pace rather than an agenda imposed from afar.[194]
The need for more downward accountability and less upward accountability
A feature of the NPA RSD is the robust monitoring and reporting framework. This was intended to enhance the accountability of service providers for delivering commitments identified in LIPs. As the LIPs were intended to reflect community priorities and the implementation process was intended to involve a genuine partnership with local community representatives, the accountability of service providers was intended to be as much ‘downward accountability’ to the community than ‘upward accountability’ to government.
In practice, the accountability embedded in the NPA RSD reporting has tended to be more upward than downward. Stakeholders stated that the nature of the reporting processes has overwhelmingly centred on reporting to senior levels of the public service and to government ministers. Although stakeholders reported that there was considerable effort to engaging with communities, the difficulty of sustaining meaningful engagement of community representatives in the LIP processes due to time constraints has diminished the downward accountability back to the community.[195]
Research from the international development field suggests that clear mechanisms for downward accountability are critical for development outcomes in disadvantaged communities.[196] In remote Australia, regular communication between government and community about progress in meeting service delivery priorities would seem to be an essential foundation for the new partnership envisioned by the NPA RSD. This is another area where greater focus on community governance and leadership development has been a missing ingredient in the RSD initiative to date. Support for strong community governance structures and empowered local leaders may prove more effective than detailed reporting to senior public servants and ministers in keeping service providers accountable for the services delivered in remote Indigenous communities. After all, it is the members of Indigenous communities who experience the direct consequences of substandard services, not public servants and ministers.
Revisiting the merits of Indigenous community-controlled service delivery
Despite provisions, the NPA RSD has not built the capacity of Indigenous community-controlled service delivery. A continued decline in the Indigenous community organisation sector has been underway since the early 2000s, when governments dismantled Indigenous representative bodies and adopted policies that preferred competitive tendering over self-management and self-determination.[197] Some stakeholders[198] believe that the expanded service delivery through the NPA RSD has exacerbated this decline, as large NGOs have been granted contracts for services that a decade ago might have been delivered through Indigenous organisations. These stakeholders acknowledge the limitations in the capacity of the Indigenous community sector, but lament the fact that governments have not chosen the path of taking more time to invest capacity to enhance community-controlled service delivery.
The feedback of these stakeholders reinforces the view expressed by researchers on remote service delivery that Indigenous community organisations can be effective vehicles for Indigenous community development. The Desert Knowledge Cooperative Research Centre notes in its study, Desert Services that Work:
- Aboriginal and Torres Strait Islander community-controlled organisations are the hidden ingredient for the success of Government’s Aboriginal and Torres Strait Islander development objectives. The strategic importance of the sector as a whole is unrecognised in the government policy process, and the individual services that comprise the sector are undervalued. It is a complex sector, and with more support could make a wider contribution to the public good.[199]
- While nepotism, factionalism and financial mismanagement are often the dominant narratives in public discourse about Indigenous community organisations, Sullivan argues that ‘the Indigenous sector functions well in the context of the challenging needs of its member/client base and its relative lack of material resources. Its development in the last three decades is testimony to the resilience and capacity of Aboriginal and Torres Strait Islander people in their communities’.[200]
For the goals of the NPA RSD to be realised, the unrecognised potential is to address the twin problems of coordination and engagement. Indigenous community organisations may be better placed to ensure local coordination of service delivery. By contrast, externally based NGO services face underdeveloped local networks, restrictions to delivering services through visiting community staff, limited opportunity to understand what other services are being delivered in the community and to develop closer relationships with other providers. Indigenous community organisations, on the other hand, are more likely to have local staff and board members who are linked into community networks that aid collaborative relationships and improved coordination.
Two of the central problems that the RSD model seeks to address – service delivery coordination and engagement with communities – may have deepened in the past decade precisely because of the trend away from Indigenous community-controlled service delivery. Community engagement in service delivery was a lesser issue when the majority of remote services were run by Indigenous councils and community organisations in the 1990s. Coordinating service delivery was less complicated then than it is currently with the increased number of contracted service providers, many of whom have a short history of involvement with their client communities. The move to competitive tendering of services may have been prompted by valid concerns about the quality of services delivered by the Indigenous community organisation sector (and their governance and financial management capacity), but it has exacerbated the challenges of coordination and engagement. As some stakeholders suggested, a greater focus on reinvigorating community capacity to govern and manage services locally may offer a more sustainable, albeit more long-term, pathway to improving remote service delivery.
Shifting to a strategy that prioritises community-controlled or community-driven service delivery need not involve a direct loop back to the approach that governments abandoned a decade ago. Much has been learnt about good governance and effective management in the Indigenous organisation sector since that time.[201] Strong regional Indigenous community-controlled organisations offer alternatives where small remote communities do not have the capacity or the inclination to sustain viable local service delivery organisations. The past decade has seen the emergence of hybrid Indigenous/non-Indigenous organisations that can effectively pursue Indigenous aspirations while delivering sound governance, effective management and financial stability.[202] Moving forward, the new architecture for governments to engage with Indigenous communities under the NPA RSD provides an opportunity to collaborate on innovative new models for community-driven remote service delivery.[203]
Closing the Gap through service delivery
A broader question guiding this evaluation has been what changes in the RSD sites have contributed to ‘Close the Gap’ in Indigenous disadvantage. Specified as an objective in the NPA RSD, the Agreement aspires to raise the standard and range of services delivered to Indigenous families to be broadly consistent with those provided to other Australians in similar sized and located communities.[204] The inbuilt assumption that the gap in Indigenous disadvantage can be closed through expanded and better government services alone has been earlier documented as a risk for government.[205]
As discussed in Section 1.6, it is not yet possible to determine the extent to which the expansion of services under the RSD model has contributed to closing the gap in Indigenous disadvantage. The belief that traditional approaches to delivering government services will not be sufficient to close the gap also underpins the CYWR trial. Rather, government services are seen as part of the problem because in remote Indigenous communities they have had the effect of entrenching dependency and passivity. The philosophy underpinning the CYWR trial is that Indigenous disadvantage will only be overcome if Indigenous people are freed from dependency on passive service delivery, exercise greater individual and family responsibility, increase their social and economic participation and practise behaviours consistent with positive social norms.
One of the objectives in the NPA RSD is to: ‘increase economic and social participation wherever possible, and promote personal responsibility, engagement and behaviours consistent with positive social norms’.[206] The high-level logic frame (discussed in Chapter 2) indicates that this is a long-term goal of the agreement and the terms of reference for this evaluation do not include consideration of these issues.[207] Two observations that are worth noting:
- The limited progress around activities to build community governance and leadership capacity casts doubt as to whether the RSD model is on track to contribute to objective 15(e). This can be compared with the CYWR evaluation, which reported progress to its goal of rebuilding Indigenous authority to strengthen community leadership and encourage people to take responsibility for their behaviour.[208]
- The explicit aims of reducing dependency on passive service delivery and encouraging personal responsibility have not been a central feature of the NPA RSD. New services in RSD communities have tended to follow more conventional models. As noted earlier, they have often been funded through service providers external to communities rather than Indigenous community-controlled organisations. While some external service providers are making efforts to employ and train local Indigenous staff, the contribution to increasing community capacity, ownership and economic participation opportunities is less than would be the case for community-controlled services. For this reason, several stakeholders saw the way forward for remote Indigenous communities as not through establishing new services but through building community capacity for local people to take on jobs in service delivery and in business, to run local services and to exercise leadership.[209]
There are indications that a shift back to community empowerment and community control is underway in the remote service delivery environment. For example, the open competitive tendering process for Job Services Australia employment services has been replaced in remote areas by the Remote Jobs and Communities Program. While the program is still competitively tendered, service providers are required to have strong connections and engagement with remote communities, and in many cases Indigenous organisations have been the successful tenderers.
In order to achieve the NPA RSD objectives to improve community capacity, governance, leadership, social and economic participation and personal responsibility; the current evaluation suggests a need to place greater priority on community empowerment and community control in future planning of the remote service delivery system. This may be a more sustainable pathway towards closing the gap in Indigenous disadvantage than a focus on addressing service gaps alone.
1.8 Conclusion
The NPA RSD introduced a new remote service delivery model intended to contribute to closing the gap on Indigenous disadvantage in 29 remote communities across Australia. After more than three years of implementation of the new model, the evaluation has enabled assessment of the progress towards the ambitious goals of the initiative.
Together with the other investments in remote communities initiated under NIRA, the NPA RSD has contributed to expanding the quantum of services and infrastructure across the 29 target communities. A difficult question for a place-based model such as the NPA RSD is whether gains achieved by focusing on selected communities divert resources from other remote communities or represent a net dividend for remote Indigenous Australia through a more efficient planning and service delivery mechanism. The evaluation found that the NPA RSD has had an impact in expanding the quantum of services and infrastructure. The extent to which the prioritisation of RSD communities has had a net effect in closing the overall gap in levels of services across remote Indigenous Australia is more difficult to gauge. One possibility is that targeting services towards 29 communities means foregoing service enhancements for other needy communities, leading to no net improvement in the overall situation. Although it is not possible to definitively determine the net effect of the NPA RSD across remote Indigenous Australia as a whole, in theory the RSD model can contribute to a net positive outcome in three important ways:
- the RSD process can enable the leveraging of additional investments from mainstream program sources that would not otherwise have been allocated to Indigenous communities
- RSD planning processes (i.e. LIP development and coordination efforts by ROCs) can contribute to a more optimal, needs-based allocation of resources already dedicated to Indigenous communities, such as NPARIH housing funds
- the planning and coordination processes in the RSD model can generate efficiencies (e.g. removing duplication or sharing resources) that expand the quantum of services delivered with the available funding allocated to RSD communities.
The evaluation found direct evidence of the first of these impacts of the NPA RSD[210], but data were not available to assess the extent of the second and third areas of impact.
The NPA RSD introduced new mechanisms to assist coordination of service planning and delivery in remote communities, notably the Single Government Interface (comprising the ROCs, GBMs and IEOs), local implementation planning, inter-agency meetings and visitation calendars. These have had some impact in improving coordination, and both stakeholders and service providers were particularly positive about the GBM and IEO positions and the concept (if not always the reality) of a local planning mechanism in the form of LIPs. While positive, these innovations seem unlikely on their own to overcome the significant structural and systemic impediments to coordination in the current framework for delivery of services to remote communities.
The enhanced local presence of government through the NPA RSD’s community-based positions (GBMs and IEOs) has had a significant positive impact on government’s engagement with remote Indigenous communities. There were some early successes in the engagement of communities during the development of LIPs in some locations. However, the LIP implementation process has not seen the sustained level of positive engagement between government and Indigenous communities that was envisioned in the NPA RSD. Key inhibitors have been the capacity of government to engage effectively and the internal governance and leadership challenges within Indigenous communities. Further, tensions in the RSD model between a focus on service planning, coordination and accountability as opposed to partnership and engagement with communities have created challenges during its implementation.
The objectives of the NPA RSD in which the least progress reportedly has been made are in building community capacity to engage with government and building community governance and leadership capacity generally. Government’s core focus on the planning and delivery of enhanced services has tended to overshadow systematic attention to community governance and leadership, which highlights an incompatibility between the NPA RSD’s objectives. Community residents generally acknowledged an increase in infrastructure and services in their communities in recent years. On the other hand, some stakeholders perceive the NPA RSD as undermining Indigenous aspirations for community-controlled service delivery by favouring expeditious expansion of services over longer-term efforts to develop Indigenous service delivery capacity.
The NPA RSD’s targeting of infrastructure and service investment to 29 remote communities has had tangible impacts around some of the government’s Closing the Gap objectives, notably housing, infrastructure and access to early learning. These gains were recognised by many respondents in the community surveys.
The experience of implementing the NPA RSD holds many lessons for governments’ future efforts to improve remote service delivery and close the gap on Indigenous disadvantage. Better outcomes around service delivery systems seem to be contingent on sustaining strong mandates for coordination and collaboration, encouraging proactive leadership within the bureaucracy, building the capacity of government staff for whole-of-government work, devolving government decision-making to the local level and ensuring that place-based approaches are organised at the optimal geographical scale. A critical challenge is how to ensure that governments’ natural inclination to focus on service delivery issues does not hinder its capacity for deeper and more sustained engagement with Indigenous communities, or divert its attention from community capacity-building. Greater success in engaging and building Indigenous communities will require government officers in remote areas to learn new ways of working, embracing community development methodologies. Frameworks for reporting and accountability for outcomes will need to be oriented more towards the most important stakeholders in the ‘Closing the Gap' enterprise, Indigenous communities and their representatives, and less towards senior levels of government. There has also been insufficient attention to the possibilities offered by Indigenous community-controlled service delivery in improving remote services, particularly as a means of addressing the twin challenges of better local coordination and greater community engagement.
At a more fundamental level of analysis, the NPA RSD experience prompts reflection about whether expanded and improved government services alone can be expected to completely close the gap in Indigenous life outcomes. Governments must necessarily continue to refine and improve frameworks to deliver better services in remote Indigenous communities. However, one of the biggest issues around community capacity-building and governance development is how to empower Indigenous communities themselves to generate and lead solutions to Indigenous disadvantage.
2 Introduction
Evidence and Evaluation Branch
2.1 Chapter outline
This chapter provides a description of the National Partnership Agreement on Remote Service Delivery (NPA RSD). It provides more detailed information about the NPA RSD to that presented in Chapter 1.
The chapter commences with a brief description of the background to policy development around reformed service delivery and the commitment to Closing the Gap in Indigenous disadvantage.
The next section describes the key elements of the NPA RSD approach including the priority locations, Single Government Interface (SGI), building the evidence base, Local Implementation Plans (LIPs) and other outputs specified in the NPA RSD. These key components are further explained in this chapter, along with the remaining outputs identified in the NPA RSD, followed by a description of the governance model and funding allocations for the NPA RSD.
In some RSD locations there are arrangements, agreements or plans that complement the NPA RSD by aiming to address local Indigenous disadvantage. This chapter provides a summary of the key complementary programmes in each jurisdiction, with further detailed descriptions of each programme provided at Appendix B.
The chapter concludes with a description of the evaluation strategy, including a high level logic frame, and key components of the RSD evaluation.
2.2 Background to coordinated service delivery to overcome Indigenous disadvantage
This section provides a brief description of past and present policy initiatives centred on delivering better coordinated service delivery to address Indigenous disadvantage that helped shape the NPA RSD.
2.2.1 Reforming service delivery
A new approach to service delivery in Indigenous affairs focussing on a whole-of-government approach was announced in 2002 when the Council of Australian Governments (COAG) agreed to trial a whole-of-government cooperative approach to Indigenous affairs in eight sites across Australia known as the COAG trials.[211] The aim of the trials was to improve the way governments work together and with communities to deliver effective responses to the needs of Indigenous Australians.
The three key features that underpinned the COAG trials were:[212]
- whole-of-government approaches
- shared responsibility between governments and communities in finding solutions
- place-based frameworks.
The objectives of the trials were to:[213]
- tailor government action to identified community needs and aspirations
- coordinate government programmes and services where this will improve service delivery outcomes
- encourage innovative approaches traversing new territory
- cut through blockages and red tape to resolve issues quickly
- work with Indigenous communities to build the capacity of people in those communities to negotiate as genuine partners with government
- negotiate agreed outcomes, benchmarks for measuring progress and management of responsibilities for achieving those outcomes with the relevant people in Indigenous communities
- build the capacity of government employees to be able to meet the challenges of working in this new way with Indigenous communities.
In 2004 the Australian Government expanded the commitment to build and improve on partnerships between the Government and Indigenous communities by incorporating Shared Responsibility Agreements (SRAs) and Regional Partnership Agreements (RPAs) into the partnership arrangements.[214]
SRAs outlined what all partners - communities, governments and others - will contribute to bring about long-term changes to achieve better outcomes for Indigenous communities. Associated with the SRA approach was the development of the concept of RPAs. Whereas SRAs had a local focus, RPAs aid in planning, strategic investment and partnerships at the regional level. RPAs are agreements with networks at the regional level which outline broad priorities and principles for the region concerned. A number of RSD locations are also covered by current RPAs (See Section 2.6 and Appendix B).
All eight trials were evaluated in 2006. COAG recognised the need to more broadly apply lessons learned from the trials throughout all Indigenous communities. As stated in the Synopsis Review of the eight COAG trials “…the trials could not completely fail because the ‘lessons learned’ are legitimate outcomes”.[215]
A direct outcome of the COAG trials was the creation of Indigenous Coordination Centres (ICCs). ICCs were established in both remote and urban locations in 2004 where it was intended that staff from key Australian Government agencies involved in funding and servicing Indigenous communities would be co-located in one physical location.
The introduction of the Northern Territory Emergency Response (NTER) in June 2007 provided further development of the whole-of-government approach to Indigenous affairs by introducing Government Business Managers (GBMs) and Indigenous Engagement Officers (IEOs). Under the NTER, GBMs were tasked with coordinating all government activities within the communities they serve and the complementary IEO role was to work to promote mutual understanding between government and the communities.
2.2.2 National commitment to Closing the Gap
In December 2007, all Australian governments made a commitment to Close the Gap between Indigenous and non-Indigenous Australians.
In 2008 COAG committed to achieving six Closing the Gap targets covering health, housing, employment and education in recognition that life outcomes for Indigenous Australians are well below those of non-Indigenous Australians (see below for the specific targets). To achieve the targets, COAG identified seven areas or ‘building blocks’ where coordinated action is required to reduce the current levels of disadvantage:
- early childhood
- schooling
- health
- healthy homes
- safe communities
- economic participation
- governance and leadership.
The key COAG agreement aimed at ‘Closing the Gap’ was the National Indigenous Reform Agreement (NIRA) which was agreed by COAG in November 2008.
The NIRA provides an integrated framework for the task of Closing the Gap, based on the seven building blocks and sets out the objectives, outcomes and outputs needed to close the gap in Indigenous disadvantage. COAG has agreed to the following 'Closing the Gap' targets:[216]
- close the current life expectancy gap within a generation
- halve the gap in mortality rates between Indigenous and non-Indigenous children under five within a decade
- halve the gap in reading, writing and numeracy achievement between Indigenous and non-Indigenous students within a decade
- halve the gap in employment outcomes between Indigenous and non-Indigenous Australians within a decade
- ensure all Indigenous four year olds living in remote communities have access to early childhood education within five years (2013)
- halve the gap for Indigenous students aged 20 to 24 years old in Year 12, or equivalent, attainment rates by 2020.
The NIRA brings together commitments from across the Indigenous specific and mainstream National Partnership Agreements (NPAs). It sets out the policy principles, objectives and performance indicators underpinning Closing the Gap.
COAG agreed to a number of NPAs, both mainstream and Indigenous-specific to support the NIRA to achieve the Closing the Gap targets.[217] This included the National Partnership Agreement on Remote Service Delivery (NPA RSD) which was agreed by COAG at its meeting in November 2008 and signed in January 2009.
2.3 Remote Service Delivery Approach
The NPA RSD is a place-based approach to service design and delivery aimed at ensuring Indigenous Australians receive and actively participate in services to Close the Gap in Indigenous disadvantage. The NPA RSD supported other relevant NPAs to prioritise investment to the RSD priority locations.[218]
The objectives that the NPA RSD, together with other relevant COAG agreements, will contribute to are:
- to improve the access of Indigenous families to a full range of suitable and culturally inclusive services
- to raise the standard and range of services delivered to Indigenous families to be broadly consistent with those provided to other Australians in similar sized and located communities
- to improve the level of governance and leadership within Indigenous communities and Indigenous community organisations
- to provide simpler access and better coordinated government services for Indigenous people in identified communities
- to increase economic and social participation wherever possible, and promote personal responsibility, engagement and behaviours consistent with positive social norms.
The main foundations of the RSD model are:
- a place-based approach involving priority locations
- establishment of a SGI in each community to coordinate services and provide an interface between governments and communities
- collection of baseline evidence to assist in monitoring progress
- development of LIPs that allow for holistic and integrated approaches to address the multiple challenges facing communities
- achievement of a number of outputs designed to meet the objectives and outcomes of the NPA RSD.
The major foundations of the RSD model are described below, including key outputs outlined in the NPA RSD, funding of the RSD approach and the governance model. Progress on the implementation of these components, as well as other outputs, is presented in Chapter 3.
2.3.1 Priority locations
To develop and assess the RSD approach priority locations were selected, guided by the following principles:
- significant concentration of population
- anticipated demographic trends and pressures
- potential for economic development and employment
- pre-existing shortfalls in government investment in infrastructure and services
- potential to build on other significant investment already in progress or on community‑based initiatives.
Taking these principles into account the areas identified for investment under the NPA RSD included locations in the Cape York and Gulf regions of Qld, the Kimberley in WA, the Anangu Pitjantjatjara Yankunytjatjara (APY) Lands in SA, the Murdi Paaki region of western NSW, and 15 larger communities in the NT.
The 29 priority locations (also referred to as RSD communities) were announced on 21 April 2009[219] and are presented in Table 2.1.
Table 2.1 RSD priority locations for each jurisdiction
|
State |
Community/Area |
|---|---|
|
Northern Territory |
Angurugu, Galiwin’ku, Gunbalanya, Gapuwiyak, Lajamanu, Maningrida, Milingimbi, Wurrumiyanga (Nguiu), Ngukurr, Numbulwar, Ntaria (Hermannsburg), Wadeye, Yirrkala, Yuendumu and Umbakumba |
|
Queensland |
Mornington Island, Doomadgee, Aurukun, Hope Vale, Mossman Gorge and Coen[220] |
|
Western Australia |
Fitzroy Crossing and surrounding communities[221], Halls Creek and surrounding communities and the Dampier Peninsular (Beagle Bay and Bardi Jawi communities[222]) |
|
South Australia |
Amata and Mimili |
|
New South Wales |
Walgett and Wilcannia |
The communities range in size from small to large, with 13 communities with a population of less than 800, nine with a population of 800 to 1,200, and seven communities with a population greater than 1,200.[223] In the majority of communities Indigenous people make up greater than 90 per cent of the population, with over 90 per cent of people speaking an Indigenous language at home (Table 2.2).
Table 2.2 Demographic information by community
|
RSD Community |
Total 2006 ERP* |
Indigenous 2006 ERP* |
% Indigenous 2006 |
Median Age 2011 |
% Indigenous Language spoken at home 2011 |
|---|---|---|---|---|---|
|
Angurugu |
1045 |
1013 |
97 |
21 |
92.3 |
|
Amata |
373 |
341 |
92 |
23 |
93.8 |
|
Ardyaloon |
275 |
243 |
88 |
20 |
18.5 |
|
Aurukun |
1130 |
1059 |
94 |
25 |
96.4 |
|
Beagle Bay |
260 |
238 |
91 |
20 |
0.0 |
|
Coen |
270 |
239 |
89 |
25 |
15.9 |
|
Doomadgee |
1170 |
1102 |
94 |
20 |
2.1 |
|
Fitzroy Crossing # |
1018 |
733 |
72 |
24 |
78.4 |
|
Galiwin’ku |
2290 |
2158 |
94 |
21 |
97.0 |
|
Gapuwiyak |
1258 |
1208 |
96 |
24 |
93.6 |
|
Gunbalunya |
1226 |
1141 |
93 |
22 |
91.7 |
|
Halls Creek # |
1335 |
1092 |
82 |
23 |
35.7 |
|
Hope Vale |
842 |
797 |
95 |
24 |
90.9 |
|
Lajamanu |
845 |
735 |
87 |
20 |
95.6 |
|
Maningrida |
2781 |
2600 |
93 |
22 |
96.5 |
|
Millingimbi |
1141 |
1086 |
95 |
24 |
98.8 |
|
Mimili |
317 |
289 |
91 |
22 |
95.1 |
|
Mornington Island |
1122 |
1028 |
92 |
21 |
10.0 |
|
Mossman Gorge |
172 |
165 |
96 |
31 |
28.3 |
|
Wurrumiyanga (Nguiu) |
1543 |
1463 |
95 |
24 |
94.6 |
|
Ngukurr |
1137 |
1055 |
93 |
20 |
96.7 |
|
Ntaria (Hermannsburg) |
999 |
938 |
94 |
22 |
93.3 |
|
Numbulwar |
783 |
713 |
91 |
24 |
90.2 |
|
Umbakumba |
459 |
434 |
94 |
23 |
97.2 |
|
Wadeye |
2222 |
2074 |
93 |
19 |
95.7 |
|
Walgett |
2257 |
1220 |
54 |
22 |
0.0 |
|
Wilcannia |
628 |
453 |
72 |
24 |
3.2 |
|
Yirrkala |
1697 |
1472 |
87 |
25 |
80.5 |
|
Yuendumu |
794 |
701 |
88 |
25 |
91.6 |
* Estimated Resident Population
# Indigenous Area
2.3.2 Single Government Interface
A key output of the NPA RSD was the establishment of a SGI to improve coordination of government services in each of the RSD locations (Paragraph 17(a)). The aim of the SGI is to focus and simplify interaction between communities and all government agencies. At the regional level there are Regional Operations Centres (ROCs) supporting Government Business Managers (GBMs) or equivalent and Indigenous Engagement Officers (IEOs) at the community level.
Further detail on the three facets of the SGI is provided below.
Regional Operations Centres
ROCs were originally designed as a single location in each state and territory where Australian and state/territory government staff could work together to better administer services. ROCs report to a Board of Management (BOM)[224] in each jurisdiction. ROCs were also assigned responsibility to work with local Indigenous people to develop LIPs (discussed in detail in Section 2.3.4). This model of co-locating both Australian and state/territory staff goes beyond the ICC model which only included Australian Government staff. The ROC model has changed over time in some jurisdictions. These changes are discussed in Chapter 5 (Section 5.5.2).
There are six ROCs located in:
- Darwin, NT
- Cairns, Qld
- Mount Isa, Qld
- Broome, WA
- Adelaide, SA[225]
- Dubbo, NSW
As well as supporting the work of the GBMs and IEOs, ROCs also work with government agencies to ensure effective service delivery at the community level.
Government Business Managers (or equivalent)
GBMs, or their equivalent, are locally based government staff whose role is to coordinate service delivery commitments made by governments under the NPA RSD between agencies and the community.
The GBMs provide a direct link between the community and government and act as senior ‘champions’ or ‘business managers’. Key roles of GBMs include:
- being the key government liaison and consultation point in communities
- working collaboratively with other government representatives
- assisting with community planning and agreement making
- ensuring that services are coordinated in the community
- reporting on progress and on local issues and concerns to the ROC and state/territory BOM.
The GBM role had different and evolving titles in each jurisdiction, and is now only referred to as a GBM in SA. In Qld, the GBMs in the Gulf communities are known as Government Engagement and Coordination Officers (GECOs) and in the Cape York communities as Government Coordination Officers (GCOs). In WA, GBMs are referred to as Local Area Coordinators (LACs), in the NT as Government Engagement Coordinators (GECs) and in NSW as Remote Service Delivery Coordinators (RSDCs).
Indigenous Engagement Officers (or equivalent)
IEOs are Indigenous government staff who speak the local language/s and are recruited from within the priority locations. They assist the GBMs in their community liaison and engagement work and help to support their communities.
Key roles of the IEOs include:
- to provide a critical coordination and communication role within their community
- to more effectively link community and government
- to build greater trust and understanding between community and government.
IEOs are known by different titles in some places in order to be more appropriate to the cultural requirements of particular communities. They are also known as Aboriginal Engagement Officers (AEOs) in some locations and Anangu Engagement Officers in the two SA locations.
2.3.3 Building the evidence base
Existing evidence was collated to provide a starting base for monitoring progress of the NPA RSD and assist in developing LIPs. There are three main components to building the evidence base specified in the NPA RSD - baseline mapping reports, local research and planning projects, and identification of community networks. Brief descriptions of these components are outlined below.
Baseline mapping reports
Baseline mapping is defined broadly in the NPA RSD as ‘the completion of detailed baseline mapping of social and economic indicators, government investments, services and service gaps in each location’ (Paragraph 17(b)).
Baseline mapping reports were produced by the Australian Government for each of the 29 priority locations to be used as a local planning tool for governments of all levels and the community itself. The baseline mapping reports provided one input for LIPs and also assisted with monitoring and evaluation.
Major components of the baseline mapping reports are outlined below.
Social and economic indicators: Establishing baseline indicators of social and economic conditions under each building block in each community allowed for a base to measure any subsequent change in the RSD locations.
Government investments, services and service gaps: The baseline mapping reports provided information on the services available in the community, the government infrastructure available from which to deliver the services, and the existing levels of government input to service delivery in the community. The reports also identify major service issues and deficits.
Municipal and essential services: A key aspect of baseline mapping relates to identifying municipal and essential services in each community. The national audit of municipal and essential services was conducted in 2008 under the National Partnership Agreement on Remote Indigenous Housing (NPARIH).[226] To avoid duplication the audit was expanded to include all 29 RSD priority locations and key information was included in the baseline mapping reports.
Population projections: Population projections were prepared for each location as planning for services in the future should be based on population projections rather than estimates of current population.
Local research and planning projects
Local research and planning projects supported RSD locations to carry out research on issues of importance in a culturally informed way as per Paragraph 19(f) of the NPA RSD. Research and planning by local residents strengthens engagement, informs the evidence base, develops capability at the local level and helped to facilitate the achievement of broader objectives under the NPA RSD.
In addition to providing governments with stronger evidence and a community perspective, the projects aligned with calls from the Coordinator General for Remote Indigenous Services[227] for a community development approach involving:
- motivating community members to participate in a process which allows them to express their needs and to decide their own future
- community members owning and defining problems and solutions, including measuring success or failure
- employing local people and providing relevant training
- a cyclical action-learning approach to programming, with cycles of design, monitoring, evaluation and redesign.
Proposals for projects were initiated following an expression of interest from the local Indigenous community and developed jointly between representatives from the community and the ROC with support from the former Department of Families, Housing, Community Services and Indigenous Affairs (FaHCSIA). The projects are supported by suitably qualified consultants endorsed by the community. The projects are listed under ‘building the evidence base’ in Section 3.3.1 and Appendix F.
Identification of community networks
The NPA RSD indicates that the Australian Government is responsible for mapping of ‘existing community networks and decision-making processes as the basis for establishing legitimate Indigenous community governance structures and decision-making processes’ (Paragraph 19 (e) (ii)).
The aim of ‘mapping’ existing community networks and decision-making mechanisms was so that:
- government and community have a ‘baseline’ from which they can identify decision-making mechanisms within the community
- community representatives or decision-making bodies could be identified so that LIPs could be negotiated, agreed and signed
- individuals or groups interested in leadership and governance training can be identified
- over the long-term, leadership and governance in the community is strengthened.
The intention was that each community identify an effective decision-making body or bodies that are representative of the broader community. It was anticipated that the information would be used as the basis for ongoing discussion with communities to establish their ‘baseline’ against which developments might be measured annually. See Section 3.3.1 for discussion of the implementation of this element.
2.3.4 Local Implementation Plans
A key output of the NPA RSD was the completion of LIPs to guide government investment in the community (Paragraph 17(c)).
Each community was asked to form a Local Reference Group (LRG)[228] to assist in developing the LIP to ensure that planning, development, delivery and use of services reflect the needs, aspirations and requirements of communities. The LRGs worked together with the ROCs to develop the LIPs.
LIPs drew on information from the baseline mapping reports and community priorities and are unique to each community. The LIPs set out agreed priorities, actions, responsibilities and commitments for each community. They detail required services and how to best deliver or improve them. Government agencies have committed resources and timeframes to implement actions identified in the plans, with a particular focus on harnessing potential investment from other COAG NPAs.
All LIPs, once finalised, were signed off by the Australian Government, state/territory government and the community.[229] Most LIPs are published on the Department of Social Services website.[230]
Although not a specific requirement of the NPA RSD, reviews of LIPs have been undertaken progressively over the life of the NPA. The reviews required the existing LIP to be reviewed with the community and key priorities for the remainder of the NPA RSD to be assessed.
2.3.5 Other outputs
As well as the outputs discussed above, the establishment of the SGI, baseline mapping reports and LIPs, Paragraph 17 of the NPA RSD specified a number of other outputs required to achieve the objectives and outcomes of the NPA, including:
- An agreed bilateral plan completed for each jurisdiction that is party to the NPA (Paragraph 17(e)). Bilateral plans are described in more detail in the governance section (2.3.2)
- Reports, including annual reports to COAG, jurisdictional report cards, an annual evaluation process, and statements of expenditure in each location (Paragraph 17(f))
- Delivery of community leadership skills programmes (Paragraph 17(h))
- Identification of gaps in local infrastructure (Paragraph 17(i))
- Strengthening interpreting and translation services in response to local needs (Paragraph 17(j))
- The delivery of cultural competence measures for all government employees involved with identified communities (Paragraph 17(k))
- Changes to land tenure and administration to enable the development of commercial properties and service hubs (Paragraph 17(l)).
Progress on implementing the outputs is described in Chapter 3 (Section 3.3).
Progress on implementing two other outputs described in Paragraph 17 – improvements in the design and delivery of services consistent with the service delivery principles (Paragraph 17(d)) and the sharing of best practice (Paragraph 17(g)) are described in Chapters 4, 5 and 6.
2.4 Governance of the NPA RSD
A BOM in each jurisdiction coordinates the local implementation of the NPA RSD. The NPA RSD required each jurisdiction and the Australian Government to develop a bilateral plan to achieve the objectives of the NPA. Although not a specific requirement of the NPA RSD, between July 2009 and January 2014 a Coordinator General for Remote Indigenous Services monitored, assessed, reported and advised on the implementation of the NPA RSD.
2.4.1 Board of Management
Implementation of the NPA RSD is governed by a BOM in each RSD state and the NT. BOMs are also referred to as the State Management Committee in NSW, the APY Lands Joint Steering Committee in SA, and State Operations Committee in WA. The BOM membership comprises senior state/territory and Australian Government officials[231] who meet every two to three months to monitor progress and expedite urgent service delivery issues and support the work of the ROC. The BOMs are co-chaired by the FaHCSIA State Manager and a senior representative from an appropriate state/territory government agency.
2.4.2 Bilateral plans
Bilateral plans between each jurisdiction and the Australian Government were required as an output of the NPA RSD (paragraph 17e) to achieve its objectives. The bilateral plans were also a precursor to the development of the LIPs. They include milestones, performance benchmarks, indicators and timelines for achieving the performance benchmarks. Bilateral plans are the key planning tool used by the BOMs to enable a coordinated approach to identifying government priorities at both the intra and inter government levels.[232]
Information on the progress of the bilateral plans for each jurisdiction is provided in Section 3.3.1.
2.4.3 Coordinators General
Coordinator General for Remote Indigenous Services
Although not a specific requirement of the NPA RSD, a statutory office for the Coordinator General for Remote Indigenous Services (Coordinator General) was established under the Coordinator General for Remote Indigenous Services Act 2009 (the Act).
The Coordinator General commenced duties on 20 July 2009 after announcement of the appointment on 18 June 2009. The Coordinator General provided oversight of the implementation of the NPA RSD and monitored contributions to achieving the Closing the Gap targets in the priority locations.
The Act specifically required the Coordinator General to monitor, assess, advise, and drive:
- The development and delivery of services and facilities by governments, in each remote location specified by the Minister, to a standard broadly comparable with that in non-Indigenous communities of similar size, location and needs elsewhere in Australia, including through:
- improvements to the coordination of the development and delivery of such services and facilities
- reforms to the development and delivery of such services and facilities.
- Progress towards achieving the Closing the Gap targets in the specified locations.
The Act also required the Coordinator General to monitor the implementation of each Local Implementation Plan.
The Coordinator General formally reported[233] twice a year to the responsible Australian Government Minister.
The Coordinator General role was not evaluated as part of this report as the function is not included in the NPA RSD.
The role and function of the Coordinator General concluded on 31 January 2014.
State/Territory Coordinators General
Each of the RSD states and the NT has a Coordinator General nominated by the respective Indigenous Affairs Minister. The state or territory Coordinator General has a lead role in their jurisdiction’s BOM and the authority to work across agencies and resolve bureaucratic blockages in order to facilitate and drive implementation of the NPA RSD in their jurisdiction.
The Northern Territory Coordinator General (when extant) was the only other Coordinator General who had an independent role and a requirement to produce reports.[234] The Northern Territory Coordinator General’s responsibilities covered more communities than those under the RSD NPA. They also covered all 20 communities gazetted under the former NT ‘A Working Future’ policy. In late 2012 the Northern Territory Coordinator General role was transferred back to the NT Government line agency.
The other State Coordinators General were given the title as an addition to their existing roles as heads of the states’ departments of Indigenous Affairs or equivalents.
2.5 Funding of the NPA RSD and IRSD Special Account
This section provides a description of the budget arrangements of the NPA RSD over the five and a half years of the NPA RSD and a description of the Indigenous Remote Service Delivery (IRSD) Special Account which was established to support the NPA RSD.
2.5.1 NPA RSD funding
The NPA RSD is funded by the Australian Government ($187.7 million) and the participating states and the NT ($103.5 million) over five and a half financial years. FaHCSIA as the lead Australian Government agency received the full Australian Government contribution to fund the five key elements of the NPA RSD: baseline mapping, evidence base, monitoring and evaluation; governance; land tenure; cultural awareness training; and translation services (see Table 2.3). Most elements of the NPA RSD are jointly funded between the Commonwealth and the respective states/NT. Land tenure reform is considered the responsibility of the jurisdictions and therefore no Commonwealth funding was provided for this activity.
It should be noted that the amounts listed in the table are initial allocations as presented in the NPA RSD and are not actual expenditure. NPA RSD funding enables the implementation of a new remote service delivery model and is not the only source of funding directed to the RSD locations (as discussed in Section 2.6). See Section 3.6.1 for discussion on expenditure by the Australian Government.
Table 2.3 Funding responsibilities for the implementation of the NPA RSD
|
Element |
Australian Government |
State/territory government ($ million) |
Total budget ($ million) |
|---|---|---|---|
|
Baseline mapping, evidence base, monitoring and evaluation |
36.6 |
0 |
36.6 |
|
Governance |
128.1 |
73.7 |
201.8 |
|
Land tenure |
0 |
8.1 |
8.1 |
|
Cultural awareness training |
3.3 |
2.9 |
6.1 |
|
Translation services |
19.8 |
18.9 |
38.6 |
|
Total |
187.7 |
103.5 |
291.2 |
Note: The Australian Government total, state/territory government’s total, translation services and cultural awareness training total vary due to rounding.
Source: NPA RSD
2.5.2 IRSD Special Account
The IRSD Special Account was established with $46 million on 1 July 2010, to support the implementation of the NPA RSD. Although it is not directly linked to the NPA RSD, the IRSD Special Account provides a flexible funding pool to meet community priorities identified through local planning processes to:
- support high priority projects in remote Indigenous communities
- develop, promote, assist or improve the design, delivery and coordination of governance, community development, infrastructure and services in remote Indigenous communities
- address priorities identified within the LIPs, for which funding from other sources has not been available.
Further information on the IRSD Special Account is provided in Section 3.6.2 and Appendix K.
2.6 Relationship between RSD and related initiatives
In RSD locations there are other arrangements, agreements or plans aimed to address local Indigenous disadvantage. The RSD model was designed so that planning and integration of service delivery takes into account, links to, and where appropriate is the vehicle for, other place-based initiatives. These include RPAs between the Australian Government, jurisdictional governments and community bodies, NPAs between the Australian Government and the states/territory and other initiatives instigated by individual state/territory governments, or jointly with the Australian Government.
This section provides a brief description of the main initiatives at the national and jurisdictional level that complement the NPA RSD and need to be considered in the RSD evaluation. Additional description of initiatives at the state/territory level is provided in Appendix B.
2.6.1 National
Closing the Gap: National Partnership Agreements
As discussed in Section 2.2.2 the NPA RSD was developed within the context of the broader COAG reform commitment under the NIRA to work together with Indigenous Australians to Close the Gap in Indigenous disadvantage. To support the NIRA to achieve the Closing the Gap targets, COAG agreed to supplement mainstream NPAs with a number of Indigenous-specific NPAs. These include:
- National Partnership Agreement on Indigenous Early Childhood Development
- Closing the Gap in Indigenous Health Outcomes National Partnership
- National Partnership Agreement on Indigenous Economic Participation
- National Partnership Agreement on Remote Indigenous Housing
- Closing the Gap in the Northern Territory National Partnership Agreement (now National Partnership Agreement for Stronger Futures in the Northern Territory)
- National Partnership Agreement on Remote Service Delivery
- National Partnership Agreement on Remote Indigenous Public Internet Access
The major mainstream NPAs involved in delivering services in RSD priority locations include:
- National Partnership Agreement on Early Childhood Education
- Smarter Schools National Partnership Agreements
- National Partnership Agreement for Low Socio-Economic Status School Communities (Low SES NP)
- National Partnership Agreement for Literacy and Numeracy (LNNP)
- National Partnership Agreement on the Digital Education Revolution
- National Partnership Agreement on the Nation Building and Jobs Plan
Further information on which RSD locations benefited from these NPAs is provided in Chapter 3.5 and Appendix J.
2.6.2 Northern Territory
A number of initiatives unique to the NT were implemented prior to or during the course of the NPA RSD. The major initiatives that need to be considered in the RSD context include the NTER, the Closing the Gap in the Northern Territory NPA, the NPA on Stronger Futures in the Northern Territory, the Groote Eylandt and Bickerton Island RPA, and the former NT Government’s Working Future policy (which ceased in 2012).
In particular the Groote Eylandt and Bickerton Island RPA is strongly linked to the NPA RSD[235]. The RPA (stage 2) includes a specific schedule (schedule D) which states “The Parties have agreed that the RPA will have primacy as the vehicle for the implementation of the RSD in Angurugu and Umbakumba”.
More information on these initiatives is provided at Appendix B.
2.6.3 South Australia
Both SA RSD communities (Amata and Mimili) are located in the Anangu Pitjantjatjara Yankunytjatjara Lands (APY Lands). The APY Lands RPA came into effect on 7 August 2013 for a three year period. The APY Lands RPA will build on the NPA RSD, and provide the platform to transition the LIPs developed by Amata and Mimili communities and incorporate lessons learned. More information on the APY Lands RPA is provided at Appendix B.
2.6.4 Queensland
The Cape York Welfare Reform (CYWR), which is being trialled in four of the RSD locations - Aurukun, Hope Vale, Coen and Mossman Gorge, came into effect in each of the four communities prior to the NPA RSD in late 2007. The overall aim of the CYWR is to rebuild social norms, re‑establish Indigenous authority, increase engagement in the real economy, and move individuals and families from welfare housing to home ownership in the four participating communities. The CYWR was evaluated in 2012. More detail on the CYWR can be found at Appendix B.
2.6.5 New South Wales
Walgett and Wilcannia are both situated in the Murdi Paaki region of NSW. Murdi Paaki Regional Assembly (MPRA) is the peak representative body representing the interests of Aboriginal people in 16 communities across western NSW including Walgett and Wilcannia. A number of initiatives pre‑date the NPA RSD.
Walgett and Wilcannia are included in the Murdi Paaki Regional Partnership Agreement (MP RPA). MP RPA is an agreement between the MPRA, the Australian and NSW Governments. The MP RPA is the platform to address service coordination and delivery issues identified within the Murdi Paaki Region through engagement between Aboriginal communities and government agencies and aims to strengthen partnerships, governance, and leadership.
The MP RPA also includes mechanisms for the development of implementation plans to address community priorities and operationalise the MPRA Regional Strategic Plan.
More information on the MPRA and MP NPA is provided at Appendix B.
The NSW Aboriginal Affairs plan, Two Ways Together expired in 2012. The plan focused on improving the wellbeing of Aboriginal people in NSW and developing committed partnerships between Aboriginal people of NSW and NSW Government.
In April 2013 the NSW Government released its new Aboriginal Affairs plan, Opportunity, Choice, Healing, Responsibility, Empowerment (OCHRE) which includes reforms to support more Aboriginal students to stay at school and transition to work; build local decision-making skills in communities and; ensure government and community are more accountable for how money is spent.
OCHRE was developed in response to recommendations from the Ministerial Taskforce on Aboriginal Affairs and reports by the NSW Auditor General and the NSW Ombudsman into the previous Government’s Two Ways Together plan.
2.6.6 Western Australia
All four WA RSD locations are located in the Kimberley region. A number of Indigenous governance initiatives and partnership arrangements have facilitated community participation in the WA RSD locations. In the Fitzroy Valley, the Fitzroy Valley Futures Forum is an established governance framework and assisted in the identification of community priorities. The RPA on Indigenous Employment in the East Kimberley, the East Kimberley Petrol Sniffing Strategy and the Living Change Project are initiatives that have been implemented during the course of the NPA RSD in Halls Creek. On the Dampier Peninsula, a Tripartite Forum between the Australian Government, WA State Government and the Kimberley Land Council relating to the development of the Browse Basin Liquefied Natural Gas (LNG) proposal occurred concurrently to the establishment of the NPA RSD. This process contributed to discussions relating to economic opportunities for the Beagle Bay and Bardi Jawi RSD sites.
More information on the Fitzroy Valley Futures Forum, RPA on Indigenous employment in the East Kimberley and the Browse Basin Tripartite forum can be found at Appendix B.
2.7 Evaluation strategy
2.7.1 Logic frame
A high-level logic frame for the NPA RSD was developed in 2011.
The logic frame describes three broad sectors where the NPA RSD will make a difference - governments, service systems and communities. The actions and outputs leading to stated objectives and outcomes of the NPA RSD are depicted along a continuum ranging from early on in the NPA to near the end of the NPA.
Improved coordination and collaboration between governments, and engagement between governments and communities were expected to occur early on in the NPA RSD. Increases in the range, quality and use of service systems were expected to occur within two to three years, while increased social and economic participation and changes to personal responsibility and social norms at the community level were expected to occur within four to six years of the commencement of the NPA RSD.
This logic frame assisted in forming the key evaluation questions (see Section 2.7.4).
The high level logic frame can be found at Appendix C.
2.7.2 Reporting process
As part of the evaluation process a number of monitoring reporting processes were required under the NPA RSD. These included annual reports to COAG on the progress of NPA RSD implementation, and annual report cards produced by the jurisdictions including progress on performance indicators. Additionally, the Commonwealth Coordinator General for Remote Indigenous Services produced six monthly reports on progress of coordination, development and delivery of services and progress towards achieving the Closing the Gap targets in each priority community.
The specific reporting requirements as outlined in the NPA RSD including progress on implementation are provided in Section 3.3.2.
These reports assisted in informing this evaluation report.
2.7.3 Implementation Review
As part of the evaluation process an implementation review was conducted by FaHCSIA to assess and report on progress under the NPA RSD to the end of 2012, and to identify requirements for completion by June 2014. The review was publically released in 2013.[236]
The purpose of the review was also to:
- undertake a stocktake of the outputs and deliverables of the NPA RSD to the end of 2012
- ascertain what still needed to be done under the NPA RSD
- capture, to the extent possible, a sense of the contribution of the implementation of RSD at the community level
- identify any early lessons from implementation so far.
2.7.4 RSD 2013 evaluation
The RSD evaluation was conducted prior to the completion of the NPA RSD as required under Paragraph 41.
The evaluation covers the period from the commencement of the NPA RSD in January 2009 to June 2013, but more recent information is provided where available.
This section describes the goals of the evaluation, the key evaluation questions and the evaluation governance arrangements. A number of evaluation methods were employed to address the key evaluation questions, including a community research study (Chapter 4), targeted key stakeholder interviews (Chapter 5), an online survey of service providers (Chapter 6), and analysis of outcome data (Chapter 7). Brief descriptions of the methods used are presented in this section, with more detailed descriptions provided in the respective chapters.
Broad goals of the evaluation
Overall, the evaluation seeks to assess whether the delivery of and access to services, and community capacity to engage with governments has improved and whether or not the NPA RSD contributed to Closing the Gap objectives.
The broad goals of the evaluation are:
- to establish whether governments were effective in developing and delivering a coordinated and integrated suite of services and initiatives and in undertaking effective engagement with Indigenous communities
- to establish whether the capacity of Indigenous communities to engage with governments has been enhanced
- to assess if the place-based approach contributed to increasing social and economic participation and progress in achieving the Closing the Gap targets
- to inform future policy development and decision-making about where and how improvements could be made to achieve the objectives of the NPA RSD.
Key evaluation questions
Based on the broad goals of the evaluation, there are four key questions that guide the evaluation:
- Has access to and delivery of services improved?
- Has the capacity of communities and governments to engage with one another improved?
- Have there been changes in the RSD sites that contribute to the Closing the Gap objectives?
- What have we learned from the initiative that can inform remote service delivery, community capacity building, and place-based approaches?
Evaluation governance
An Evaluation Advisory Group (EAG) provided overall direction for the evaluation including the provision of quality assurance, advice and endorsements for the project planning, methodology, draft and final chapters.
The EAG comprised jurisdictional representatives from the Australian Government, state/territory governments, an Indigenous organisation nominated by one of the jurisdictions and the former Office of the Coordinator General for Remote Indigenous Services.
A pre-existing Inter-Departmental Committee (IDC) provided a conduit between participating Australian Government agencies. The IDC supported the coordination of evaluation activities through providing data for analysis, regular project updates and the provision of draft reports for comment. The IDC also advised on each stage of the evaluation.
The support and involvement of key stakeholders through the EAG and the IDC in the evaluation proved critical.
Methodology
The evaluation approach incorporated the use of several methods/components to inform the key evaluation questions including:
- Stakeholder mapping
- Review of literature
- Community research study
- Stakeholder interviews
- Online survey of service providers
- Outcomes data.
Ethics approval for the stakeholder interviews and service provider survey was granted by the FaHCSIA Human Research Ethics Committee in April 2013. Ethics approval for the community research study was granted by ethics boards in each jurisdiction (see Chapter 4 for details).
Each of the key methods used are outlined below.
Stakeholder mapping
Stakeholders were categorised for stakeholder interviews and the service provider survey. In order to capture stakeholders capable of informing the goals of the evaluation three key themes were identified based on the logic frame: coordination (e.g. BOMs, ROCs, GBMs, IEOs, and Coordinators General), engagement (e.g. Aboriginal representative bodies, Land councils, Aboriginal councils, local reference groups) and services systems (e.g. state/territory and Australian government, NGOs, local shires, local service providers).
Staff lists for each stakeholder group were compiled with assistance from members of the EAG and ROC staff.
Review of literature
A number of evaluation events related to remote service delivery recently preceded the evaluation. Hence a review of relevant international and Australian literature was conducted by FaHCSIA which assisted in:
- identifying areas for further investigation in the survey and stakeholder interviews to further focus the evaluation
- defining coordination, engagement and service delivery and identifying good practice
- interpreting and explaining the findings of the stakeholder interviews and the service provider survey.
Community Research Study
A community research study was conducted by consultants Colmar Brunton and Social Compass in a sample of RSD communities to obtain a ground-up perspective of perceived change in service delivery and engagement in the communities since the commencement of the NPA RSD.
The community research study aimed to:
- allow for individual assessment of current status and recent changes in a community
- aid our understanding of service delivery through systematic qualitative evaluation research
- provide a resource for each community involved that can be referenced for future community development and planning.
It used a participatory methodology which included local researchers in the design of both the quantitative questionnaire and qualitative component, as well as in data collection and interpretation and reporting results back to each community.
More detail on the methodology for the community safety study is included in Chapter 4.
Interviews with key stakeholders
Consultants, O’Brien Rich and Limerick and Associates were contracted to conduct stakeholder interviews.
Interviews were conducted with representatives from the SGI, the chairs of LRGs, key service providers and representatives from governments across the following sample of RSD locations: Walgett and Wilcannia, Fitzroy Valley and the Bardi Jawi communities, Mornington Island and Doomadgee, Amata and Mimili, three NT top end communities and one NT central desert community.
Stakeholder interviews were also conducted in Canberra, Darwin, Alice Springs, Mount Isa, Townsville, Brisbane, Broome, Adelaide, Broken Hill and Dubbo.
The stakeholder map and list of stakeholders guided the selection of stakeholders for interview.
The consultants worked with FaHCSIA’s Evidence and Evaluation Branch and the ROCs to coordinate access to communities.
Interviews focused on stakeholder perceptions of the RSD strategy, intended design, and implementation regarding the evaluation themes of engagement, coordination and service systems.
More detail on participants is under the research methodology section in Chapter 5.
Service provider online survey
An online survey of service providers in a range of remote communities was conducted by Dr Judy Putt. The aim of the survey was to investigate whether service providers across the remote communities considered service delivery, availability and integration had improved and to seek participants’ views on the barriers and facilitators to change.
To help inform the survey and to facilitate a good response rate, regional workshops were held with key service provider organisations in Broome, Dubbo and Mt Isa in March 2013 - as these regions were not included either in previous service provider surveys undertaken for the NTER evaluation in 2011, or in the Cape York Welfare Reform communities in 2012.
The survey was conducted in all RSD locations (excluding the Cape York Welfare Reform communities).[237] A comparative sample of service providers was surveyed in eight non-RSD locations based on the size, location and population mix of the communities. Cross-sectorial purposeful sampling was incorporated in this approach to ensure there was adequate representation of sectors and locations.
The survey complements the interviews with key stakeholders by seeking the views of service providers who work in the communities, either as resident or visiting providers on the impact of the NPA RSD at the community level.
More information on the sampling frame and demographics of participants is provided in Chapter 6.
Outcomes data
Analysis of outcomes was conducted by a number of specialists and compiled in Chapter 7 by the Evidence and Evaluation Branch. The chapter examines trends in outcomes for the RSD communities for six of the seven COAG building blocks.[238] Governance and leadership is not covered as there are no relevant quantitative outcome indicators. The chapter generally reports data for the Closing the Gap targets, grouped under the six building blocks.
More information on the outcome indicators is provided in Chapter 7. This covers the limitations which affect both the data and the assessment of change, particularly the attribution of impact to the NPA RSD given the range of factors likely to influence outcomes.
3 Progress in implementing the NPA RSD
Compiled by Evidence and Evaluation Branch
3.1 Chapter outline
This chapter was compiled from information provided by programme areas and Regional Operations Centres (ROCs), to describe the progress of implementing the National Partnership Agreement on Remote Service Delivery (NPA RSD). The chapter starts with progress of the 12 outputs specified in the NPA followed by a summary of the key achievements in each jurisdiction since the commencement of the NPA RSD. The next section provides a summary of the progress in investments or services by other NPAs in the RSD locations. The chapter concludes with a summary of government expenditure, including from the Indigenous Remote Service Delivery (IRSD) Special Account.
3.2 Introduction
Although the NPA RSD officially commenced on 27 January 2009 with the signing of the Agreement[239], the priority locations were not announced until 21 April 2009.[240] Australian Government funding was provided to the former Department of Families, Housing, Community Services and Indigenous Affairs (FaHCSIA) on 1 July 2009 after it was appropriated as part of the 2009-10 Budget, and progress on the delivery of some of the key elements of the NPA RSD commenced after 1 July 2009. The NPA RSD will expire on 30 June 2014.
The broad objective of the NPA RSD, together with other relevant Council of Australian Governments (COAG) agreements, is to improve access, range and coordination of services; and to improve the level of governance and economic and social participation in Indigenous communities.[241] The intended outcome of these objectives is to contribute to increased services and infrastructure that are comparable with non-Indigenous communities of similar size, location and need. Further, the NPA RSD aims to increase community capacity to facilitate better cooperation between governments and community organisations in the provision of these services (see Paragraph 16 of the NPA RSD for specific outcomes).
Paragraph 17 of the NPA RSD states the objectives and outcomes will be achieved by 12 outputs listed below:
(a) new fully functional integrated service planning and delivery methodology and single government interface (SGI);
(b) the completion of detailed baseline mapping of social and economic indicators, government investments, services and service gaps in each location;
(c) detailed Local Implementation Plans (LIPs) developed and completed with state and Northern Territory governments and stakeholders in identified locations;
(d) improvements in the design and delivery of services consistent with the Service Delivery Principles at Schedule C;
(e) an agreed Bilateral Plan completed for each jurisdiction that is party to the Agreement;
(f) reports as outlined in the Reporting section of this document, Paragraphs 25-30;
(g) the sharing of best practice;
(h) the delivery of community leadership skills programmes;
(i) the identification of gaps in priority local infrastructure;
(j) strengthened interpreting and translation services in response to local needs;
(k) the delivery of cultural competence measures for all government employees involved with identified communities; and
(l) changes to land tenure and administration to enable the development of commercial properties and service hubs.
Some of these outputs identified in Paragraph 17 such as baseline mapping reports, LIPs, reporting, community leadership skills programmes, and interpreting services are further described in other paragraphs. Where appropriate the supporting paragraphs have been identified.
Below is a description of the progress in implementing each of the 12 outputs. Further information on the progress of some of these outputs is presented in the following chapters.
3.3 Outputs to date
Implementation of some of the 12 outputs was required early in the NPA RSD. These initial outputs included the establishment of the SGI, bilateral plans, building the evidence base, and LIPs (Section 3.3.1). Some activities will progressively deliver outputs over the life of the NPA including: reporting, community leadership skills programmes, identification of gaps in local infrastructure, interpreting services, cultural competence measures and land tenure. While progress on these is described, their final achievements cannot be assessed until the end of the NPA RSD. Section 3.3.2 describes progress to date on these. The remaining two outputs, ‘improvements in the design and delivery of services consistent with the service delivery principles’ and ‘the sharing of best practice’, require qualitative data collection in addition to monitoring information, to examine how well they were achieved. These findings are presented in Chapters 4, 5 and 6 of this report.
A description of the progress on implementation of the initial outputs and the on-going outputs is described below.
3.3.1 Initial outputs
Single Government Interface (Paragraph 17(a))
As described in Section 2.3.3 the SGI consists of ROCs, Boards of Management (BOM), Government Business Managers (GBMs) and Indigenous Engagement Officers (IEOs).
One of the first steps in the implementation of the SGI in each jurisdiction was the establishment of a Remote Operations Implementation Team (ROIT) in July 2009. The ROIT was a temporary working group consisting of FaHCSIA staff from national and state/territory offices. The function of the ROIT was to assist in the establishment of ROCs, employ GBMs and IEOs and provide them with accommodation in the communities, coordinate IT equipment, and to provide governance and communication materials.[242] The ROIT disbanded in early 2010 following the completion of the SGI project.
Apart from Qld, each jurisdiction is serviced by one ROC; Qld is serviced by two ROCs, one in Cairns and another in Mount Isa. The first ROC established was Broome (WA) in June 2009, followed by Adelaide (SA) in July 2009, Darwin (NT) in August 2009, Cairns and Mount Isa (Qld) and Dubbo (NSW) in September 2009.
ROCs report to a BOM[243] in each jurisdiction. The first BOM established was in the NT in August 2009. The BOMs in the other jurisdictions were established in November 2009.
The critical components of the SGI at the local level consist of the GBM or equivalent, and the IEOs or equivalent in each community. GBMs were already established in all NT RSD locations and IEOs were established in eight of the communities as part of the Northern Territory Emergency Response (NTER). By the end of 2009, all other RSD locations had a GBM on an interim or permanent basis. IEOs were recruited after the GBMs had commenced. Most IEO positions were filled in late 2009 or early 2010, with Walgett and Wilcannia (NSW) the last communities to have IEOs in place.
Specific dates for the establishment of ROCs and BOMs in each jurisdiction and the commencement dates of GBMs and IEOs in each community are under Appendix D.
Bilateral Plans (Paragraph 17(e))
As explained in Section 2.4.2, Bilateral Plans were agreed between the Australian, state and territory governments by September 2009.
The plans were to be reviewed annually, as required under Paragraph 24 of the NPA RSD. The BOMs manage these review processes. All Bilateral Plans have been reviewed at least once, but not all plans have been reviewed annually (Table 3.1). Review processes have recognised the evolution of the NPA RSD from implementation and the changes made to Bilateral Plans reflect this. For example, the NT Bilateral Plan, following its second review, focuses on service delivery standards and the development and maintenance of infrastructure plans.
Table 3.1 Dates Bilateral Plans were agreed and review dates by jurisdiction
|
State/Territory |
Date first Bilateral Plans agreed |
Subsequent reviews |
|---|---|---|
|
New South Wales |
September 2009 |
1. October 2010 2. The planned 2013-14 review is to be replaced by a Transitional Plan to support communities post June 2014 |
|
Queensland |
August 2009 |
1. August 2010 |
|
Western Australia |
August 2009 |
1. April 2011 2. July 2013 |
|
South Australia |
September 2009 |
1. October 2010 2. Underway at 30 June 2013 |
|
Northern Territory |
August 2009 |
1. July 2010 2. March 2012 3. Underway at 30 June 2013. |
Building the evidence base
As per Section 2.3.3 there are three main components to building the evidence base - baseline mapping reports, local research and planning projects, and identification of community networks. The implementation of these components is discussed below.
Baseline mapping reports (Paragraph 17(b) and 19(e))
Draft baseline mapping reports for all communities were available in early March 2010 (Table 3.2). ROCs had access to draft reports in early 2010 to help inform their LIP and to verify the factual accuracy of the reports with their communities. Most Local Reference Groups (LRGs), with the exception of the Cape York communities,[244] were formally presented with their final community baseline mapping reports by their respective ROCs in mid to late 2010 (Table 3.3).
The difference in timing was due to the reports requiring data clearance from the appropriate agencies before they could officially be called final. Final clearance involved a number of processes including receiving and addressing comments, and jurisdiction sign-off for most of the data presented in the reports. In addition, the Municipal and Essential Services (MES) audit was initially a separate project to the baseline mapping reports, with a different objective and operating to a different schedule. FaHCSIA worked closely with the MES audit team to incorporate the additional 26 communities not initially covered by the MES audit, and to document many extra items not originally part of the audit but required for the baseline mapping reports.
Table 3.2 Key dates in finalising the baseline mapping reports by jurisdiction
|
State/Territory |
First draft |
Second draft |
MES audit sign off |
Final reports to ROCs# |
|---|---|---|---|---|
|
New South Wales |
1 March 2010 |
7 May 2010 |
8 June 2010 |
15 June 2010 |
|
Queensland |
1 March 2010 |
7 May 2010 |
4 May 2010 |
7 October 2010 |
|
South Australia |
1 March 2010 |
7 May 2010 |
10 May 2010 |
12 July 2010 |
|
Western Australia |
1 March 2010 |
7 May 2010 |
21 June 2010 |
11 October 2010 |
|
Northern Territory |
3 March 2010 |
7 July 2010 |
1 October 2010 |
18 October 2010 |
# Date electronic copy sent to ROCs
Table 3.3 Dates baseline mapping reports provided to communities by jurisdiction
|
State/Territory |
Date |
|---|---|
|
New South Wales |
June 2010 |
|
Queensland – Mornington Island and Doomadgee Cape York Communities |
December 2010 June 2011 |
|
South Australia |
August 2010 |
|
Western Australia |
November 2010 |
|
Northern Territory |
December 2010 |
Local research and planning projects (Paragraph 19(f))
Australian Government funding for the NPA RSD supported communities to undertake local level research and activities aimed at informing the development of LIPs. Communities took ownership of the LIPs by identifying priorities that could be community driven. Local people were trained to undertake the community driven research and activities based upon the LIP priorities.
There were 21 projects completed as part of the local research and planning project. The projects are:
- Detailed population survey of Indigenous residents of Groote Eylandt and Bickerton Island
- NPA RSD visioning workshops in 13 RSD locations in the NT[245]
- Three projects on ‘strengthening community research on remote service delivery in community’ in Lajamanu, Ntaria (Hermannsburg) and Yuendumu
- Healthy Tiwi Country, Healthy Tiwi People
- Evaluation of the AFL Remote Regional Development Program in Wadeye
- Strengthening community research on RSD: Change factors and priorities for community development of LIPs at Amata and Mimili
- Attitudinal Community Survey - carried out by NPY Women’s Council.
Three additional projects that fell under the scope of local research and planning projects but were funded by other sources included:
- Provision of Community Planning Services in Mornington Island and Doomadgee
- Community Safety Action Plan in Mornington Island and Doomadgee
- A Services Research Project to create an inventory of all services to Bardi Jawi communities, Beagle Bay, Fitzroy Valley and Halls Creek and which undertook a small sampling of local participation in those services.
More information on these projects is presented at Appendix F.
Identification of community networks (Paragraph 19(e)(ii))
A requirement of the NPA RSD (Paragraph 19 (e) (ii)), is the identification of ‘existing community networks and decision-making processes as the basis for establishing legitimate Indigenous community governance structures and decision-making processes’ (see Section 2.3.3 for more information).
In response FaHCSIA collated information about community organisations from existing databases for each RSD location and distributed this to the ROCs on 7 December 2009 together with a fact sheet for the community explaining why this was done. Some ROCs mapped the existing community networks in their respective communities.
Local Implementation Plans (Paragraph 12(d), 17(c), 21(d))
A major output of the NPA RSD was the development of LIPs. In each community ROC staff and LRGs worked to develop LIPs to guide future investment in the community. The plans set out agreed priorities, actions, responsibilities and commitments.
The process involved in forming the LRG differed from community to community. In some communities LRGs were formed specifically for the NPA RSD, while other communities drew on existing local governance structures to form the LRG. The community consultation process to develop LIPs also differed from community to community. Descriptions of the LRG and the community consultation process adopted by each community to develop the LIP are presented in Appendix G.
As at June 2013 all LIPs had been agreed. Fourteen LIPs were agreed in the latter half of 2010. The SA communities of Amata and Mimili were the first to agree to their LIPs on 30 June 2010 and 1 July 2010 respectively, followed by Doomadgee and Mornington Island in July 2010 and Walgett and Wilcannia in August 2010. The WA communities all agreed to their LIPs by November 2010. The NT communities of Angurugu, Gunbalanya, Umbakumba and Yirrkala all agreed to their LIPs by December 2010. Nine NT communities agreed to their LIPs in the first half of 2011. Aurukun and Hope Vale in Qld did so in November 2011 and in December 2012, respectively. The remaining four communities, Wurrumiyanga, Mossman Gorge, Coen and Maningrida agreed to their LIPs in 2013.
Exact dates of agreement by community can be found in Appendix H.
In 2011 reviews of LIPs commenced, with communities assessing what had been achieved to date and reassessing key priorities for the remainder of the NPA RSD.
Formal review of LIPs was a priority activity for BOMs and ROCs in all jurisdictions during 2012–13. As at 1 November 2013, 21 LIPs had been updated to reflect current community and government priorities. The LIP review is progressing well in three of the Qld Cape Communities of Hope Vale, Mossman Gorge, and Aurukun and was expected to be completed by end of February 2014. The Coen LIP is unlikely to be refreshed as it was only formally agreed in June 2013.
The LIP review process was not undertaken in four NT communities (Maningrida, Yuendumu, Angurugu and Umbakumba) for a variety of reasons including delayed initial LIP signing and review of the Groote Eylandt and Bickerton Island Regional Partnership Agreement affecting the LIP review process in Angurugu and Umbakumba.
3.3.2 On-going outputs
Reporting (Paragraph 17(f), 21(a), 25-30)
Below is a description of the progress on each of the reporting requirements as specified in the NPA RSD.
Annual reports
The Australian Government is required to report annually to the Council of Australian Governments (COAG) on the implementation of the NPA RSD. FaHCSIA coordinated the preparation of the reports.
To date two annual reports have been provided to COAG. The first report covering the period from August 2009 to September 2010 was considered by COAG in February 2011.[246] A second annual report, for the period 1 July 2010 to 30 June 2011 was considered by COAG in April 2012.[247]
Reports for 2011-12 and 2012-13 are being finalised.
Jurisdictional report cards
Jurisdictions are required to provide the Australian Government with an annual report card.
Report cards from each jurisdiction were provided to the Australian Government in 2011 and 2012 and at the time of writing most 2013 report cards had been submitted. The 2011 report cards accompanied the Australian Government report to COAG. In addition to commentary about events and general progress in communities, the first report cards provided information on progress with developing performance indicators for each jurisdiction.
Separate jurisdictional report cards were not provided in 2010 because most LIPs had not been finalised during the reporting period however jurisdictional progress was included in the Australian Government’s 2010 Report to COAG.
Annual Evaluation Process
Paragraph 28 of the NPA RSD commits jurisdictions to an annual evaluation process shared across all jurisdictions.
The NPA RSD does not provide further detail on this requirement. The Implementation Review[248] of the NPA RSD undertaken in 2012 found a wide range of evaluative activities had taken place each year since 2009 and considered these to have effectively met this requirement.
This existing suite of activities has been used to inform the 2013 RSD evaluation.
Statements of expenditure in each location
Paragraph 29 of the NPA RSD required the Australian Government and the relevant states/territory to provide clear statements of expenditure in each RSD community 12 months after implementation. More information on Australian Government expenditure is provided in Section 3.6.1.
Community leadership skills programmes (Paragraph 17(h), 21(e))
There has been a concerted effort by Australian, state and territory governments to enhance community leadership skills in RSD locations. Various leadership workshops and support for other leadership activities have been delivered.
For example, in 2010-11, 18 workshops were held, including in 10 RSD communities in the NT and one RSD community in SA, with a total of 312 participants. These three day workshops were led by experienced facilitators and included some modules from the National Indigenous Leadership Program, presentations on the Australian Government’s Indigenous reform agenda and other leadership and governance issues as outlined in the individual LIPs.[249]
IEOs participated in a development workshop in Canberra in December 2010 and attended a national annual recall session that provided support and capability development opportunities.
In addition, the capacity of local communities to effectively engage with governments has been enhanced through the establishment of LRGs where they did not previously exist and through LRG members working with ROCs, GBMs and IEOs in planning services.
More detail about key leadership and governance activities in each community is in Appendix I.
The second report produced by the Coordinator General for Remote Indigenous Services, recommended a specific governance, leadership and related capacity building framework be developed. The Australian Government has indicated that it is committed to establishing a new relationship with Aboriginal and Torres Strait Islander peoples, empowering communities and building the capacity of service providers. Consultation was undertaken under the previous Government on a COAG National Indigenous Governance and Leadership Framework. The review of Indigenous programmes, due to be completed in March 2014, will inform the direction for this framework.
Identification of gaps in local infrastructure (Paragraph 17(i))
The baseline mapping reports outlined the range of services and infrastructure gaps in each of the RSD locations and this information was available to inform the development of the LIPs. These covered a range of municipal and social services, such as early childhood, schooling, health, housing, justice and safety.
Key achievements, including improvements in infrastructure by jurisdiction, are presented in Section 3.4, and Appendix I provides more information by community.
Interpreting services (Paragraph 17(j), 19(g), 21(e))
The NPA RSD identifies the funding allocation between the Australian, state and territory governments for interpreting and translation services. A total of $38.7 million was identified across the duration of the NPA RSD, comprising of $19.8 million from the Australian Government and $18.9 million from the states and NT.
The NPA RSD has developed the interpreting sector by improving the training of interpreters and the accessibility of services, and paid for the use of interpreters in engagement and service delivery. Over the course of the NPA RSD the interpreting sector has developed in the NT, Kimberley and APY Lands. The Australian and NT Governments have also improved the interpreting sector by implementing Stronger Futures in the Northern Territory and previous NPAs. Interpreting is a source of employment for Indigenous people. The training required to be an interpreter develops sophisticated skills that are pathways to a wide range of employment opportunities.
Investments have been made to improve the capacity of the national system used to credential interpreters run by the National Accreditation Authority for Translators and Interpreters (NAATI). NAATI credentials provide assurances of quality to users of interpreters. Before the NPA RSD it had been very difficult for Indigenous interpreters to access NAATI accreditation. NAATI language tests did not exist in most Indigenous languages, examiners had not been trained to mark the tests and Indigenous interpreters didn’t have any opportunities to study for the tests. Since mid-2012, NAATI has been implementing projects funded by the Australian and NT Governments to remove these barriers. The funding has been used to prepare tests and train examiners to assess credentials in key Indigenous languages spoken in the NT, SA, WA and Qld. This is leading to significant increases in the number of credentialed Indigenous interpreters, so the sector is coming closer to the quality standards expected of multicultural and deaf interpreters.
Between 2008 and 2013 there has been a significant increase in demand for Indigenous interpreting in the NT and a significant improvement in the quality of interpreting. In 2007–08, the NT Aboriginal Interpreter Service undertook 19,437 hours of interpreting, 17 per cent of which was provided by interpreters with formal credentials in interpreting. In 2012–13, the service undertook 26,388 hours of interpreting, of which 39 per cent was provided by credentialed interpreters. At 30 June 2013, the service can provide interpreting in at least 93 Aboriginal languages. The service received requests for interpreting in 36 different languages during the last six months. 94 per cent of all hours of interpreting was in 15 languages: Djambarrpuyngu, Pitjantjatjara, Kriol, Warlpiri, Modern Tiwi, Western Arrernte, Eastern Arrernte, Luritja, Murrinh-Patha, Anindilyakwa, Anmatyerr, Burarra, Kunwinjku, Warumungu and Gumatj. The Aboriginal Interpreter Service is one of the largest employers of Aboriginal people in the NT. It employs more than 370 on-call, casually-employed interpreters and also employs a number of interpreters on a part-time or full-time basis.
In 2013, with support from the Australian and SA Governments, the NT Aboriginal Interpreter Service extended their service offer over the SA border to meet the interpreting needs of Anangu people in the APY Lands. The interpreting services are being offered on a pilot basis. In 2013, in the initial year of operation of the pilot, the service undertook 745 hours of interpreting and has trained more than 20 interpreters. The service advises that they have commitments from SA and Australian Government agencies and third party providers to increase the use of interpreters over 2014 now that the service has laid the ground work to ensure a supply of capable interpreters are available to meet future demand. This should create local employment opportunities for Anangu in 2014.
Between 2008 and 2013 there has been a modest increase in demand for Indigenous interpreting in the Kimberley. For example, in 2007–08 the Kimberley Interpreting Service completed 136 interpreting assignments, while in 2012–13 it completed 167 interpreting assignments comprising 895 hours of interpreting. During the second half of 2013, the service reported a 50 per cent increase in demand. While Walmajarri, Kukatja and Kimberley Kriol comprise the majority of the assignments, the service provides interpreting in over 20 Indigenous languages, many extremely rare. The service supports interpreting in completely different languages to those spoken in the NT and others throughout the remainder of WA. In the past 12 months, over 20 Kimberley interpreters have participated in the Diploma of Interpreting. A large group of Kimberley interpreters also received NAATI para-professional accreditation. As a result, the majority of interpreting in the Kimberley is undertaken by Aboriginal interpreters who meet nationally accepted quality standards. The Kimberley Interpreting Service receives support from the Australian and WA Governments.
In the implementation of the NPA RSD, each jurisdiction is taking steps to ensure that community members have a sound understanding of the processes with the intention of enabling effective local participation in developing LIPs. This has included the use of interpreters in community meetings and formal community reference groups where appropriate, as well as using translators and interpreters in the production of a range of culturally appropriate media products such as local radio broadcasts, banners, posters and fact sheets.
Specific examples of governments working with Indigenous interpreters include:
- All Australian Government NT State Office (NTSO) and Regions Branch staff received introductory training from the NT Aboriginal interpreter Service on effectively working with Indigenous language interpreters.
- In 2013, the Australian Government established a whole-of-government panel for registered training organisations to provide accredited training on ‘Working with Indigenous Interpreters’. Over 40 Australian Government staff had received credentials after completing the three day course.
- Protocols on the use of Indigenous interpreters have been developed by the Australian, SA and NT Governments.
- TAFE South Australia and the Batchelor Institute of Indigenous Tertiary Education run the Diploma of Interpreting in ways that are culturally appropriate for Indigenous interpreters. TAFE South Australia has also taught Diploma units in the Kimberley and successfully introduced sophisticated remote teaching tools that have enabled Anangu to undertake diploma studies while living on country.
- Interpreters assist with communication in all aspects of engagement, including through interpreting at meetings, radio, talking posters and key point community presentations in plain English with voice over and voice services for DVDs and audio-visual communication.
Since 2012, the Australian, state and territory governments have been developing the National Framework for Indigenous Interpreters for the effective supply and use of Indigenous interpreting and translation services, including by consulting with an industry reference group.
Cultural competence measures (Paragraph 17(k))
FaHCSIA released an APS-wide Engagement Framework in May 2011 to guide the way Australian Government agencies engage with Aboriginal and Torres Strait Islander Australians.
Other activities undertaken across government include engagement workshops to enhance engagement skills of all ROC staff, workshops tailored to local circumstances and an RSD Engagement Strategy to help ROCs to develop engagement plans.
In addition, during 2010–11, FaHCSIA developed the Local Community Awareness Program (LCAP) to assist ROC staff to improve their cultural competence in order to engage more effectively with local communities. The programme, produced in a ‘toolkit’ format, provides a framework for facilitated discussions between government staff and community members. It focuses on four key themes - the Past; Who We Are; Culture and Identity; and Working with Government; to explore the broad physical, historical and cultural factors that government staff and service providers, need to take into account when engaging with the community.[250] The roll out of the LCAP began in November 2011. In some communities, local residents or organisations have developed a commercial approach to delivering local cultural awareness training to government employees as well as other community visitors.
At the end of June 2013, a total of 212 government employees and service providers had completed the programme.
Land tenure (Paragraph 17(I))
Under the NPA RSD, state and territory governments agreed to, and are responsible for ‘changes to land tenure and administration to enable the development of commercial properties and service hubs’.
In Australia, Indigenous land rights legislation exists in most states and territories and provides for Indigenous ownership of land through various forms of tenure. These forms of tenure include freehold, leasehold and lands held in trust, and are provided for under a range of legislative arrangements.
In the NT, the Australian Government retains a special interest for land tenure issues as a result of its responsibilities under the Aboriginal Land Rights (Northern Territory) Act 1976 (Cth) and the Stronger Futures in the Northern Territory Act 2012 (Cth). Nationally, rights and interests in land that have been recognised under the framework of the Native Title Act 1993 (Cth) must also be considered.
Securing land tenure arrangements on Indigenous land through leases or other agreements before government makes substantial investment in fixed assets like housing or other buildings or infrastructure is seen as a necessary requirement. It is therefore vital that tenure systems provide the security and certainty necessary for tradeable long-term dealings in land.
Further, land tenure reform is intended to address land administration and planning barriers as the majority of priority RSD locations have not been subject to mainstream land use planning regimes or other investment safeguards including building codes and consumer warranty protections.
The need for reformed land tenure arrangements was acknowledged by the state and NT governments when they joined the Australian Government in signing the National Partnership Agreements on Remote Indigenous Housing (NPARIH) and Remote Service Delivery.
Land tenure reform enables improvements in:
- the delivery of public housing
- maintenance of public housing and infrastructure
- economic development
- private business investment
- home ownership.
Governments across Australia have progressed land tenure reforms to secure tenure to support the delivery of investment under NPARIH which aims to reduce overcrowding for Indigenous people and improve the quality of housing stock, particularly in RSD locations. Appendix E[251] outlines the progress made by the Australian, state and territory governments to reform land tenure in the RSD locations.
3.4 Key achievements in RSD locations
3.4.1 Overview of the Local Implementation Plans
This section contains a general overview of the actions in the LIPs for each building block followed by high level summaries of the achievements for each jurisdiction to June 2013. Key achievements by building block for each community to June 2013 are at Appendix I.
Some achievements were specifically identified as actions in LIPs; others resulted from the prioritisation of RSD locations in the implementation of other NPAs or in the delivery of other government programmes. Many achievements address community issues across multiple building blocks.
Early Childhood
The LIPs contained actions to drive improvement in early childhood health, education and parenting. These included new or upgraded infrastructure, new strategies, programmes and services and better coordination and integration of existing services.
Initiatives, tailored to the needs of each community, to be delivered included:
- new Children and Family Centres, early childhood and childcare centres and crèches
- upgrades to existing childcare facilities
- programmes for parents and children, such as playgroups, parenting education classes, mentoring and family support and early learning programmes
- training for more Indigenous childcare workers
- additional staffing to improve coordination and integration of early childhood and family support services
- antenatal programmes.
Schooling
The LIPs contained actions, tailored to the needs of each community, to drive improvement in educational outcomes. These included strategies to improve literacy and numeracy achievement, school attendance, reengage those disengaged from learning and increase parental involvement in their children’s education. These strategies were complemented by new or upgraded school infrastructure and training facilities.
Other initiatives to be delivered included:
- training for more Indigenous teachers and teacher aides
- new learning programmes including language, literacy and numeracy programmes
- new staff housing
- new sport, recreation and after school programmes
- new anti-bullying programmes
- new school nutrition programmes
- adult education.
Health
The LIPs contained community and/or jurisdiction specific actions to drive improvements in health. These included improved health, aged and disability care planning; new or upgraded health facilities and support services; better coordination of existing services; and the introduction of new strategies, staffing, programmes and services. Place specific improvements to be delivered included:
- new or upgraded primary health care clinics
- new or upgraded aged care facilities
- new or upgraded staff housing
- wellbeing centres
- expanded renal infrastructure, dialysis and support services
- new vehicles and equipment and upgraded ambulance services
- new mental health programmes
- new health initiatives, e.g. to reduce smoking and to improve oral health
- new youth sport programmes
- new water supply and fluoridation facilities
- more health checks
- new or upgraded sporting facilities such as swimming pools.
Healthy Homes
The LIPs contained specific actions, tailored to the community, to improve living conditions, focusing on reducing overcrowding and homelessness. Actions delivered have included construction of new homes or refurbishment of existing homes, accompanied by improved property and tenancy management arrangements.
Land tenure reform, land use planning and upgrades to municipal and essential services, including the power, water and sewerage services necessary for future growth, underpin improvements in this area. In addition, animal management programmes have been introduced in some locations.
Economic Participation
The LIPs contained a diverse range of community and/or jurisdiction specific actions to support strategies designed, over time, to increase workforce participation. These reflected the particular circumstances in each location and ranged from actions to address the fundamental improvements to urban planning and infrastructure necessary for delivery of new services and local business development, to other initiatives such as:
- construction of new training facilities
- increased participation in vocational training programmes
- collection of data to support workforce planning
- promotion of existing economic and employment opportunities
- support for the creation of new local businesses, particularly Indigenous owned businesses.
Safe Communities
The LIPs contained community specific actions to drive improvement in the safety and liveability of communities. These included new or upgraded infrastructure; such as cyclone shelters, safe houses, women’s shelters and men’s places, the introduction of new plans, strategies, programmes and services; and better coordination and integration of existing services. Other measures included:
- development of community safety and disaster management plans
- traffic safety and street lighting improvements
- new police complexes and additional policing
- introduction of night patrols
- alcohol, drugs and petrol sniffing reduction programmes
- better child protection programmes, including more Remote Aboriginal Family and Child Care workers in communities and funding for mobile child protection teams
- support for establishment of volunteer emergency units and provision of training and facilities.
Governance and Leadership
The LIPs contained tailored support for leadership and governance activities to enhance and improve local planning and decision-making capabilities and practices. These included actions to strengthen community governance structures and capacity and leadership development activities, with a particular focus in some communities on future leaders.
Below is a summary of specific key achievements for each jurisdiction.
3.4.2 New South Wales
A summary of achievements in the NSW RSD communities of Walgett and Wilcannia under each building block is presented below.
Healthy homes
- Both communities received a combined total of 34 new homes and 146 refurbishments under NPARIH to 30 June 2013. In Wilcannia 77 Indigenous homes also received air-cooling units, which was highlighted in the LIP as a priority for the community. In the Walgett LIP the community raised concerns about tenants not having necessary skills around money management and maintenance work. A number of actions were therefore undertaken to assist social housing tenants to improve money management skills and capability, such as running a ‘Manage your Income’ workshop and piloting a tenant support programme.
Schooling
- There has been a concerted effort to increase school attendance at the Wilcannia Central School by introducing a tutorial programme to re-engage children who have not been attending school. In Walgett a Memorandum of Understanding (MOU) was developed in consultation with Walgett Aboriginal Medical Service (WAMs) to deliver health services in the school. Health checks are now provided for primary school students in Walgett.
Early Childhood
- Early childhood reference groups have been established in both communities. Both groups meet regularly to make decisions and put strategies in place for early childhood issues in their communities. Upgrades to playgroup infrastructure were completed in both communities. Programmes were introduced to target families not previously accessing health and immunisation services, such as health check days for children from birth to three years in Walgett.
Health
- The Walgett hospital renal unit was established in February 2011 and enhanced drug and alcohol services are now established in both Walgett and Wilcannia.
Safe communities
- A number of projects were funded under the IRSD Special Account in Walgett to progress LIP actions under the safe communities building block. For example, sporting activities and equipment were funded to promote participation in sport, and funding was provided for the Walgett Mobile Youth Police Van. There was a strong focus in the Wilcannia LIP on tackling alcohol and a number of actions to progress this were achieved, such as the establishment of the Tackling Violence Program.
- The Wilcannia Community Safety Plan and the Walgett Family Violence Prevention Program were finalised.
Economic participation
- Both communities have completed feasibility studies into economic development opportunities. A laundromat is operational in Walgett and has secured supply contracts with local motels. A community garden has also been established in Walgett. In Wilcannia, a number of local people are undertaking qualifications, particularly in the area of building and construction.
Governance and Leadership
- Both NSW RSD communities achieved many LIP actions under the governance and leadership building block. In Walgett, workshops were held for the LCAP, which aims to improve cultural awareness amongst government workers and service providers to strengthen effective engagement and improve the delivery of government programmes and services.
More information on key achievements for each RSD community in NSW is provided in Appendix I.
3.4.3 Queensland
A summary of achievements in the four Cape York and two Gulf communities under each building block is presented below.
Cape York Communities
The four Cape York RSD communities are also part of the Cape York Welfare Reforms (CYWR). Many of the key achievements in these communities were guided by the initiatives under the CYWR.
Healthy homes
- Three Cape York communities - Aurukun, Hope Vale and Coen - received a combined total of 50 new houses and Aurukun received 65 refurbishments and Hope Vale 114 refurbishments through NPARIH to 30 June 2013.
Schooling
- School attendance either improved or was maintained to high standards in the four communities.
Early Childhood
- Parenting support programmes are operating in all communities.
Health
- Wellbeing Centres have been established to deliver integrated, community based and culturally appropriate social services addressing drug, alcohol, domestic violence, gambling and social/economic wellbeing issues.
Safe communities
- Community safety plans have been or are being developed.
Economic participation
- A number of business or training opportunities have occurred to improve economic development in the Cape York communities.
Governance and Leadership
- Business plans and youth engagement strategies have been developed.
Gulf communities
Healthy homes
- Both Mornington Island and Doomadgee received a combined total of 58 new houses and 182 refurbishments through NPARIH to 30 June 2013. Both communities received funding under NPARIH for the development of sub-divisions to support future housing construction.
Schooling
- Schools in both communities received specially designed laptops suitable for remote communities under the Digital Education Revolution NPA. New resource centres have been built at both schools. A range of other capital infrastructure projects have also been delivered including new learning centres in both communities.
Early Childhood
- Children and Family Centres have been built under the Indigenous Early Childhood Development (IECD) NPA. Parenting support programmes are delivered in both communities.
Health
- Both communities have benefited from wellbeing services established to deliver better coordinated and increased health services. Upgrades to aged care facilities have been complete, including new wheelchairs for the Ngooderi Aged Care Facility in Doomadgee.
Safe communities
- Community Safety Action Plans have been developed in both communities using local participatory research methodologies. These plans were key actions in the LIPs for both communities.
Economic participation
- Two locally owned small businesses (concrete and car hire) have been successfully established in Doomadgee. The Mornington Island motel has been completed to accommodate visitors to the community.
Governance and Leadership
- A number of leadership programmes have been conducted for a range of community members such as the Deadly Girls personal development and leadership programme for young women and Strong Fathers, Strong Families Program providing opportunities for personal and leadership development for men.
More information on key achievements for each RSD community in Qld is provided in Appendix I.
3.4.4 Western Australia
A summary of achievements in the four WA RSD communities under each building block is presented below.
Healthy homes
- The WA RSD communities received a combined total of 141 new houses and 243 refurbishments through NPARIH to the end of June 2013. Housing management agreements are in place in most communities.
Schooling
- Schools in the WA RSD locations are employing strategies to increase school attendance, for example by engaging dedicated school attendance officers. Most schools in the communities received up-grades to enhance school infrastructure.
Early Childhood
- Families as First Teachers - Indigenous Parenting Support Services (FaFT‑IPSS) are being delivered in all communities. Most communities are actively promoting the need for early childhood education. For example, there is an early childhood expo held annually in Bardi Jawi communities, and a Parents as Learners Program is in place in Beagle Bay to encourage parents to read to their children. Community members have had input into the design and development of programmes operating from the Children and Family Centres in both Fitzroy Valley and Halls Creek.
Health
- All communities now have improved mental health and/or wellbeing support programmes and have suicide prevention community action plans either completed or under development. Services and infrastructure were also improved in all communities, such as a mobile dental clinic visiting Bardi Jawi communities, a new ambulance in Beagle Bay and Halls Creek, and dialysis treatment available in Fitzroy Valley hospital.
Safe communities
- A new police station was opened in Fitzroy Valley in October 2012. Youth drop in centres or youth coordination programmes have been established in most communities to provide a safe environment and source of information and support for young people.
Economic participation
- Bardi Jawi and Beagle Bay communities have delivered ranger programmes and mentoring support for rangers. A Public Transport Feasibility Study has been completed across all communities to assess the viability of public transport options. Halls Creek and Fitzroy Valley have also implemented vehicle licencing and driver training programmes.
Governance and Leadership
- All communities have progressed their governance arrangements and frameworks. A significant governance project in Bardi Jawi has established an MOU between three discrete community corporations and the Prescribed Body Corporate. The Fitzroy Valley Futures Forum structure has been reviewed and eight sub-committee structures established around themes similar to the Closing the Gap building blocks. The Shire of Halls Creek has established an Aboriginal Affairs Committee and Beagle Bay is in the process of establishing a formal governing structure.
More information on key achievements for each RSD community in WA is provided in Appendix I.
3.4.5 South Australia
A summary of achievements in the two SA RSD communities of Amata and Mimili under each building block is presented below.
Healthy homes
- Both communities received a combined total of 64 new houses and 68 refurbishments through NPARIH to the end of June 2013. The Amata community accepted new tenancy agreements in 2012.
Schooling
- The Amata Youth Action Plan was completed in April 2012 and an Amata Youth Representative Forum has been formed. Eighteen students from Mimili participated in Variety’s Youth Development Project.
Early Childhood
-
An Early Childhood Centre commenced operations in Amata in 2012. Locational Supported Playgroups are also run in both communities.
Health
- A Family and Wellbeing Centre was established in Amata and a range of services are delivered from the centre. Renal dialysis patients can now receive treatment on the APY Lands through the Mobile Dialysis Bus.
Safe communities
- New police complexes are now operational in both Amata and Mimili. Both communities now have access to HF Radio transmission which is an important improvement to community safety as there is no mobile coverage in either community.
Economic participation
- TAFE SA is currently supporting youth from Amata and Mimili with access to training. Anangu work expos provided education pathways from school to employment.
Governance and Leadership
- Anangu women attended the Indigenous women’s issues conference in 2010 and 2011. At the ‘Ngurintja’ Community Engagement Workshop in June 2011, the community, and representatives from the Australian and State Governments discussed the LIP implementation process and community priorities for updating actions in the LIPs. The NPY Women’s Council were engaged to support Amata and Mimili students to form a youth council and participate in community governance and decision‑making.
More information on key achievements for each RSD community in SA is provided in Appendix I.
3.4.6 Northern Territory
A summary of achievements in the 15 NT RSD communities under each building block is presented below.
Healthy homes
- The communities received a combined total of 826 new houses and 975 refurbishments/rebuilds through NPARIH to the end of June 2013. A number of new houses have been built to accommodate disability access. Some communities have new tenancy agreements in place for new and refurbished dwellings. Fourteen loans have been approved for Wurrumiyanga residents to buy and own their homes.
Schooling
- All communities have a school attendance plan in place, supported by the NT Government Every Child Every Day Strategy. Some communities have initiated their own methods of increasing school attendance such as the school collaborating with the police to support students going to school in Lajamanu, and a ‘no school, no store’ policy in Milingimbi. Many communities now have new teacher houses to encourage teachers to stay in the community.
Early Childhood
- The FaFT‑IPSS Program has been established in each community to support Indigenous families and communities to give children the best possible start in life. Many communities have early childhood playgroups in place with some communities encouraging parents to attend with their children, and some communities have crèches to look after children while their parents are at work. New antenatal and maternal health education programmes are also being delivered in some communities.
- New early childhood centres have been completed in Lajamanu and Umbakumba and facilities upgraded in Yirrkala and Wurrumiyanga. Design consultations for Children and Family Centres have also taken place in Ngukurr, Maningrida, Gunbalanya and Yuendumu.
Health
- Lajamanu, Milingimbi and Wadeye received new clinics, with new clinics planned for Ngukurr and Numbulwar. Other clinics have benefited from visiting specialists and new equipment. Many communities have had upgrades to aged care facilities. Most communities have been actively discouraging smoking by promoting anti-smoking initiatives, such as declaring some areas of the community smoke-free zones and encouraging stores to provide stop smoking aids (nicotine abatement products).
Safe communities
- Infrastructure improvements have included new or upgraded women’s safety shelters and men’s places in many communities. In addition road safety infrastructure and street lighting has been improved in most locations.
- Community safety plans have been or are being developed in a number of communities. A number of communities received upgraded or new police facilities. Remote Aboriginal Family and Community Workers work in communities to provide family support services including child protection services. Most communities have a current local counter disaster plan. Many of the new community infrastructure developments are being built to cyclone shelter standards with some functioning as the community cyclone shelter. Volunteer emergency services teams have been established in over half the communities.
- Road safety and dog management education has also been provided in many communities.
Economic participation
- Transport infrastructure improvements are facilitating better access to employment, medical and other services. New or upgraded roads, creek crossings and barge landings have been completed in many communities.
- Land use planning schemes have been implemented in many locations to set the parameters for future development. Area or town plans, zoning maps and internal roads have been gazetted in many RSD locations.
- Labour market profiles have been developed to support community workforce plans and business and economic profiles have been published to highlight opportunities for engagement between RSD communities and external businesses.
- The targeted and accelerated investment in infrastructure, particularly housing and road upgrades, and in services such as childcare, has created local employment and training opportunities in many communities.
Governance and Leadership
- Community governance structures and the community voice in service planning have been strengthened through the establishment of LRGs where these did not previously exist.
- Local government decision-making has been supported through funding for training and mentoring for elected members of remote shire councils. Youth strategies and action plans have been developed to support the development of future leaders.
- As at 30 June 2013, LRG members and other community members in six NT communities, (Lajamanu, Milingimbi, Ntaria, Numbulwar, Galiwin’ku and Wurrumiyanga) had participated in the LCAP. LCAP aims to improve cultural awareness amongst government workers and service providers to strengthen effective engagement and improve the delivery of government programmes and services.
More information on key achievements for each RSD community in the NT is provided in Appendix I.
3.5 Delivery of services under other National Partnership Agreements in Remote Service Delivery locations
As discussed in Chapter 2 the NPA RSD was developed within the context of the broader COAG reform commitment to Close the Gap in Indigenous disadvantage. The NPA RSD states that the RSD, together with other relevant COAG agreements, will contribute to the objectives of the NPA RSD.[252] The major Indigenous specific NPAs involved in delivering services in RSD priority locations include:
- National Partnership Agreement on Indigenous Early Childhood Development (IECD)
- Element 1: Integration of early childhood services through Children and Family Centres (CFCs)
- Element 2: Increased access to antenatal care, pre-pregnancy and teenage sexual and reproductive health (Antenatal and Sexual and Reproductive health)
- Element 3: Increased access to, and use of, maternal and child health services by Indigenous families (mother and babies services)
- National Partnership Agreement on Early Childhood Education
- Closing the Gap in Indigenous Health Outcomes National Partnership (Indigenous Chronic Disease Package)
- National Partnership Agreement on Indigenous Economic Participation
- National Partnership Agreement on Remote Indigenous Housing
- National Partnership Agreement on Stronger Futures in the Northern Territory.
The major mainstream NPAs involved in delivering services in RSD priority locations include:
- Smarter Schools National Partnership Agreements
- National Partnership Agreement for Low Socio-Economic Status School Communities (Low SES NP)
- National Partnership Agreement for Literacy and Numeracy (LNNP)
- National Partnership Agreement on the Digital Education Revolution, including the Computer Fund element (DER Computer Fund)
- National Partnership Agreement on the Nation Building and Jobs Plan, including the Building the Education Revolution (BER).
Table 3.4 shows that all RSD locations received services from at least five other Indigenous specific NPAs. Further information on each NPA is provided in Appendix J.
Table 3.4 National Partnership Agreements and associated elements that provided services to RSD locations
|
Jurisdiction |
Community |
National Partnership Agreement |
|---|---|---|
|
New South Wales |
Walgett |
IECD (Antenatal and Sexual and Reproductive health), Low SES NP, LNNP, DER Computer Fund, Indigenous Chronic Disease Package, NPARIH, BER, Trade Training Centre |
|
|
Wilcannia |
IECD (Antenatal and Sexual and Reproductive health), Low SES NP, DER Computer Fund, Indigenous Chronic Disease Package, NPARIH, BER (no science and language centre), Trade Training Centre |
|
Queensland |
Aurukun |
IECD (Antenatal and Sexual and Reproductive health, Mothers and Babies services), LNNP, DER Computer Fund, Indigenous Chronic Disease Package, NPARIH, BER |
|
|
Coen |
IECD (Antenatal and Sexual and Reproductive health, Mothers and Babies services), Indigenous Chronic Disease Package, NPARIH, BER |
|
|
Doomadgee |
IECD (CFC, Antenatal and Sexual and Reproductive health, Mothers and Babies services), Indigenous Chronic Disease Package, Low SES NP, DER computer fund, NPARIH, BER, Trade Training Centre |
|
|
Hope Vale |
IECD (Antenatal and Sexual and Reproductive health, Mothers and Babies services), Indigenous Chronic Disease Package, Low SES NP, Chronic Disease Package, NPARIH, BER |
|
|
Mornington Island |
IECD (CFC, Antenatal and Sexual and Reproductive health, Mothers and Babies services), Low SES NP, DER computer fund, Indigenous Chronic Disease Package, NPARIH, BER, Trade Training Centre |
|
|
Mossman Gorge |
IECD (Antenatal and Sexual and Reproductive health, Mothers and Babies services), Indigenous Chronic Disease Package, NPARIH (awaiting tenure plan), Trade Training Centre, BER |
|
Western Australia |
Bardi Jawi |
IECD (Mothers and Babies services), Indigenous Chronic Disease Package, Low SES NP, DER computer fund, NPARIH, Trade Training Centre, BER (no science and language centre) |
|
|
Beagle Bay |
IECD (Mothers and Babies services), Low SES NP, DER computer fund, Indigenous Chronic Disease Package, NPARIH, Trade Training Centre, BER |
|
|
Fitzroy Valley |
IECD (CFC, Mothers and Babies services), Low SES NP, DER computer fund, Indigenous Chronic Disease Package, NPARIH, BER |
|
|
Halls Creek |
IECD (CFC, Mothers and Babies services), Low SES NP, DER computer fund, Indigenous Chronic Disease Package, NPARIH, Trade Training Centre, BER |
|
South Australia |
Amata |
IECD (Antenatal and Sexual and Reproductive health), Low SES NP, DER computer fund, Indigenous Chronic Disease Package, NPARIH, BER, Trade Training Centre |
|
|
Mimili |
IECD (Antenatal and Sexual and Reproductive health), Low SES NP, DER computer fund, Indigenous Chronic Disease Package, NPARIH, BER, Trade Training Centre |
|
Northern Territory |
Angurugu |
IECD (Antenatal and Sexual and Reproductive health), Low SES NP, Indigenous Chronic Disease Package, LNNP, DER computer fund, NPARIH, BER, Trade Training Centre, Stronger Futures |
|
|
Galiwin’ku |
IECD (Antenatal and Sexual and Reproductive health, Mothers and Babies services), Indigenous Chronic Disease Package, Low SES NP, DER computer fund, NPARIH, BER, Trade Training Centre, Stronger Futures |
|
|
Gunbalanya |
IECD (CFC (2014), Antenatal and Sexual and Reproductive health), Indigenous Chronic Disease Package, Low SES NP, DER computer fund, NPARIH, BER, Trade Training Centre, Stronger Futures |
|
|
Gapuwiyak |
IECD (Antenatal and Sexual and Reproductive health), Indigenous Chronic Disease Package, Low SES NP, DER computer fund, NPARIH, BER, Trade Training Centre, Stronger Futures |
|
|
Lajamanu |
IECD (Mothers and Babies services), Low SES NP, DER computer fund, Indigenous Chronic Disease Package, NPARIH, Trade Training Centre, BER, Stronger Futures |
|
|
Maningrida |
IECD (CFC (2014), Antenatal and Sexual and Reproductive health, Mothers and Babies services), Low SES NP, Indigenous Chronic Disease Package, DER computer fund, NPARIH, BER, Trade Training Centre, Stronger Futures |
|
|
Milingimbi |
IECD (Antenatal and Sexual and Reproductive health), Low SES NP, Indigenous Chronic Disease Package, DER computer fund, NPARIH, Trade Training Centre, BER, Stronger Futures |
|
|
Wurrumiyanga (Nguiu) |
IECD (Antenatal and Sexual and Reproductive health), Low SES NP, Indigenous Chronic Disease Package, DER computer fund, NPARIH, BER, Trade Training Centre, Stronger Futures |
|
|
Ngukurr |
IECD (CFC (2014), Antenatal and Sexual and Reproductive health, Mothers and Babies services), Low SES NP, Indigenous Chronic Disease Package, DER computer fund, NPARIH, BER, Trade Training Centre, Stronger Futures |
|
|
Numbulwar |
IECD (Antenatal and Sexual and Reproductive health), Low SES NP, Indigenous Chronic Disease Package, DER computer fund, NPARIH, Trade Training Centre, BER, Stronger Futures |
|
|
Ntaria (Hermannsburg) |
IECD (Mothers and Babies services), Low SES NP, DER computer fund, Indigenous Chronic Disease Package, NPARIH, BER, Trade Training Centre, Stronger Futures |
|
|
Wadeye |
IECD (Antenatal and Sexual and Reproductive health, Mothers and Babies services), Low SES NP, Indigenous Chronic Disease Package, DER computer fund, NPARIH, BER, Trade Training Centre, Stronger Futures |
|
|
Yirrkala |
IECD (Antenatal and Sexual and Reproductive health, Mothers and Babies services), Low SES NP, Indigenous Chronic Disease Package, DER computer fund, NPARIH, BER, Trade Training Centre, Stronger Futures |
|
|
Yuendumu |
IECD (CFC (2014), Antenatal and Sexual and Reproductive health, Mothers and Babies services), Low SES NP, Indigenous Chronic Disease Package, DER computer fund, NPARIH (land tenure reforms in progress), Trade Training Centre, BER, Stronger Futures |
|
|
Umbakumba |
IECD (Antenatal and Sexual Reproductive Health), Low SES NP, Indigenous Chronic Disease Package, DER computer fund, NPARIH, BER, Trade Training Centre, Stronger Futures |
3.6 Expenditure
3.6.1 Australian Government expenditure
The NPA RSD provides funding of $291.2 million over 5 and a half years (2008-09 to 2013-14), with the Commonwealth contributing $187.7 million and the relevant states and the NT contributing a total of $103.5 million. The former Department of Families, Housing, Community Services and Indigenous Affairs, as the lead Commonwealth agency received the full Commonwealth Government contribution. This budget is dedicated to the provision of the SGI, community governance capacity development, baseline mapping and interpreter services (see Table 2.3 in Section 2.5 for funding responsibilities for the implementation of the NPA RSD).
It is important to note that funding provided under the NPA RSD does not primarily fund activities in remote communities. Funding for services and programmes at the community level is provided through a number of other sources including other NPAs and Commonwealth and jurisdictional programmes. While state, NT and Commonwealth governments have made significant investment in RSD communities through these sources, it is difficult for the evaluation to determine the exact quantum of this funding. Government programmes and systems are often not structured to provide location specific financial information and disaggregation of funding to community level is not always possible, and where available, is not always meaningful.
3.6.2 Indigenous Remote Service Delivery Special Account Expenditure
To support the implementation of the NPA RSD, the Australian Government committed $46 million over three years to the Indigenous Remote Service Delivery (IRSD) Special Account, with initial funding contributed by the former department of:
- FaHCSIA contributed $32 million
- Education, Employment and Workplace Relations (DEEWR) contributed $8 million
- Health and Ageing (DoHA) contributed $6 million.
Additional contributions have been made to the IRSD Special Account from both Australian and state/territory governments for projects in RSD locations.
IRSD Special Account Activity
As at June 2013 the total IRSD Special Account funding committed under contract over the three financial years (2010–11 to 2012–13) was around $31.7 million[253] with a total of 184 projects funded.
An overview by jurisdiction is provided below.[254]
New South Wales
As at June 2013, 30 projects were funded to a total of nearly $2 million over the three financial years (2010–11 to 2012–13). These included:
- Birraleegal preschool garden and outdoor equipment
- Birraleegal preschool shaded areas
- Wilcannia radio station business manager/coordinator
- Wilcannia River Radio community interactive website
- Wilcannia Youth Workers
- Walgett Interactive Program for youth
- Special Olympics
- Healthy Food Program for children
- Wilcannia RSPCA Animal Health Clinics
- Walgett Police Mobile Youth Van
- Wilcannia Tutorial Centre project for high risk disengaged young people
- Upgrade of playground infrastructure at Walgett Community College.
Queensland
As at June 2013, 30 projects were funded to a total of around $6 million over the three financial years (2010–11 to 2012–13). These included:
- Coen Kindergarten funding to reduce staff/child ratios
- Upgrade works to Coen aerodrome
- Hopevale banana farm infrastructure
- Engagement of Evolve consultants to run multi-community leadership workshops and training in Mt Isa
- Coen Community Communication Network
- Coen Housing Walt Agreement
- Pride in My Home Initiative for Doomadgee and Mornington Island
- Repair and Purchase Street Lighting in Mornington Island and Doomadgee
- BMX track in Doomadgee
- Innovative Learning Centre and Young Mothers Learning Centre in Mornington Island
- Parents Supporting Learning initiative to increase children's attendance in Mornington Island and Doomadgee.
South Australia
As at June 2013, 63 projects were funded to a total of nearly $2.5 million over the three financial years (2010–11 to 2012–13). These included:
- Purchase of Forklift for Mimili Maku Store
- Support for the Grammy Award winning band ‘Tinariwen’ to perform in Amata
- Yankunytjatjara Wangka language preservation
- Adelaide Football Club Aboriginal Youth Leadership Programme
- Football and Softball Equipment - Mimili Community
- Heating and Pool Blanket for Amata Community Pool
- Mimili and Amata Night Patrols
- Tackling Humbug through Street Theatre - Amata
- Purchase of equipment to support the sports carnival (football and softball) - Amata
- VacSwim Water Safety and Survival Youth Program - Mimili.
Western Australia
As at June 2013, 26 projects were funded to a total of around $4.1 million over the three financial years (2010–11 to 2012–13). These included:
- Beagle Bay Women’s Centre Electrical Upgrade
- Halls Creek Music Festival – governance support
- Kimberley Employment Based Accommodation Project
- Governance Project for Bardi Jawi communities
- Cultural Governance Project across all four RSD communities
- Halls Creek Healing Project
- Development of Suicide Prevention Plans in all four RSD communities
- Development of Environmental Health Plans across all four RSD communities
- Marninwarntikura Women’s Bush meeting
- Djarindjin dust suppression, road maintenance and pest management project
- Fitzroy Valley Youth Coordination Project
- Halls Creek Youth Services Network coordinator.
Northern Territory
As at June 2013, 32 projects were funded to a total of $15.2 million over the three financial years (2010–11 to 2012–13). These included:
- Wadeye Festival - Purchase of musical instruments and amplification equipment
- ‘Longhouse’ visitor accommodation refurbishment in Lajamanu
- Ntaria - Relocatable Water Supply for Cultural Business
- Ngukurr's Inaugural Cultural Festival - Sound equipment
- Millingimbi gym equipment
- Yirrkala basketball court upgrade
- Grader purchase - Numbulwar Numburindi Community
- Wadeye Police - Community Liaison Officer vehicle
- Replacement of four classrooms at the Our Lady of the Sacred Heart Thamarrurr College ($2.182 m)
- Parent Room for Yuendumu School.
In addition the Special Account provided almost $500,000 for cataract surgery for RSD locations in NSW and the NT. The Special Account also supported National Aboriginal Men’s Health Summits ($400,000) and projects supporting the use and capacity of Indigenous Interpreters ($1.15 m).
More information on the IRSD Special Account, including a description of all projects funded to June 2013 is provided at Appendix K.
4 Community research study
Colmar Brunton Social Research
The aim of the Remote Service Delivery (RSD) community research study component of this evaluation was to obtain a ground-up perspective of change in service delivery in the communities. Views on change since the commencement of the National Partnership Agreement on Remote Service Delivery (NPA RSD) were obtained from over 700 people in a sample of ten RSD communities. This involved both quantitative and qualitative data collection methods using Indigenous researchers. Participatory research methods[255] were incorporated into the design and conduct of the study. A primary goal of the study was to foster research capability within communities through the recruitment, training and mentoring of local people as part of the research team.
The project aimed to collect systematic and robust data which:
- allowed for individual assessment of current status and recent changes in each community
- aided government understanding of service provision through systematic qualitative evaluation research
- provided a resource for each community involved that can be referenced for future community development and planning.
4.1 Highlights of study findings
- Half of all community members consider that their community (50%) and their own lives (52%) are improving. More and improved housing, new infrastructure, more preschool opportunities and employment are often cited as reasons why things are improving.
- Both the survey and qualitative data tell us that community members recognise there are more services available now in communities and the survey tells us people consider key services to be more helpful than previously.
- The qualitative data show that the challenge now is around encouraging people to take advantage of these opportunities and use the new or improved services to help themselves and the community.
- Community members were very positive about attitudes towards employment, with almost all respondents stating that it is a good idea to have a job (88%). Around two-thirds think more people have jobs compared with three years ago (65%), however, qualitative data show that people feel many jobs are given to outside people.
- The views about the usefulness of government in community were mixed:
- One in five community members think government listens and works well with their community (19%) while two in five think government does not (40%).
- A quarter of community members think the government understands their culture and traditions (25%) while almost half think that government does not (47%).
- Slightly more think the government is making their community better (32%), one third does not (31%) and, 29 per cent are indifferent.
- Community members were divided in their opinions about changes in the strength and leadership in their communities. Slightly more community members indicated that leadership had been strengthened in their community (35%), compared to those who thought it had weakened (31%).
- Around a quarter of people who had been a member of their LRG received training to help them engage more effectively with the government, advocate community needs and disseminate information back to the community members (24%). The need to strengthen the capacity of local people through education and relevant training was a consistent theme in the qualitative data.
- The qualitative data show that there are two perceptions about community and individual change and development. Many people say it is a two way process and that individuals and the community has to take responsibility and change their behaviours around some aspects of community life. Others strongly feel that government needs to listen more, be more accountable and involve more local people in employment and management roles.
Multivariate analysis shows that:
- Those who see their community as ‘on the way up’ tend to live in smaller communities and to have better perceptions of their community leaders
- Respondents who see their own lives as ‘on the way up’ are more likely to be employed and to have greater knowledge of governance.
4.2 Purpose
The RSD community research study collected information from community members using a quantitative survey and qualitative data collection. This study aimed to obtain a ground-up perspective of change in service delivery, governance and leadership, community engagement and closing the gap objectives in the communities since the commencement of the NPA RSD.
The study used a mixed method approach, including a co-design research development workshop with local Indigenous researchers, a face-to-face quantitative survey of 726 community members in a sample of communities across the five RSD jurisdictions, as well as qualitative discussions with selected participants and a participatory research component (often a hybrid of the Most Significant Change technique). Where possible local Indigenous researchers were engaged to help facilitate entry into communities, broker relationships with community members, promote the research and assist with data collection and analysis. The sample of communities was based on characteristics so that a mix in size[256], isolation and socio economic demographics was achieved for the study.
Two consulting organisations were contracted by the Australian Government to undertake the study; Colmar Brunton Social Research and Social Compass. Both were chosen through a select tender process using established government research procurement panels. In addition to undertaking the research in eight of the ten communities, Colmar Brunton had management and analytical oversight of the entire project, including undertaking the analysis of the data. The Colmar Brunton team involved very experienced people and organisations: Bowchung Consulting, ARPnet, Kate Sullivan and Associates and Lillian Holt, Senior Aboriginal Consultant and Elder. Social Compass undertook the research in the remaining two communities where they had good networks and previous research experience.
4.2.1 Evaluation questions
The community research study helped provide valuable additional information to help answer the following four key questions that are guiding the RSD evaluation:
- Has access to and delivery of services improved?
- Has capacity of community and government to engage with one another improved?
- Have there been changes in the RSD sites that contribute to the Closing the Gap objectives?
- What have we learnt from the initiative that can inform remote service delivery, community capacity building, and place based approaches?
4.2.2 Methodology
The research was conducted in a sample of 10 RSD communities. The sample was drawn from 23 of the 29 communities[257] and was selected to provide a cross-section of communities according to size and jurisdiction. The final communities were approached after extensive consultation with the Evaluation Advisory Group (EAG). The final decision to participate was dependent upon agreement from the individual communities.
The community research study involved three components:
- a co-design research development workshop with local researchers, the former Australian Government Department of Families, Housing, Communities and Indigenous Affairs and research consultants
- a face to face quantitative survey
- qualitative data collection.
A three day co-design development workshop was held in Adelaide 29–31 July 2013. Fifteen local researchers from most of the sample communities participated. The workshop covered discussion of the project and its objectives, content and methodology.
Material from the workshop was used to develop a standard questionnaire for the quantitative survey that was undertaken in each sample community. Each community received the same quantitative questions, however changes in the wording of the survey questions were allowed based on the advice of local Indigenous researchers, and sometimes by the GBM/IEO to ensure the questions and response categories were suitable at the individual community level. Field work in one community was used as a pilot to test the survey and subsequently minor changes were made for use in the other nine communities taking part in the study.
The quantitative survey consisted of tick-a-box response and rating scales and open-ended questions that allowed community members to explain their views on a range of issues. Most survey interviews lasted approximately 45 minutes, but some went as long as 2.5 hours and others were as short as 20 minutes. Some people completed the questionnaire for themselves but the majority were interviewed and their responses recorded by the researcher. I-pad technology was used to undertake the survey in around half of the communities and paper questionnaires were used in the remaining communities – the choice was made in consultation with each individual community.
In total 726 community members participated in the survey. All results presented in the chapter have been tested and are valid at a 95 per cent confidence interval.
The qualitative component of the study was varied across the communities. The methods included individual and group discussion, variations of the Most Significant Change method and tools and techniques developed by local Indigenous researchers.[258] Commentary recorded by the researchers for many of the survey interviews was also included in the qualitative data.
As part of the community research study, six ethics committees covering five jurisdictions were approached to cover the research. It was an iterative process as preparatory work in the communities was required to obtain all of the details necessary for the ethics approval process. This information was then provided to the relevant ethical committee through their next scheduled meeting. All six gave written ethical endorsement of the RSD community research study including the use of local Indigenous researchers to facilitate the study in accordance with local culture and languages.
Quotations in this Chapter are attributed with age and gender and where possible ‘awareness levels’ (aware, unaware) based on people’s answers to the governance knowledge questions in the survey.
4.3 Demographics
This section details the demographic profile of the participants in the survey component of the study and provides a comparison of the sample with ABS data from the 2011 Census.
4.3.1 Participants
A total of 726 community members participated in the survey.
The majority of respondents have always lived in the community (81%) and a further 10 per cent lived most of the time in the community. The sample was approximately split evenly between males and females, with half of the sample in some form of employment (50%). The majority of respondents were aged between 18 and 44 (68%) and all were aged 18 and over. Fifty per cent of respondents lived with children in their household.
4.3.2 Survey sample compared with population
The sample has a good range of ages, similar to the population profile counted in the 2011 Census. The data collection teams made an effort to get a survey sample that was representative of the population structure in each community, but ensured people who wanted to participate were included.
Colmar Brunton contrasted the demographic characteristics of participants in the survey against Australian Bureau of Statistics 2011 Census data. As shown in Table 4.1, a representative sample was obtained by gender (47% male, 53% female for both the survey sample and population).
Such concordance was not always the case for age where:
- younger community members (18 – 24 year olds) in the community survey sample compared to the overall population (17% and 26% respectively)
- older community members were, over-represented in the sample (45-64 year olds) 29 per cent of the survey sample compared with 21 per cent of the population.
Experience shows that it can actually be quite desirable to have such a mix of ages given that older community members often have a greater depth of knowledge on the subject at hand. Furthermore, it is culturally appropriate to ensure community leaders and Elders are included.
Table 4.1 Comparison of survey participants against 2011 Census data
|
Demographic |
ABS |
Sample |
Difference |
||
|---|---|---|---|---|---|
|
Gender |
n= |
% |
n= |
% |
|
|
Male |
2,944 |
47% |
342 |
47% |
0% |
|
Female |
3,371 |
53% |
384 |
53% |
0% |
|
Total |
6,315 |
100% |
726 |
100% |
- |
|
Age |
|
|
|
|
|
|
18-24 |
1,650 |
26% |
123 |
17% |
-9% |
|
25-44 |
2,964 |
47% |
363 |
51% |
4% |
|
45-64 |
1,352 |
21% |
205 |
29% |
8% |
|
65+ |
349 |
6% |
31 |
4% |
-2% |
|
Total |
6,315 |
100% |
726 |
100% |
- |
4.4 Community knowledge of the Remote Service Delivery model
This section covers community members’ knowledge about various components of the RSD model. A key component of the NPA RSD was the establishment of Government Business Managers (GBMs) or equivalents and Indigenous Engagement Officers (IEOs) into each RSD location in conjunction with a Local reference Group (LRG) to simplify and encourage stronger relationships between communities and government. The model involved government working with the community through knowledge sharing and interaction between the GBM, IEO and LRG. It was envisaged that the LRG would have the primary communication and knowledge sharing functions with the general community. A primary output of the model was the development of a Local Implementation Plan (LIP).
All 726 survey respondents were asked if they were aware of the GBMs, IEOs, LRGs and LIPs.[259] The Local Reference Group (LRG) was the most well-known with 61 per cent of respondents being aware of their LRG. Over half of the people knew about the IEO in their community (54%) while less than half knew about the GBM in their community (43%) and one third (35%) had heard about the LIP. Knowledge of the RSD model appears to be higher for older respondents.
Respondents who were aware of the LRG were also asked to rate the performance of the LRG. Survey results show that over one third of the respondents who were aware of the LRG rated them highly (a score of 7-10 out of 10) for three separate components:
- talking up for the community (44%)
- talking up for individuals (37%)
- giving information back to individuals (35%).
Community residents were also asked who they would consult about community issues and needs. Just over a quarter of all respondents nominated the LRG as an option
One third (35%) of respondents knew about the LIP. Of those who had heard about the LIP thirty per cent thought that it told the ‘right story’ about their community and a further 18 per cent thought it told the right story ‘a little bit’. Quite a number knew about the LIP but had not seen it (34%). Older community members (45 plus) and the employed were more likely than others to be aware of the plan. Feedback suggests that while the LIPs were useful in some communities, in others they were too ambitious and not closely enough aligned with available funding. Their lack of implementation had the effect of souring relationships with community members who worked on them and through that they would be implemented in their entirety.
Figure 4.1 Awareness and usefulness of LIP
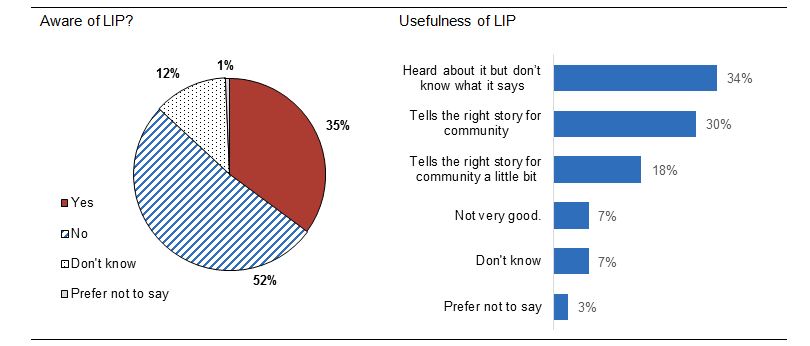
QB4. (SR) Do you know about the Local Implementation Plan or LIP?
QB5. (SR) Does the current Local Implementation Plan tell the right story about your community?
Bases: QB4, all respondents, (n=726). QB5, aware of LIP (n=256)
Sections 4.6 and 4.7 include quotes from local community members, collected as part of the research. Where known the quote includes the sex, age and ‘awareness status’ and employment status of the person who provided the quote. A person’s ‘awareness level’ is based on people’s answers to the governance knowledge questions (QB1-4 i.e. awareness of the GEC / GBM, IEO, LRG and LIP – to qualify as aware the community member needed to be aware of all four of these elements of the RSD program) in the questionnaire and employment status. Sometimes employment status and / or awareness levels were not captured because this information was not always collected during the qualitative research.
4.5 Perceptions of community leadership and community behaviour
The survey included a number of questions in relation to community leadership and community behaviour in an attempt to gain insight into the functioning of a community. All respondents were given a number of statements regarding aspects of leadership such as listening, trust and respect, and leadership strength, and asked ‘How much do the following statements sound like your community’ (rating out of 10).
In relation to leaders ‘listening to the people’, the responses were polarised with one third giving a rating of seven or higher (35%) and 29 per cent giving a rating of four or lower. The story is similar for trust in leadership with 39 per cent rating seven or over and 28 per cent rating four or lower. Interestingly, in relation to respecting leadership, closer to half gave a rating of seven or higher (45%) and less people gave a rating of four or less (23%).
Trust and respect are clearly closely linked concepts and emotions. It is interesting that the data show that leaders are more respected than trusted. However it should be noted that there was some variation in the response rates across individual communities in the study, with some communities rating both trust and respect of leaders similarly. Women and the unemployed were more likely than men and people in employment to give a lower rating against these leadership questions.
Looking at the strength of leadership over the past three years, over a third of people thought their leaders had become stronger (35%) with slightly less thinking leadership had weakened (31%). Qualitative data suggest that some people linked their perceptions of strength of leadership with the number of new buildings and services in their community.
The process of any community improving takes a range of initiatives and attitudes. Leadership, governance, service provision and government effort all have an impact. However, the actions and behaviours of community residents are also a key part of any change that takes place. Just over half of community members (52%) scored people in their community 7-10 out of 10 for trying to make their community better. Less than a fifth (15%) scored people in their community 1-4 out of 10 for trying to make the community better and a little over a quarter (28%) gave people a score of 5-6 out of 10.
When respondents were asked who they talk to about community needs and what should be happening in their community, the most common response was to ‘talk with community Elders who would talk to the LRG member for me’ (54%). This was followed by family members (39%), members of the LRG (26%) and people working in services (25%). Only 14 per cent said they would approach the GBM or the IEO.
4.6 Research findings against the evaluation questions
This section provides findings from the community research study against each of the four evaluation questions described in Section 4.2.1 above. Each evaluation question presents analysis of the relevant questions from the questionnaire and supported qualitative responses.
4.6.1 Has access to and delivery of services improved?
Qualitative findings show that many community members acknowledged there were more services ‘on the ground’ in their community compared with three years ago. In particular, more services for young children and parents like Save the Children, Family Support Program, KidsMatter, new crèches and preschool centres were often mentioned. When asked about the most important change in their community over the last three years more services for the people came in equal third place as the biggest change behind improvements in housing and infrastructure. In addition, when asked an open-ended question about anything else people wanted to say about services, the second highest response was that services were helpful and that better services had helped improve the community.
Survey data
Specifically, the survey asked respondents if five key services (Police, Health Clinic, Centrelink, School, and Employment services) had become more or less helpful over the past three years.
The majority of respondents stated that the Health Clinic (68%), School (63%), Centrelink (57%) and Employment services (51%) have become more helpful over the past three years, and slightly less (43%) said the Police had become more helpful (Figure 4.2).
Figure 4.2 Helpfulness of organisations
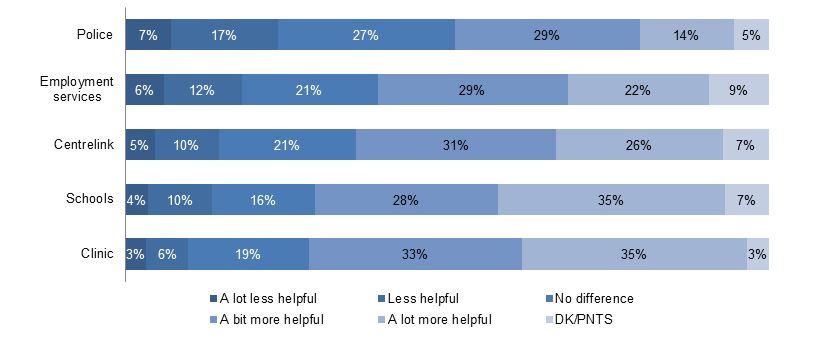
All respondents were asked to score the five key service providers out of 10 in relation to how well they talk to each other to help individuals and their families. Reponses were more or less evenly split between people who rated these services highly (7 or more) and people who rated them poorly (4 or less) for talking to each other (32% and 29% respectively). Just under a quarter (24%) gave a neutral score of 5-6.
Respondents who were employed were asked to score their employment organisation against how well they listen and work with other services. The majority (60%) scored their employer highly (7-10) for listening and working with other service providers, while only 10 per cent scored their employer four or below. Just under a quarter (23%) gave their employer a neutral score of 5-6 out of 10.
Similarly, most employed people felt their employer listened and worked effectively with other people in their community with just over two thirds (67%) scoring their employer a seven or more out of 10. Just under a fifth (19%) gave their employer score of 5-6 out of 10 and only eight per cent scored their employer 1-4 out of 10.
All respondents were asked an open-ended question about what would make service provision more effective. A third of respondents commented along the lines of the need for services to work better together and communicate better with locals and Elders. Commentary around these responses shows that some community members see a lack of coordination in service delivery, duplication of effort amongst services, people ‘falling through the cracks’, and a lack of follow up for people and families who may be in crisis situations. Generally it was felt that if services coordinated their efforts more effectively these problems could be mitigated and organisations would be better placed to service the needs of community members.
Qualitative data
Commentary collected as part of the survey and through qualitative methods provides insight into why community members think service providers may not communicate and work together.
Some community members feel that service providers often came to their community with preconceived ideas or had their own agendas about what needed to be done and how it was going to be done. Community members want more input into ‘the what’ and ‘the how’ of service provision in their community. They also want service providers to undergo ‘community specific’ cultural awareness training to help ensure service provision is culturally competent:
Services become very self-centred and just focussing on their own area and fail to see bigger picture within the community. Some of that is due to empire building by non-Aboriginal people…white fella politics. The problem is they are all employed by different departments. They all got their own law and way of doing things. Makes it hard to work together because all places have own law and things they want to do. Female, older, aware
Services tend to work alone out of fear of losing their credibility, funding and future work. Service provider meetings allow services to come together but the agenda is weak and doesn't report against the LIP or any other plans in the community. There is no accountability and government keeps on putting new plans instead of finishing current plans. There is still no collaboration across all services and this impacts on the quality of service to the community resulting in a lack of decent services. Female, middle aged, aware
There is a desire for more employment of local people in services, particularly management positions. Community members want more local people rather than outsiders employed in services. This would provide more of a sense of community control and more employment opportunities and positions that many community members feel should be filled by a local person rather than an outsider:
The organisations ‘on the ground’ are for outside employment. There are no career pathways for local people due to lack of support or resources and funding to empower our local workforce. We have too many fly in and out service providers yet best practices shows on the ground provides better outcomes. Female, older, aware
The government service provider staff that work in community must start thinking about training local people for their positions because most of the government staff are not community people so they don't know the real community issues and people. Female, middle aged, not aware
There is also a desire for more local control of services and more funding transparency in their delivery:
Local people need training so we can run our own organisations and run the community and have own businesses. Male, middle aged, not aware
We need more Indigenous workers in the government agencies, a lot of people are outsides and they don't know what the community wants and they don't listen. Female, younger, aware
There needs to be more recognition of local law and systems like the political organisation of the clans and authorities within those systems, the conventions and law associated with those systems like recognising that the Traditional Owners are the ultimate authority not the Local Reference Group. Male, younger, aware
Some had a sense of frustration that service providers and local leadership groups had made little progress on some key issues:
These agencies have meetings but nothing is happening, there is no change. The kids steal and break things and no one is looking after their kids. Nothing changes and even when people listen they don’t do anything. Male, middle aged, not aware
This view suggests that some people have an external locus of control. That is, they look to the government and service providers rather than to themselves to resolve community problems.
4.6.2 Has capacity of community and government to engage with one another improved?
One of the objectives of the research was to determine if the capacity of community and government to engage with one another had improved. As noted earlier, a key component of this objective was the introduction of Government Business Managers (GBMs) or equivalents and Indigenous Engagement Officers (IEOs) into each RSD location in conjunction with a Local reference Group (LRG) to simplify and encourage stronger relationships between communities and government. The model involved government working with the community through knowledge sharing and interaction between the GBM, IEO and LRG. It was envisaged that the LRG would have the primary communication and knowledge sharing functions with the general community.
Survey data
Respondents were asked to give the Government a mark out of 10 for how well they listen and work with the community. Nineteen per cent scored the government seven or higher, while forty per cent scored four and under. This perception of how the government works in the community is one of the lowest ranking scores throughout the entire survey. However, it should be noted there is no baseline to judge if this is an improvement or a decline and that there was strong variation in the responses of different communities.
In an open-ended question to identify how improvements in ‘working together’ may be achieved, a quarter of respondents (26%) said the Government could work better with the community by engaging in genuine two-way listening with the community.
Community members were asked to rank their perception of the extent to which governments understand their community, and how hard the government is working to improve their community (Figure 4.3).
Nearly half of community members (47%) scored the government four or below for understanding their community’s culture and traditions. Only a quarter (26%) gave a score of seven or over. This low score may have been partially because many respondents interpreted the question to mean the governments’ understanding of their ceremony and kinship structures.
Around a third of respondents gave a score of seven or more in relation to the Government making their community better (32%). Men were more likely than women to give the government a score of 9‑10 out of 10.
Figure 4.3 Governments’ understanding of culture and, making the community better
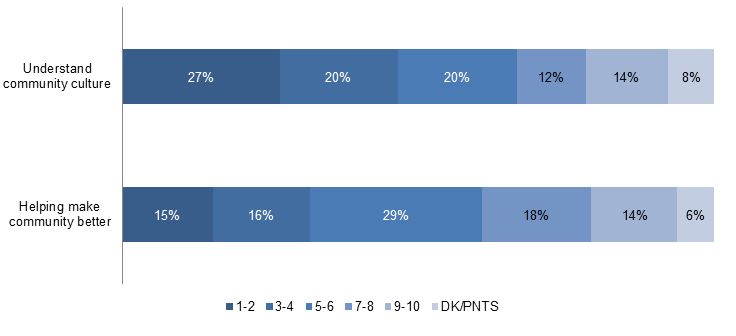
Of those respondents who were or had been members of an LRG, less than a fifth (16%) scored the government 7-10 out of 10 for how well they listen to the LRG.
Qualitative data
The qualitative material reiterates the results of the survey – many community members do not feel that the government is listening, and feel that the Government does not understand their community. Unrealistic expectations being raised by the creation of the LIPs may explain some of this:
My signature is on [the LIP] and I am ashamed of it. It was signed, sealed and delivered to government but it has not been reviewed or evaluated or tracked. Female, older, aware
I think we try hard to tell the government and they try hard to listen. But they don't really understand our ways and we definitely don't understand theirs. They talk about governance and communities and subcommittees... that's not really our way of doing things its theirs. Female, younger, aware
If they [the government] listen better instead of coming here with pre-conceived ideas and plans. They need to come here and really listen and let the community develop own ideas and polices then support the community develop and implement the policy. Male, older, aware
There needs to be more recognition of local law and systems like the political organisation of the clans and authorities within those systems, the conventions and law associated with those systems like recognising that the Traditional Owners are the ultimate authority not the Local Reference Group. Male, younger, aware
Some people have had enough of the consultation and discussion around the Remote Service Delivery process:
…why are we still talking about it, we have been talking about these things for years now…why doesn’t the government just get on and do it, we have already told them what we want. Male, middle aged, awareness unknown
In relation to culture and traditions, some people were positive about the role of the IEO feeling it was a genuine attempt by government to try to better understand the needs and aspirations of their community:
…IEO shows the government wants to listen and engage with us at the community level because they are employing one of our own people. Female, middle aged, aware
There was some discussion around the governance of the LRG with some respondents feeling that often the LRG were more focused on their own interests than genuine community centred engagement:
They [the LRG] do not engage with a unified voice…most have their own personal and private agendas about their own land and outstations. It’s always about who can I borrow the next car off so I can go to (community) or fishing and hunting in my own country. Female, middle aged, aware
The leaders are so focussed on their own agenda, their own family and their own needs and wants. They do not represent the larger community. Female, middle aged, aware
There was also discussion about the role of the local people in making the community better with some saying that it is a two way process:
Aboriginal people need to work together; they need to recognize that their problems are their responsibility and to stop looking for handouts. Female, older, aware
The community themselves need to work for themselves and the different clans need to bury arguments and get on. Lots of mix of clans now all related. One day it will be that we are all one clan. Female, older, aware
Needs to be two ways [Government and community working together]. We need help from government to look after our community and our kids. We need better and more houses, more jobs and education for our kids. Local people need to take advantage of these opportunities. Kids need to go to school for their future so they can be future leaders. There is only a short time for Elders left. Male, middle aged, not aware
4.6.3 Have there been changes in the Remote Service Delivery sites that contribute to the Closing the Gap objectives?
In 2008, the Council of Australian Governments (COAG) set specific and ambitious targets and building blocks to address issues facing Indigenous communities, referred to as Closing the Gap. The building blocks are:
- Early Childhood
- Schooling
- Health
- Economic Participation
- Healthy Homes
- Safe Communities
- Governance and Leadership.
Community members held the most positive views about healthy housing (including other infrastructure) and early childhood opportunities. Some of the greatest impacts perceived by community members were associated with new infrastructure such as housing, roads and public buildings that had enhanced communities. While some expressed concern about abuse and neglect of children, most community members indicated positive attitudes towards childcare.
The most negative perceptions expressed by community members related to inter-connected issues around substance use, health, violence and employment opportunities. Many community members expressed the opinion that many Indigenous people want to work, however the employment opportunities are simply not there. This issue was seen to lead to, or at least be closely linked to, substance abuse and violence.
Community members indicated mixed views about changes in the strength of leadership in their community. The reasons for this apparent division of opinion were not clear from the research. No clear pattern emerged when the opinions of men and women; older and younger people; and members of different sized communities were compared. It is likely that changes in the strength of leadership are simply something that is different across communities and dependant on specific local factors:
Since the LIP plan started there has been a lot of progress in the community. Male, middle aged, aware
More houses, more pay increase and more jobs for Aboriginal people. Aboriginal and non-Aboriginal people working together. Male, older, not aware
Early childhood
Community members were generally positive in their outlook on opportunities for young children. Almost all community members perceived that families think it is a good idea for children to go to preschool, and that in reality more young children are going to preschool compared with three years ago (Figure 4).
Figure 4.4 Preschool in the community
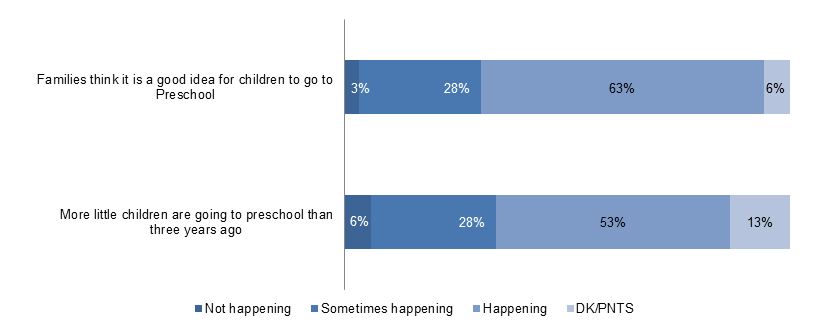
While issues around domestic violence and abuse were raised by some community members in the qualitative research, many were optimistic about the future for children in their community:
A lot of children born and a lot of families people starting to look after their kids. Male, middle aged, not aware
Schooling
Community members were also relatively optimistic about opportunities for older children. Most community members in the community research study were of the opinion that local schools are culturally friendly (53% happening, 28% sometimes happening), however fewer (though still the majority) were of the opinion that more children were going to school compared to three years ago (32% happening, 36% sometimes happening) (Figure 4.5).
Figure 4.5 School in the community
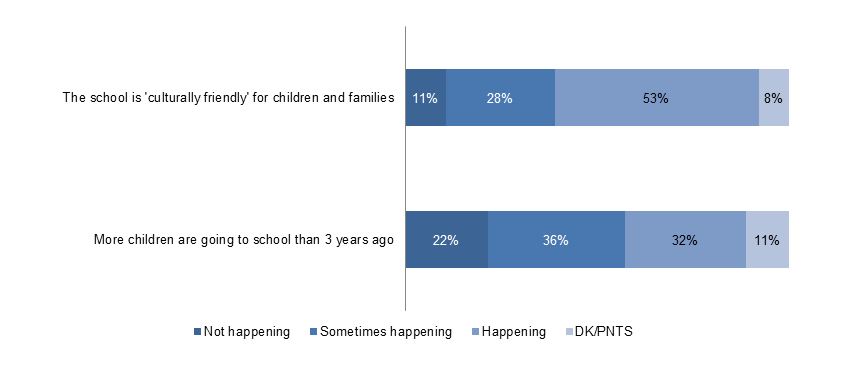
In the qualitative research, some community members held concerns over school attendance, others were more optimistic about education and training opportunities for older children:
(the community is on the way up because) student engagement with school, initiatives for training adults, technology educating and assisting. Female, older, not aware
Health
Compared with schooling and early childhood indicators, community members were less positive about health outcomes in their community (Figure 4.6). As shown in Figure 4.6, around six in ten community members were of the perception that the community had a good understanding as to why people should not drink alcohol, sniff petrol or smoke too much (31% happening, 32% sometimes happening). However fewer were of the opinion that people were actually drinking and smoking less. Men (35%) were more likely than women (27%) to say that there was more understanding about why people should not drink, sniff or smoke too much. \Women (46%) were more likely than men (39%) to say that that people were not smoking and drinking less than 3 years ago.
Figure 4.6 Health in the community
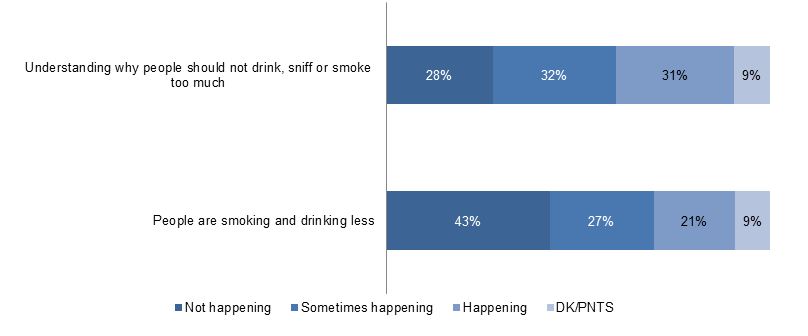
These substance-related issues were also evident in the qualitative data, with many community members commenting on the prevalence of excessive drinking and smoking:
Bad things people do is drinking and smoking more often and it is exposed to the children. Partying until late with music during the week. Female, younger, aware
Economic participation
Community members were very positive about attitudes towards economic participation, with almost all respondents stating that people in their community think it is a good idea to have a job (61% happening, 27% sometimes happening). This optimism was not, however, matched by perceptions of participation on the ground. Fewer (though still a majority) community members were of the opinion that more people have jobs compared with three years ago, with 39 per cent saying this is happening, and 26 per cent saying sometimes happening (Figure 4.7).
Women were more likely than men to say that more people had jobs compared to three years ago. In relation to age, older people (45 plus) were less likely to perceive that there were more jobs in their community.
Figure 4.7 Employment in the community
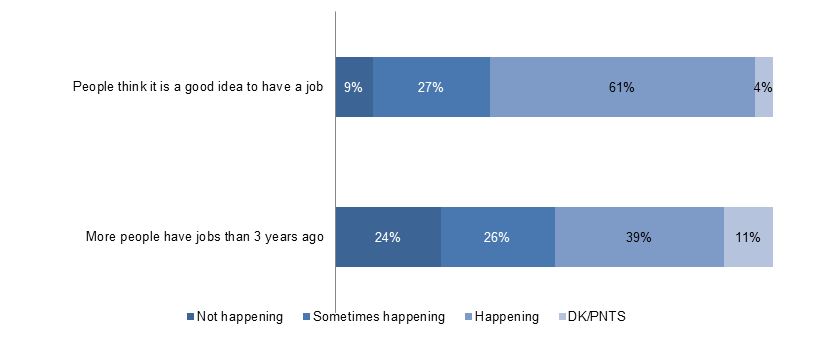
The lack of employment opportunities was expressed in the qualitative research by a number of community members, who often linked the lack of jobs to other issues such as drinking and violence:
Fighting needs to stop. People need more jobs. The people that work need to encourage those who are not working to look for employment. Female, younger, not aware
The qualitative data also show strongly that people believe that many jobs are given to outside people. They want locals to be trained so they have to skills and capacity to be employed in these local positions:
A commitment to an Indigenous workforce. That when we employ people we should have in mind is there a person who lives here who could do this role e.g. grading roads, reception at school or clinic. Always the spouses of service providers get jobs that should be for local people. Male, older, aware
Stop the fly in service providers [and] have permanent staff on the ground with local people career pathway to management. Train our locals who been in support positions for the last five years. Female, old, aware
Bring better training to the community and allow local people to work across services with confidence. Female, middle aged, aware
Healthy homes
Community members generally thought things were moving in the right direction in relation to healthy homes in their community (Figure 4.8). Almost all were of the opinion to some extent that people in their community think people are taking responsibility for their homes (42% happening, 45% sometimes happening). Most also think to some degree that houses are better looked after than they were three years ago (44% happening, 42% sometimes happening).
Figure 4.8 Housing in the community
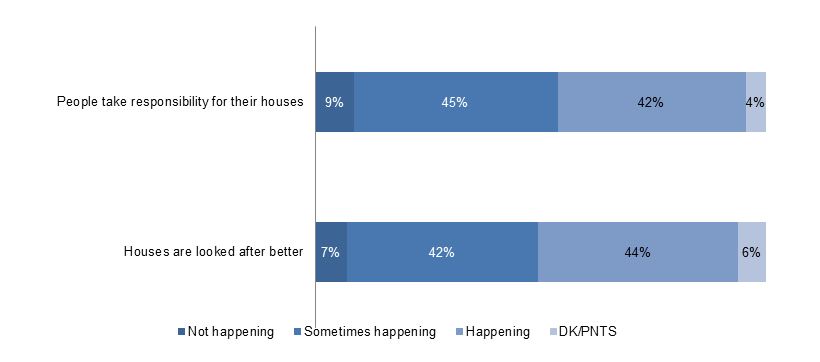
Improvements to housing and other infrastructure were among the most common themes expressed by community members when asked about improvements to their communities:
(The community is on the way up because) infrastructure and houses. Not as isolated, better roads. Female, older, aware
Some community members made a link between new housing and renovated housing and people taking better care of their houses. That is, people were more likely to look after a new house or a renovated house than they were one that was in a poor state of repair. This was clearly obvious by looking at the well-kept gardens and yards of people who were lucky enough to be living in new sub-divisions in some communities. However, this sometimes had spill over effects to people who were still living in overcrowded and/or poorly maintained housing. For example, in at least one community some people said that it had been a competition amongst people to see who could have the nicest looking back yard. Even people living in overcrowded and/or poorly maintained housing competed to improve the look of their houses and back yards.
Source: unpublished data
Safe communities
As shown in Figure 4.9, most community members indicated that people in their community think their community was a safe place to live (45% happening, 37% sometimes happening). A smaller proportion stated that the amount of fighting that took place in their community had declined in the last three years (34% happening, 32% sometimes happening).
Figure 4.9 Safety in the community
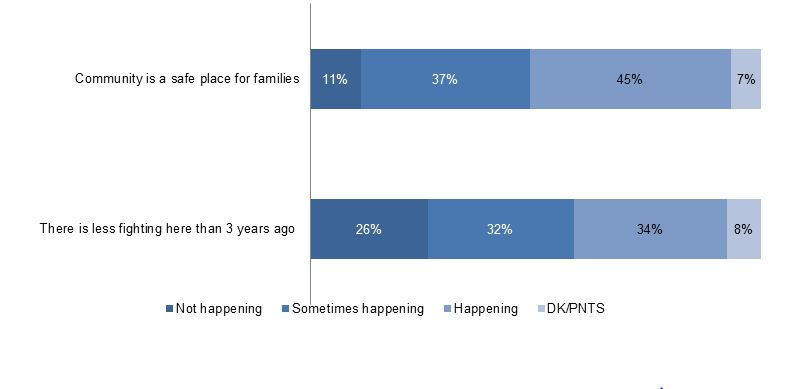
Concerns over fighting and domestic violence were also very prevalent in the views expressed by community members in the qualitative research:
Much more fighting here than there used to be. You see a fight every 3-4 days usually over money, women and gambling debts. Male, middle aged, not aware
Governance and leadership
Community members were divided in their opinions about changes in the strength and leadership in their communities. Similar proportions of community members (around a third) indicated that leadership had been strengthened in their community (35%) and that leadership had weakened (31%) see Figure 4.10.
Figure 4.10 Leadership in the community
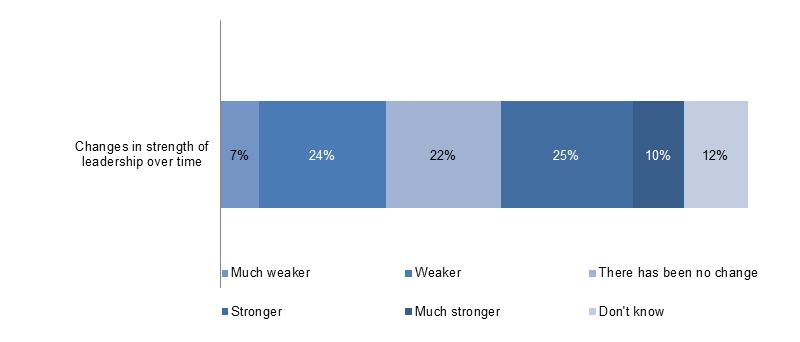
The nature of this division of opinion is not immediately clear from the quantitative research. No differences were apparent by age, gender or community size. It is most likely that the strength of leadership is something that varies community by community.
Positive and negative perceptions of local leadership were also apparent in the qualitative research:
There needs to be more recognition of local law and systems like the political organisation of the clans and authorities within those systems, the conventions and law. Male, younger, aware
(The community is on the way up because of) the strong council leaders and Elders. Female, middle aged, aware
4.6.4 What have we learnt from the initiative that can inform remote service delivery, community capacity building, and place based approaches?
The participatory qualitative research identifies challenges and areas that local people feel require improvement.
Strengthening the capacity of local people through education and relevant training was a consistent theme in the qualitative data. Some community members recognise that their local leaders need more training and support to help them engage more effectively with the government, advocate for their community needs and disseminate information back to the community members over the decisions that had been made:
What would make the working relationship between the government and the community better is practical things like more employment and TAFE courses, which would also motivate parents. There also needs to be new people on the (local leadership group). Female, older, not aware
There is a big gap between the LRG meetings and getting the message out to the people. Members of the LRG are not disseminating the information to their respective clan groups. They need more training and support. Female, younger, aware
More training for the local councillors so that they can understand government better and vice versa. Male, middle aged, aware
The government make all the decisions…they don't let us make the decisions even if they listen. Male, older, aware
A ‘same but different’ theme emerged at the pre-design workshop for the research project and resonated with the local researchers. The qualitative research captured the social and economic challenges that are similar in most communities in the study. However it also strongly included the diversity of historical legacy, clan and governance structures, and the complexity of local politics and personalities.
The concept of ‘same but different’ is an important consideration in the context of a place-based approach. A place-based approach may become a blanket approach if the government ignores diversity and makes policy with little flexibility to cater for differences across communities:
The government has its own agenda which seems to be about making all Australians the same rather than appreciating difference. The government does not seem to be interested in listening to Indigenous communities and addressing their unique needs. Female, older, not aware
There needs to be more recognition of local law and systems like the political organisation of the clans and authorities within those systems, the conventions and law associated with those systems like recognising that the Traditional Owners are the ultimate authority not the Local Reference Group. Male, younger, aware
Some community members in the study voiced their concern for the seemingly constant chopping and changing of government policy. This creates confusion, disillusionment and eventually wearies people. It also adds stress and strain to local politics and leadership tensions which fosters in-fighting about resources, money, leadership, and perceptions of corruption or favouritism:
People don't understand the new to them policies of the government. The government should be putting it in a way that people can understand and be able to digest what the government is saying. There seems to be lots of money spent on trying to make the community better but you can clearly see it’s not working. Female, young, not aware
The people need to stand up and have a voice. We need to not say yes when we don't understand what is being said… Male, older, not aware
Qualitative data also show that some community members think change needs to occur within the community and by the people. Some people are disappointed and impatient with the lack of progress in terms of behavioural change across a range of socially undesirable behaviours:
The community themselves need to work for themselves and the different clans need to bury arguments and get on. Lots of mix of clans now all related. One day it will be that we are all one clan. Female, middle aged, aware
I've lived here all my life and seen nothing change in this place. Only seen the new swimming pool, school, well-being centre, new police station. No change in behaviour, just buildings. Male, middle aged, not aware
Both the survey and qualitative data tell us that community members recognise there are far more services available now in community and the survey tells us people consider services to be more helpful than previously. The qualitative data show that the challenge now is around encouraging people to take advantage of these opportunities and use the new or improved services to help themselves and the community:
There needs to be a significant body of people who decide to claim life. To give up grog and drugs, to take responsibility for their own lives and claim happiness. If 20 people did that - everything could turn around… Female, older, not aware
4.7 Perceptions of change in the community and quality of life at the community and individual level
The survey asked respondents an open-ended question about what they saw as the three biggest changes in community. It also asked questions of whether people thought their community and their individual life were on the ‘way up’, ’way down’ or ‘no change’ and finally, what people thought is still needed for their community to improve.
4.7.1 Biggest changes that have occurred in the community
The overwhelming response to the open-ended question about the biggest change in the community was more houses or houses were fixed up (39%). Fifteen per cent mentioned improvements in infrastructure such as buildings, water, roads and sport facilities. Ten per cent mentioned more jobs and a further ten per cent mentioned more services for the people.
Then there was a plethora of other perceived changes including less drinking and/or the imposition of restrictions on alcohol, the community growing and more training:
More houses for the people and people looking after new houses. Nice lawns. Female, older, aware
We have a dam now so we have better water. Male, young, not aware
More young and old people being employed…getting jobs through employee services and Centrelink. Unknown
The whole community itself, the councils and chairperson get feedback from people around the community and discuss how the community can work better with everyone. The biggest change is there are more service providers coming into our community and introducing their workshops and helping people in their own ways. Female, young, not aware
People changed in a good way since the light beer came in. Some people don't even go to the pub anymore. Female, old, not aware
4.7.2 Community change
Half of all community members (50%) felt their community was on the way up or improving, while just over a quarter (27%) felt there had been no change. Only 11 per cent felt their community was on the way down or getting worse. A further 12 per cent of community members responded by saying they did not know how their community was travelling.
This is in line with earlier research where the same question has been asked. In the NTER evaluation quantitative survey 47 per cent of people said their community was on the way up, eight per cent said it was on the way down and 42 per cent said there was no change. In the Cape York Welfare Reform Evaluation 58 per cent of people said their community was on the way up, six per cent said it was on the way down and 36 per cent thought there had been no change.
In the current survey, community residents in small communities (64%) were more likely to say their community was on the way up than people in large (44%) or medium (40%) sized communities. The unemployed (31%) were more likely than the employed (23%) to feel that there had been no change in their community. This is in line with the findings of the NTER evaluation.
People were asked to elaborate on their answer to this question. Respondents who said that the community was on the way up mentioned housing, jobs, infrastructure, working together and more services:
School, airport, clinic, police station and jobs all getting better. More jobs and more people want jobs and a salary. Male, younger, not aware
We are trying to close the gap. We got lot of different service providers helping us. Female, middle aged, aware
People are respecting themselves and respecting the community more. People taking pride of their community. More young people doing a lot of training ready for a steady job. Female, younger, aware
Of those who had said the community was on the way down or there had been no change, common reasons were around: because people were still behaving the same as three years ago, alcohol/smoking and drugs, lack of support, poor school attendance, lack of training opportunities and lack of employment opportunities:
Everything is going back to the Stone Age. We not going forwards. Take the pub away like we are children…now we all going to court for drinking home brew. Male, middle aged, not aware
Nothing changing for us…no-one cares or comes to the outstations. Male, middle aged, not aware
People are still doing the same things every day. We are strong in our culture but we need jobs. Male, middle aged, aware
4.7.3 Individual change
At the individual level just over half of all community members (52%) felt their life was on the way up or improving, while just over a quarter (26%) felt there had been no change. Only six per cent felt their lives were on the way down or getting worse. The remaining community members responded by saying they did not know how to answer this question (16%).
This is lower than in the NTER evaluation research where 59 per cent of people said their life was on the way up, six per cent said their life was on the way down and 30 per cent said there was no change. In the Cape York Welfare Reform Evaluation 54 per cent of people said their life was on the way up, only two per cent said it was on the way down and 44 per cent thought there had been no change.
Those aged 18-29 years (61%) were more likely than the 30-44 (48%) or 45+ year (50%) age groups to feel that their lives were on the way up or improving. The employed (65%) were more likely than the unemployed (39%) to feel that their lives were on the way up or improving.
The main reasons that community members felt their lives were on the way up was because they had a job (22%) and because they loved the family, community and home and were hopeful of the future (19%).
Other key reasons why community members felt their lives were on the way up included: learning/improving their education, helping others, living arrangements, behaviour changes around alcohol and healthier lifestyle:
Easier to find work. Doing training that will help me find work. Houses are cleaner. Going out fishing more and hunting. Feels really good. Male, younger, not aware
I am taking the initiative and doing something for myself. I completed the literacy course and am now doing the post literacy course. Female, middle aged, not aware
Because I have looked at how I want my life to be for both myself and children and made this change by getting a job and taking the full responsibility of my children to have a better life. Female, younger, aware
My life better because I am proud of my people and the land and the land is so important. Such an important part of my life. Female, older, aware
Of those who said their lives were on the way down or there had been no change, lack of employment and training opportunities and poor health were the most commonly nominated reasons:
I've tried to get a job but there is not much support. The RJCP ask for all your experience and resume's and don't help us with getting those documents. Female, younger, not aware
If there was work my life would be better. If I could do more than two days RJCP it would keep me off the grog a bit. When I am working I feel better about myself…I enjoy it…being with my mates at work. Male, middle aged, not aware
While for many people their housing situation has improved, some are still waiting. Unknown
Trying my best. I can't wait to get my own home and then I'll know my children are safe. There is a lot of family in one house. Female, middle aged, not aware
4.7.4 Changes needed for community improvement
The responses to the final open-ended survey question focusing on the three most important changes to make their community a better place to live showed that while people in communities have identified progress in their community in the form of housing, employment, more services and so on, these same areas are also nominated for further change and improvement.
A third of community members (33%) mentioned more jobs/relevant training and economic development. Just over a fifth mentioned more sport/recreation/activities and services for youth (22%) or more services/programs/support (22%). Other priorities included:
- need more houses/houses fixed up (19%)
- kids need to be in school/ improve education (17%)
- stop the alcohol/drugs/kava/violence/gambling (17%)
- improve roads /rubbish/sport facilities/infrastructure (17%)
- keep culture strong/more cultural activities/cultural awareness (9%)
- everyone working together (8%)
- better communication (6%)
- more respect (5%).
A recognition that positive change for the community needs to involve the community and individuals can be seen in many comments that were collected through the survey in relation to this question.
There needs to be a change in attitude towards participating towards the greater good of the community. We need a clear vision of what's in the future for us and our families. Got to get critical mass in work and activities. Investment in business and housing and construction. Need a much bigger scale of investment to create industry that has potential to employ that critical mass. Male, older, aware
Teaching young ones culture like how to make spears and dance. This will teach them respect and to listen to orders. Having more things to do for kids like sport and rec and youth activities. Give young ones skills like teach them how to work in nursery and grow vegetables. Unknown
Children need to go to school and get an education. The lost generations who missed out on education also need to get adult education. Female, middle aged, aware
Stop alcohol and drugs coming in the community, people need to be educated more on what it does to them and their families. Male, younger, aware
Making a home safe for our kids and our community too! Safer, stronger community needs to be promoted through having more positive family activities and linking our kids and Elders together on country! Respect, resilience and responsibility. Male, older, not aware
4.8 Relationship between personal circumstance and survey responses
Multivariate analyses were conducted to identify which attributes of respondents characterise those who view the outcomes of the NPA RSD as more positive. The attributes analysed were:
- age
- gender
- employment status
- community size
- governance knowledge
- perceived quality of community leadership and its improvement
- perceived quality of government involvement.
The outcomes analysed were: quality of aspects of community life, improvement in aspects of community life, improvement in agency helpfulness, and overall improvement in community and individual life.
One constraint of multivariate techniques is that they can only be used on data where every case has a usable value or score for every variable. For the present data, many respondents answered ‘don’t know’ or ‘prefer not to answer’ to at least one question. These respondents were excluded and as a result, the sample size was reduced from 726 to 202 cases for the multivariate analyses. The analyses suggested the following:
- Community members with more ‘positive appraisals of aspects of community life’ tend to be male, to live in a larger community, to have less governance knowledge and more positive perceptions of the quality of their community leaders.
- More ‘positive appraisals of community improvement’ in the last three years appear to be more likely in community members who are older, have less knowledge of governance and more positive perceptions of community leadership.
- Community members who ‘believe that agencies have become more helpful’ in the last three years tend to live in smaller communities, to have less governance knowledge and more positive views of the government’s role.
- Those ‘who see their community as on the way up’ tend to live in smaller communities and to have better perceptions of their community leaders.
- Finally, respondents who see their own lives as on the way up are more likely to be employed and to have greater knowledge of governance.
5 Stakeholder interviews
O'Brien Rich Research Group
This chapter discusses key stakeholder perceptions on the progress of National Partnership Agreement on Remote Service Delivery (NPA RSD) towards its objectives. The research was undertaken during April and May 2013. This chapter was prepared by the Directors of O’Brien Rich Research Group, Karen Rich and Clare O’Brien, and includes information provided by Michael Limerick of Limerick and Associates on New South Wales (NSW) and Queensland (Qld) stakeholder perceptions.
Note that the views of remote service delivery (RSD) Indigenous community members were not sought unless they were directly involved in its delivery, for example, as representatives of the Local Reference Group (LRG) or service delivery personnel. Community observations of the RSD are in Chapter 4.
The chapter is organised into nine main sections. Sections 5.1 to 5.3 provide background to the stakeholder interviews; Section 5.4 provides some context and historical perspective on RSD; Section 5.5 examines service coordination and the Single Government Interface; Section 5.6 discusses stakeholder perceptions of enhancements to services and infrastructure in communities; Section 5.7 examines community engagement; and 5.8 community governance and leadership. The final section, 5.9 presents some lessons learned.
5.1 Background to key stakeholder interviews
The key stakeholder component of the evaluation is intended to test the progress towards achievement of the NPA RSD objectives by obtaining the views of informed stakeholders at all levels of involvement in the delivery of the NPA RSD. Interviews focused on stakeholder views of the NPA RSD strategy and its implementation in alignment with the evaluation themes. As there was considerable interest in the early days of implementation, stakeholders with knowledge of the formation of the NPA RSD as well as those currently implementing it in communities were included. A series of semi-structured discussion guides were developed to cover the wide range of informants; a copy of the core discussion guide used in the interviews is included at Appendix L
The logic frame for the evaluation describes three broad sectors where the NPA RSD will make a difference - governments, service systems and communities. The actions and outputs leading to stated objectives and outcomes of the NPA RSD are depicted along a continuum ranging from early on, to near the end of the NPA RSD.[260]
Improved coordination and collaboration between governments, and engagement between governments and communities were expected to occur early on in the NPA RSD. Increases in the range, appropriateness and use of service systems were expected to occur within two to three years, while increased social and economic participation and changes to personal responsibility and social norms at the community level are expected to occur within four to six years of the NPA RSD.
The key questions for stakeholders focused on:
- whether services have improved or changed
- if different levels of government are better at coordinating service delivery
- whether government is getting better at engaging and working with communities
- whether communities are getting better at working with government
- what has been learned from the RSD and what can be improved.
5.2 Research methodology
The methodology was designed to capture sufficient information to provide an overall perspective of progress towards the goals of the NPA RSD. To ensure that all stakeholder groups were covered in the interviews there were two separate but interrelated components:
- community visits over a minimum of two days
- face-to-face or telephone interviews with key stakeholders at regional, state/territory and national level.
O’Brien Rich Research Group team members were involved in all five jurisdictions. Dr Michael Limerick led the Qld and NSW stakeholder discussions.
Every attempt was made to obtain an historical understanding of the NPA RSD implementation in each jurisdiction, however, in general, there has been quite a high level of staff turnover, requiring the identification and contact of people no longer working in the area. Consequently, a fulsome history was at times impossible to achieve. The high level of staff turnover also meant that quite a number of stakeholders involved in the community visits had not been in their positions long enough to provide meaningful comments on the overall changes that RSD has delivered.
Individual interviews were conducted with 186 stakeholders involved in RSD, as indicated in Table 5.1 below. Group discussions in NSW, Qld and Western Australia (WA) involved an additional 21 stakeholders, bringing the total number of participating stakeholders to 207. The research has captured a wide variety of perspectives, including Australian Government, state/territory government, and non-government stakeholders, those based in communities, at a regional or state level, and Canberra.
Table 5.1 Stakeholders by type
|
|
Northern Territory |
Queensland |
Western Australia |
South Australia |
New |
Australian Capital Territory |
Total |
|---|---|---|---|---|---|---|---|
|
Community based |
|
|
|
|
|
|
|
|
Government service providers |
15 |
6 |
4 |
3 |
6 |
|
34 |
|
Non-government service providers |
10 |
7 |
12 |
2 |
3 |
|
34 |
|
GBM / IEO |
8 |
1 |
3 |
1 |
|
|
13 |
|
Other (incl. council & Indigenous organisation reps) |
3 |
7 |
4 |
4 |
6 |
|
24 |
|
Regionally based |
|
|
|
|
|
|
|
|
ROC / ICC staff |
7 |
6 |
3 |
4 |
3 |
|
23 |
|
Service providers / coordinators (Australian & state government) |
|
9 |
4 |
|
7 |
|
20 |
|
Other (incl. NGO, local government) |
3 |
|
|
2 |
5 |
|
10 |
|
State based |
|
|
|
|
|
|
|
|
Managers / coordinators in capital cities |
6 |
3 |
1 |
4 |
1 |
|
15 |
|
Australian government |
|
|
|
|
|
13 |
13 |
|
Total |
52 |
39 |
31 |
20 |
31 |
13 |
186 |
5.2.1 Fieldwork and analysis methods
A team of senior evaluators with significant experience in conducting research with remote Indigenous communities undertook the fieldwork and analysis. Each researcher was involved in at least two community fieldwork visits, allowing for a more comprehensive understanding of the place-based differences and providing the ability to compare and contrast stakeholder perceptions of RSD delivery mechanisms in different communities.
All data was captured through audio recording or detailed note taking. Key findings and issues were discussed and reflected upon during the fieldwork process. In the preparation of this chapter the fieldwork information collected from all community visits and stakeholder interviews was analysed to identify overall findings and themes. Key findings and themes were subsequently crosschecked with team members for validation.
5.2.2 Community visits
A series of twelve community visits were undertaken in the five jurisdictions. The table below shows the communities that were visited.
Table 5.2 Stakeholder communities visited
|
State |
Community |
|---|---|
|
Northern Territory |
Galiwin’ku, Maningrida, Numbulwar and Ntaria (Hermannsburg) |
|
Queensland |
Doomadgee and Mornington Island |
|
Western Australia |
Fitzroy Crossing and surrounding communities and Bardi Jawi communities |
|
South Australia |
Amata and Mimili |
|
New South Wales |
Walgett and Wilcannia |
5.2.3 Stakeholder interviews
Face-to-face or telephone interviews were undertaken with key stakeholders who were not based in communities but who were currently or had previously been involved with the implementation of RSD.
5.2.4 Notes/caveats
As with any research there are a number of caveats to note. In particular, it is important to note that it is still too early to gauge some of the anticipated outcomes of RSD. The scope of RSD is very large and the change in communities and service providers that it seeks to facilitate are also large. As indicated in the evaluation logic frame (Chapter 2.Section 2.7.1) certain changes are expected to be some years away.
Additionally, significant change in behaviours on the part of service providers and government officials is required through RSD. These in turn require changes in behaviour and attitude for staff working in direct service delivery as well as for community members accessing these services. Change is likely to take time, and delays are to be expected as part of that change.
It is also important to remember that the views discussed are those of key stakeholders who are part of the RSD system, service providers and peak Indigenous bodies. In the stakeholder interviews Indigenous community input was limited to the LRG chairs and service providers who are also Indigenous community members in the visited communities. Indigenous community observations of the RSD are provided in Chapter 4.
Sample of communities
The 29 RSD sites, although alike in their remoteness, also have distinct differences, such as the history of the communities, distance from nearest town, access in all seasons/weather, and governance capacity. Although the twelve community visits undertaken for this component of the evaluation is quite a large sample (41%) of the 29 RSD sites, it is unlikely that what is described in this chapter will have full resonance for every site.
Untangling RSD from other initiatives
Many stakeholders expressed difficulty in identifying the impact of RSD as distinct from other preceding or co-existing initiatives. Evaluating any place-based initiative is challenging, as it can be difficult to link an intervention to specific outcomes. As indicated in Chapter 2.6, in some cases multiple interventions have operated across the same geographic area over several years. Examples include the Northern Territory Emergency Response, Cape York Welfare Reform Trial, Regional Partnership Agreements in the Groote Eylandt and Murdi Paaki regions, other Council of Australian Government National Partnership Agreements (e.g. Stronger Futures in the Northern Territory) as well as other state/territory program initiatives. Other factors include contextual variables such as population mobility.
Interpreting the information presented in this chapter
The information presented in this chapter is qualitative in nature. It describes the range of perspectives on the RSD offered by those who have been involved with the RSD, whether at the policy / design level or in implementation. The analysis does not seek to quantify how many people held a particular view, but to bring to light the most important issues as seen by key stakeholders, and in so doing to help to illuminate the most significant challenges and achievements of the RSD. In this chapter the authors use the terms ‘many’ and ‘some’ to provide the reader with a broad sense of how widespread a particular point of view was, as well as to describe the diversity of views.
It was not the purpose of this research to compare experiences and attitudes among jurisdictions, among communities, between levels of government, or between government and non-government stakeholders, but to identify themes at an overall level. The sample of interviewees selected by the Department was designed to capture as wide a range of views as possible, so while the number of stakeholders interviewed is large overall, the number of stakeholders in each ‘category’ of stakeholder is relatively small and could not be considered to be representative of all stakeholders in that category (as shown in Table 5.1 above). Thus the analysis provides a ‘big picture’ perspective and does not separate the views of particular groups.
5.3 The range of opinions
During the research process it was obvious that there was a wide diversity of experiences and opinions. The extent to which any interviewee can observe the whole implementation process is limited by the position held in the process. As well, the expectations for what RSD can deliver are also coloured by an individual’s knowledge of what is possible in terms of cost, necessary pre-planning, and time needed for delivery. Hence, the range of opinions about the implementation and progress of RSD appear to be influenced by four main factors, as indicated in the diagram below.
Figure 5.1 Factors influencing opinions about the RSD
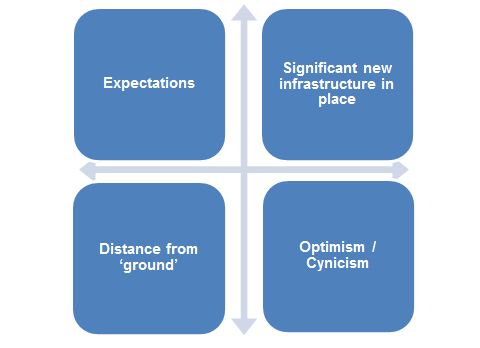
Generally speaking, where there were high expectations from RSD and not everything had yet been delivered, people were less positive about its progress. Interviewees willingly acknowledged that some infrastructure had been delivered, or some things had improved, for example, more services being delivered or better coordinated, but their high expectations seemed to indicate that they were more concerned about what was not done, as opposed to what had been done.
Where substantial new infrastructure had been put in place, for example a large number of houses, people were more willing to recognise that RSD had delivered some benefits. In places where infrastructure was still coming, people were less positive.
Those who delivered services ‘on the ground’ appeared to be more focused on the problems that still existed. For example, acknowledgement might be made about new services in place, but there was a tendency to suggest that the fundamental problems had not yet been fully addressed - ‘there’s still a lot of gambling in this community. Things can’t get better till that’s addressed’.
Some people, who had been working in the Indigenous area for a long time had a relatively cynical attitude to change. They had seen government initiatives come and go in the past, were keenly aware of the complexity of the challenges faced by remote Indigenous communities, and were disinclined to believe that RSD would bring about fundamental change: ‘It hasn’t changed, things are still not good in this community’. These views tended to be more prevalent among those stakeholders who were working in Indigenous communities, and who had a more direct view of the difficulties on a day‑to‑day basis.
5.3.1 The context of stakeholder views
It is important to bear in mind that in asking questions about government service standards in any Australian town or community, there will be a tendency for people to focus on gaps and areas for improvement. Similarly, coordination of government services is likely to be seen as needing improvement in any context. It can often be easier to point out problems rather than acknowledge successes.
5.4 What is RSD?
This section discusses the RSD objectives and the context in which it was set up, to provide some background to understanding the ways in which different stakeholders perceive the progress, strengths and weaknesses of RSD itself. Except where otherwise indicated the authors have used the acronym ‘RSD’ to refer to the initiative as a whole - that is, the objectives and principles as set out in the NPA RSD as well as ‘nuts and bolts’ of the RSD initiative. With only a few exceptions, the majority of stakeholders did not make a distinction between the NPA RSD and the RSD model, but simply spoke of ‘the RSD’.
5.4.1 Context
In discussing the context of the RSD conception, this section draws primarily on the perspectives of senior government officers who had been involved with RSD from its early days and who were able to offer an historical perspective on the thinking behind its design and the manner in which it has evolved.
The initial thinking behind the RSD was that the level of services and infrastructure in remote Indigenous communities fell well short of what could be expected in other regional and remote locations in Australia, and that addressing these gaps in services was both necessary in itself and would lead to an improvement in outcomes for Indigenous peoples.
An important aspect of the RSD approach in its policy development stage was a strong emphasis on better engagement with communities. Policy makers were conscious of the negative reactions from communities to the Northern Territory Emergency Response (NTER). The evaluation of the NTER found that lack of consultation and the blanket imposition of specific initiatives on communities attracted criticism, even when the initiatives were seen as having value.[261] These responses from communities influenced a determination by government not to repeat a process that left communities feeling taken over and disempowered. Thus, the underlying philosophy of the RSD was that government should work in partnership with communities, rather than be doing things to or for communities.
5.4.2 A confused starting point - getting the narrative right
It is evident from the stakeholder interviews that there are differing interpretations of what the RSD is and what it is trying to achieve. This confused starting point appears to have its origins in the NPA RSD:
People came to the table with different views. Everyone agreed (to the NPA) but in their heads they signed up to a different thing. Senior government officer
The NPA RSD sets out five objectives, three of which relate to service delivery:
- to improve the access of Indigenous families to a full range of suitable and culturally inclusive services
- to provide simpler access and better coordinated government services for Indigenous people in identified communities
- to raise the standard and range of services delivered to Indigenous families to be broadly consistent with those provided to other Australians in similar sized and located communities.
The remaining two objectives relate to improved governance, and increased social and economic participation:
- to improve the level of governance and leadership within Indigenous communities and Indigenous community organisations
- to increase economic and social participation wherever possible, and promote personal responsibility, engagement and behaviours consistent with positive social norms.
The latter two objectives are often explicit or implicit objectives in initiatives targeting Indigenous communities. They are much more challenging areas for government to address than improving service delivery. It is difficult to know to what extent the RSD was ever intended to address these objectives explicitly, nor is it clear how the RSD was expected to advance them. If the authors of the NPA RSD thought there was a relationship between enhanced services, and improving governance and social and economic participation, these relationships have not been clearly articulated. Furthermore, it is arguable (and some stakeholders have noted this) that there are tensions between the objectives. Increased government efforts towards enhancing services may have the unintended consequence of disempowering communities and decreasing levels of personal responsibility, depending on how the services are implemented.
Given the strong emphasis on service improvement in the NPA RSD, and the lack of clarity about RSDs intended impact on the other, highly ambitious and long-term objectives, the major focus in the implementation of the RSD initiative has been on improved service delivery.
5.4.3 Tension between community engagement and early ‘runs on the board’
Senior state and Australian government officials have suggested that from the very beginning there was a tension between the strong need for engagement with communities as outlined in the Service delivery principles for programs and services for Indigenous Australians[262] and the push to get infrastructure and services in place quickly - to get the runs on the board. This is understandable: those stakeholders who were very aware of community frustration with being over-consulted and seeing no result, were keen to be able to point to achievements; while those stakeholders who were most concerned about engagement, particularly working on community governance and capacity building aspects, were frustrated by the seemingly sudden imposition of strict deadlines for action.
This tension between engagement and action, and the challenge for government in facilitating the appropriate amount of engagement has been documented elsewhere. For example, the NTER evaluation found that communities reported being over consulted in some areas, but insufficiently engaged on other matters;[263] the NTER Review Board reported that ‘communities continue to struggle under an ever increasing demand for meetings with unfamiliar faces representing government and NGO providers’.[264]
Many stakeholders, including government officers at Australian, state and regional levels, believe that RSD has essentially become a top-down process, and that the original idea of a genuine partnership with communities was over-ridden in a drive to implement and improve services. This has been a significant source of irritation for those stakeholders who believe that community engagement should have been paramount and it negatively colours the perceptions of these stakeholders as to the progress and success of RSD itself.
5.4.4 Ambitious objectives
There was a sense from some stakeholders that the NPA RSD objectives were overly ambitious and had not been properly thought through, nor had sufficient thought gone into how these objectives would be achieved. In particular, the five-year timeframe for the NPA RSD was considered to be at odds with at least some of the objectives, which required a much longer time frame:
We set the NPA up as though it was going to run for 20 years. It was too ambitious. If you’re going to put words on paper then you need to say something about how it will actually be happening. Senior government officer
The National Partnership Agreement is a five year agreement but it combines long-term aspirational and short-term goals. This has made it hard to pin down the parameters. Senior government officer
5.4.5 The focus on 29 communities
Some senior government officers have suggested that a focus on 29 communities was problematic from the start. While acknowledging the reality of funding constraints, and noting the inherent dilemma in choosing to make a difference in a small number of sites rather than spreading the resources too thinly across a much larger area, some stakeholders thought it was difficult to justify the inclusion and exclusion of particular communities.
Government stakeholders in some jurisdictions pointed out that the selection of specific sites had created tensions between government and community, as well as among communities, and that this had affected perceptions of RSD and hampered efforts to build a shared understanding of what the government was trying to achieve:
I don’t understand the rationale for picking (communities). I think the messaging about what RSD is was unclear. I am still unsure at this point about what they were doing and why they were doing it. Aboriginal organisation representative
We never got over the dilemma of a focus on specific communities - we never got the narrative right. So we’ve been on the back foot from the start. Senior government officer
The differing responses to the fundamental question ‘What is RSD?’ has been a driving force in its implementation and should be seen as a pervasive aspect in stakeholder views of the progress of RSD to date.
5.5 Improving service coordination
The RSD is based on the premise that its goals will not be achieved without inter-agency collaboration and coordination. Coordinating services can reduce complexity, enhance service quality and provide a foundation to deliver achievable outcomes to users. In this context, service coordination can be defined as a method ‘…to improve the connections between services or between people and services in order to improve outcomes for individuals, families, communities and societies’.[265] Coordination in this sense can be seen as a continuum from creating simple linkages to full integration, where discrete services cease to exist and are replaced by a new service, unit or program. The types of coordination activity relevant to RSD are:
- Linkage - relatively minor degree of connectivity, with services remaining discrete entities and largely continuing to operate as usual but with improved linkages to other services. Initiatives could include increasing staff knowledge of the range of services available so that they can appropriately refer people when particular needs are identified, or improving the availability of information for community members about services they can access.
- Coordination - services continue to remain discrete but they participate together in a structured and planned manner. For example, information is shared systematically and referral protocols or pathways are implemented and carefully managed. Designated co-ordinators may be established to ensure people are able to access services, and participating services are clear about each other’s responsibilities. Service gaps are identified and addressed, as are duplications or inconsistencies.[266]
Coordination is important for all phases and at all levels of RSD service delivery, from policy development through to planning and implementing service delivery. The most obvious apparatus of coordination for RSD is the Single Government Interface.
5.5.1 The Single Government Interface
The NPA RSD established a Single Government Interface (SGI) in each of the RSD communities to improve coordination of government services and to simplify interaction between communities and government agencies. Government Business Mangers (GBMs) and Indigenous Engagement Officers (IEOs) are based in the community, supported by Regional Operations Centres (ROCs) at the regional level.
5.5.2 The Regional Operations Centre
In the RSD model it is intended that the ROCs provide whole-of-government leadership and coordination at the regional level, and support the work of the GBM and IEO in communities. The ROCs, as they were originally set up, involved Australian and state/territory government staff working together and reporting to a Board of Management (BOM) in each jurisdiction. In short, the ROCs were the designated coordinators as defined in coordination above.
The importance of a clear mandate
In most jurisdictions stakeholders have indicated positive changes in relationships across levels of governments and agencies, which they attribute to the NPA and the mandate this provided. These stakeholders believed that the RSD created a space for people to step outside their usual ways of operating through a shared commitment to improving the ways services are delivered in communities. The ROCs and BOMs have played a significant role in forging these cross agency relationships. In NSW a strong mandate did not appear to be evident from the outset, and some stakeholders said this was a key factor in RSD never gaining traction in those sites.
Changes over time
In the early implementation of RSD, FaHCSIA and state/territory government staff were co-located in the ROCs in order to facilitate collaboration and cooperation between governments. Over time this setup has changed, with different arrangements being set up in some states – a natural progression in any place based initiative.
In the Northern Territory (NT), the two levels of government staff are no longer co-located, although officers who had been working in the ROC maintain collaborative working relationships. The GBMs and IEOs no longer report to ROC staff but are now supported and managed through the ICCs. Some stakeholders in the NT saw the change as positive as they felt the ICCs had for the most part, a good knowledge of the history of their communities and a deeper of understanding of their particular needs and ways of operating:
It was a good thing moving the GBMs to the ICCs. They are the ones who have the best line of sight to the community. To tell you the truth I think it should have been done a good 12 months earlier. Government service provider
In South Australia (SA) the RSD ROC has been renamed the Anangu Pitjantjara Yankunytjatjara Lands (APY Lands) Regional Operations Centre, and the focus has broadened from the two RSD communities, Amata and Mimili, to the whole of the APY Lands. This development was due to the recognition that government couldn’t effectively focus on two communities in isolation of broader issues across the region. Government officials commented that the ROC had played an important role in bringing state and Australian government bureaucrats closer together.
In WA, the ROC is based in Broome, which is a hub town for its RSD communities and service providers in the Kimberley region. It is co-managed between Australian and state government officers and underpins a successful SGI. Similarly each RSD site’s Local Operations Centre was established with both Australian and state government funded staff to represent the SGI at a community level. This ROC arrangement has stayed much the same as during its implementation phase.
In Qld the ROC remains as it was set up during the implementation phase. The ROC convened a Regional Leadership Group that met regularly in the early stages of RSD implementation but has not met regularly in the past 18 months. Changes in responsibilities and priorities within the Qld government may be a factor in this. Some stakeholders commented on the positive strategic role played by the ROC in bringing agencies together for the purposes of joint planning and coordination of activities.
In NSW the recurring theme from stakeholders was that the very high level of staff turnover and changes in the organisation since RSD’s inception had heavily impacted on the ability of ROC staff to undertake their role:
We’ve done the LIP and all this but then someone else comes on and reworks it but none of that stuff actually happened. A lot of the problem was government people coming and going - the turnover. Community Working Party representative
In general, stakeholders were of the view that Australian government agencies were more likely to see the ROC as a Single Government Interface than state agencies were. There was widespread recognition by all stakeholders that many service providers work in isolation from the ROC structures and that the GBM is, for most service providers, the face of the Single Government Interface.
Coordination today
Despite an acknowledgement of collaborative efforts in the implementation phase, there was a sense amongst stakeholders that the level of coordination and cooperation between levels of governments had waned over time:
There’s definitely been a change. We are getting a sense that the level of commitment is not there any more. Government manager
Some senior government bureaucrats considered that the existence of the ROCs had enhanced understanding of the agendas of each other and increased cooperative dialogue in the longer term. These people were strongly of the view that although the co-location of officers had ceased there was still a good level of cooperation, within the confines of what was possible in the existing political context of their state:
Since RSD I am completely confident that I can pick up the phone and talk to my state counterparts. We can talk openly about what’s going on and can talk more confidently about each other’s constraints and policy agendas. Senior government officer
In the eyes of many stakeholders, the ROCs have moved backward on the coordination continuum from undertaking coordination activities back to maintaining linkages, that is, to a relatively minor degree of connectivity.
5.5.3 Community based SGI staff
There was a widespread view amongst stakeholders of the value of the GBM and IEO positions; indeed many considered them to be the most valuable part of the RSD initiative. Many emphasised the importance of teamwork, noting that it was the combination of these two roles that was vital in facilitating communication between government and community. As one senior government officer noted:
The GBM and IEO positions have been the big success of the whole RSD initiative. If we retain nothing else we should retain those positions. Senior government officer
There were some who thought that the positions had failed to achieve the intended impact, largely because of high staff turnover or instances when an individual GBM or IEO were considered to be unsuitable for the position in their community. Even these stakeholders, however, were generally favourable towards the concepts of a GBM and IEO.
5.5.4 The GBM position
Under the NPA RSD the key role of the GBM is to coordinate service delivery between agencies and the community. GBMs, in partnership with the IEOs, provide a direct link between the community and government. Overall, stakeholders believe the GBM role is essential to improving service coordination in communities.
As indicated above, a consistent theme from the stakeholder interviews was that these positions were a good concept. However, the extent to which they achieved the intended impact was due to a combination of issues including having the right person employed, clarity about the nature of the role and a clear mandate and authority to carry out the role.
Government and non-government service providers saw the GBM as the central point for coordination and a repository of information about services and programs in the community. As one government service provider noted:
If I need information about who’s doing what, who’s in the community on what days, or who I should talk to in relation to a particular issue, I go to (GBM). Service provider
Some saw the GBM role as a mechanism for keeping service providers accountable. However this view tended to be tempered with recognition that the GBM is effectively powerless in directing the activities of another agency and that if individuals had a silo mentality (and apparently many still do) then there was not much the GBM could do.
Lack of clarity in role definition
The role of the GBM is a challenging and complex one, and it is worth noting that there are differing expectations and interpretations of the role amongst stakeholders.
Many stakeholders, including those based in community and at state and regional level, pointed out that there has been a reasonable amount of latitude in what might be seen as the key functions of the GBM. While a certain amount of flexibility is seen as being important to take account of jurisdictional and community level differences; as the face of RSD in the community, these stakeholders saw the primary role of the GBM as needing to be closely aligned with the key RSD objectives:
The interpretation of the GBM role differs from person to person. They struggle with pull from community, to do things such as organise funerals - which should be outside their responsibility. It’s a struggle to say no because they do have to build relations with the local community. Their role is ambiguous. ROC officer
I don’t think it was ever clear for the GBM positions what they were meant to do and how they were going to do it. Aboriginal organisation representative
Some stakeholders attributed role confusion to a lack of proper planning and preparation during the early days of implementation:
They also need some really clear direction - they were just chucked there and told, ‘Here, fix this’. Aboriginal organisation representative
Some thought the primary role of the GBM was about communication and relationship building on the ground: both among agencies; and between community and government:
You’ve got to have the ability to get people working together. ROC officer
Others saw the GBM as being a more active agent of change who could identify community issues and promote solutions through their understanding of government programs and funding opportunities:
They need to be able to gather intelligence from the community, to understand the issues from a community perspective, and then be able to facilitate more strategic and joined up solutions to problems. Government officer
Some stakeholders saw the GBM as the person who had ‘hard discussions’ with the community, particularly around expectations of the role of government and what it could and couldn’t do for the community:
It’s an educative role and sometimes it might involve some straight and firm talking – trying to lead people to action and ownership of their responsibilities. They need to get alongside the community, but not to always take on their causes and accept the flak thrown at government. Government officer
The right person for the job
There was a widespread view that the value and effectiveness of the GBM role is highly dependent on the individual in that position:
If the right person is in the job, there is great potential for that person to appropriately engage and enable service linkage and coordination. NGO service manager
Many stakeholders emphasised good communication and relationship management skills, with one senior official suggesting that these skills should be primary selection criteria:
We tried to find people with the right philosophy and good communication skills. They should be communicators first, then project designers second. Our philosophy is that you won’t change anything without good communication, being able to manage relationships. Senior government officer
Authority of the position
Stakeholders from several jurisdictions raised the issue of seniority of position, and in particular the GBMs lack of ability to make any decisions around expenditure, needing to always refer decisions up the line even for relatively small issues.
The apparent inability to make things happen on the ground was seen not only as a source of frustration, but also as undermining any message that the government was trying to send about doing things differently in communities:
When the GBM first came to (community), we thought the RSD would be good. The Community Working Party was optimistic. Having senior people on the ground sounded like a good idea. But that has all changed. Community representative
Others raised the issue of seniority in the context of the need for ‘hard discussions’ between government and community about expectations about responsibilities. Whilst some saw this as the role of the GBM, others felt strongly that such discussions ought to involve public servants at much higher levels who could speak with authority.
Support needs
Several stakeholders noted that the GBM position is unique within the public sector. It can be a very isolating position and there is a strong need for adequate support. One senior government officer suggested mentoring opportunities to offer confidential, non-judgemental but informed support and guidance.
Another stakeholder noted:
It’s a very difficult job, and I think we give them too much latitude in how they interpret their position. We need to define their positions more clearly, provide them with coaching and better support. Former ROC officer
Those GBMs who felt that they had a high level of support from their regional management and coordination areas (ROCs or ICCs) found that they were better able to fulfil their role effectively.
Comments made during the interviews suggest there could be better ways of harnessing the knowledge and experience of the more effective, experienced GBMs as well as the ROC or ICC officers who support them, and sharing those learnings across jurisdictions. One ROC officer expressed frustration at not being able to get support from another jurisdiction with more experience in the role in the early days of formulating position descriptions for the GBM. He felt that they were unnecessarily starting from scratch, which made the whole implementation process more difficult and time consuming than it should have been.
The importance of stability and consistency
In the past most GBMs appear to have been limited to short, 12 month contracts, though they have been regularly renewed. As noted in the NTER evaluation, the intention in the NT was to rotate GBMs regularly to help them maintain independence and objectivity when dealing with communities. In the NT a process is underway to make the positions permanent. Many stakeholders were of the opinion that a year is insufficient time for a GBM to live and work in a community. This is because it takes time to establish relationships and to gain the trust of community members. Several stakeholders commented that short-term contracts were incompatible with the nature of change that is being sought from RSD. This observation is consistent with findings from the NTER evaluation, which identified high GBM turnover as being particularly difficult for communities.[267] Some stakeholders in WA pointed out that their intention was to maintain stability in their personnel rather than emphasise rotation and they appear to have had some success with this approach.
Some communities have experienced very high turnover in the GBM position, and have had extended periods where the positions have been vacant. Many factors have played a role here; but the difficulty of the job has been a significant contributor. A lack of clarity around key functions and the skills and attributes required to do the job effectively have also been factors in some jurisdictions. Lack of accommodation for family members was also mentioned by GBMs and other stakeholders as either a difficulty or a reason for not wanting to stay long in the position. Given the centrality of the GBM role a high level of staff turnover has diminished the opportunities for RSD to achieve any traction in several of the RSD communities:
There were four GBMs before me, which has created difficulties with community engagement and trust. Also, coordination has been difficult to establish and maintain. GBM
During the community visits, it was not unusual to hear GBMs describe the previous GBMs methods of operation and then to explain how they had changed it to ‘a better method of operating’. Changes to the management of the LRG were often cited. This seems a potentially destructive issue given that one of the RSD objectives is to build community governance and leadership. While a ‘one size fits all’ approach is obviously not preferable, constant change is also not a desirable outcome.
5.5.5 The IEO position
The majority of stakeholders considered the IEO role to be critical. As one observer noted, ‘without the IEO, RSD would not work’.
Government stakeholders in particular felt that the IEO provided valuable information about the community that they would not otherwise be able to access. GBMs and ROCs staff relied on the IEO to keep them informed about community issues and sensitivities that they thought were important to be aware of:
There are a whole lot of things here that I, being a government person, will never know about, things going on under the surface. Even after a couple of years in the community - and I think I’ve established pretty good relationships - there are things that some people won’t talk to me about. I just couldn’t do this job without (IEO). GBM
New South Wales has been the exception, with neither RSD site employing an IEO at the time of the research. In both sites, IEOs were initially employed but, due to various personal and work related reasons, both officers resigned at around the six months mark. The positions were not refilled, with the ROC reviewing the use of the RSD resources and reallocating the funding for these positions.
Project Officers engaged by the ROC in Dubbo now spend one week each month visiting the communities. Stakeholders from two local Aboriginal organisations expressed the view that the community-based IEO positions were a good concept and they were disappointed that these positions were not being used.
Purpose of the role
The IEO position can essentially be seen to be as a two-way engagement mechanism: assisting government to convey information to and seek feedback from the community about services and programs; and assisting the community to raise issues with the government about service needs. In most cases the IEO role seems to have been more active around this first function. A community resident noted that ‘I see them more as an advisory service to government’ rather than a proactive voice to the community’.
IEOs appear to interpret their role according to a number of factors, including community dynamics and their own position within the community. It is quite common for IEOs to wear several ‘hats’, including holding positions on local councils or being senior elders:
I’m working as an IEO helping my people. I’m getting the message out about government. It’s very important that we stand up and have a say. I need more of my people to understand that. IEO
Some IEOs described their role as having an educative function for their community, assisting them to speak up about their needs and observations about community issues around service access and delivery:
We need community members to get involved, to have their say. I think people are worried they might say the wrong thing to the wrong people. They need to have things explained first. IEO
Some stakeholders saw the position as having the important function of feeding back discussions that happen in the LRG meetings, though few believed this was happening adequately. Comments made during the community visits suggest that information about decisions is not often conveyed back to the community at large.
It is not clear the extent to which the community benefits from the IEO position: whether they see the position as representing community interests to government and whether they are getting information about government in an easily understood format. Some stakeholders reasoned that if government were getting better information about the community then this should ultimately benefit the community, even if the benefits were not immediately apparent to them. Community perspectives on the value of the IEO position (and GBM) is explored more fully through the community research study.[268]
Stakeholders noted that the position was a challenging one for individuals and highlighted the importance of getting the right person in the job. This person needed to have both the support and respect of the community, and also to be able to appreciate and work within the structures of ‘whitefella’ governance. In general, the view was that most IEOs were managing to balance those demands effectively:
All the IEOs I’ve worked with seem to have that ability to walk in both worlds. GBM
A good IEO needs to be able to manage conflicting responsibilities to community and governments, as well as to be able to maintain some neutrality in dealing with factions within community.
Several stakeholders pointed out that IEOs need a lot of support from the GBM, and that the GBM is critical to the IEO being able to carry out their role effectively. A small number of stakeholders were concerned that the IEOs weren’t able to properly fulfil their duties when the GBM was absent. This was noted in communities where the GBM position was unfilled and in situations where the GBM was working across more than one community.
Some stakeholders, including some IEOs, thought that the IEO role should provide a stepping stone to the GBM position; that with appropriate training and support an effective IEO should aspire to taking on the role of GBM over time. Others thought that the position of GBM was most effectively managed by an ‘outsider’ who was not a community member.
Some stakeholders were of the view that for cultural reasons it is best to have two IEOs, one female and one male. Others thought that the single IEO position was working effectively. Ultimately, the quality of the person in the role was seen as paramount.
5.5.6 Local service delivery coordination
While the ROCs have the overarching responsibility for coordination at the regional level, it falls to the GBM to undertake the coordination role at the community level.
There were differing views amongst stakeholders as to whether RSD had improved service coordination in communities. Some stakeholders were able to identify positive changes, some reported no improvement and others believed that the situation was, paradoxically, worse under RSD due to an increase in the number of services in communities.
Strategies for improving service coordination in communities
Service coordination at the community level is largely the responsibility of the GBM. One of the most commonly used mechanisms for facilitating improved inter-agency coordination was to hold regular service provider meetings. Looking at the continuum of coordination discussed at the beginning of this section, service provider meetings represent the ‘linkages’ stage rather than full coordination. The linkages stage means that there is a relatively minor degree of connectivity; services continue to operate as usual but have improved knowledge of the existence of, and services delivered by, other service delivery agencies.
Opinions about the benefits of the regular service provider meetings were mixed. Some stakeholders said the meetings helped identify areas of service duplication and gaps, and provided opportunities for service providers to make connections and identify common areas of interest:
Inter-agency meetings are very useful to us. Not always at the meeting itself, but you follow up with people later. For example, we find out what new projects are coming up and then we can talk about it at the Training and Employment Meeting separately. NGO service provider
I make sure that people get introduced to all the players. I make sure that I understand what their program is about, and then I suggest that part of their target group is also the target group of someone else. Pretty much everyone has some crossover in target group. We guide them to other people where there are linkages. Then we have interagency meetings here once a month. GBM
The inter-agency meetings are essential and it requires the GBM position to coordinate them. There’s so much staff turnover (in services). It’s important that we meet and share information. Government service provider
Some service providers described the regular meetings as ‘talkfests’ that achieved no real outcomes. There were questions about the extent to which the sharing of information was leading to better coordinated services:
The service provider meetings are not very useful. It is just reporting and could just as easily be done through email. The problem is that nothing comes out of the meeting - it is just an update. There is no reporting against the LIP. (NGO service provider)
The service provider meetings have now stopped. They were not very effective; people would digress and get off topic. Some people there didn't seem to know the purpose of the meeting. People were getting defensive. Government service manager
Maintaining a calendar as a way of keeping track of visiting service providers has proved to be an effective method for GBMs to monitor who is in the community on what days. Some GBMs post the service provider roster at the local shop so that interested community members can know more about what is going on.
GBMs also employ opportunistic means of connecting with service providers. For example, the research team observed during site visits that the GBM spends a fair amount of time at the airport, catching up with service providers arriving and leaving the community.
Some stakeholders noted that a very important mechanism for inter-agency coordination is at the regional manager level, or even the state office level, where people have more decision-making authority than community-based staff. For example, a ROC staff member noted that agreements brokered at a regional leadership group had been useful: ‘When we had obstacles on the ground, our (GBM) can tell the agency’s staff “Your manager said…”’.
As with so many aspects of RSD, there was a view that the skills and abilities of the people involved played a key role in improving service coordination. High turnover of staff, particularly GBMs, had hampered coordination efforts in some communities:
On the ground service coordination depends on having a good GBM and a good ROC manager who can pick up the phone and get onto other agencies when needed. Senior government manager
There is little doubt that a clearer articulation of what good service coordination might look like, and better training in appropriate methods would assist the GBMs to be more effective in their role. High‑level coordination needs to take place to ensure the GBMs are not attempting to deal with issues that are beyond their control. At the community level, coordinated service delivery could be improved through the use of more innovative methods (other than calling meetings).
Challenges for service coordination
There was a consistent view, including amongst those who cited improvements, that ‘There is still some way to go’ to achieving service coordination in communities. One consequence of increasing the quantity of services in some communities was that it made the coordination challenge more difficult.
The situation is now worse regarding service coordination. There are more people in the community so coordination is more of a problem, they are not linking up. Senior government officer
It appears that service duplication, although reportedly reduced in some communities, is still a problem. During a group discussion with government agencies, there was a view that communities had been ‘flooded’ with competing programs and ideas - for example, it was said that ‘everyone wants to deliver a healing program’. In another community a government manager had undertaken a service mapping exercise and found that, unbeknownst to them, four different service providers had run cooking classes, ‘to the same group of ladies’.
One school principal said that he had to restrict the number of services coming to the school because there were not enough days to accommodate them all. An ICC had done a scan of service providers operating across their (geographically large) region and identified 155 different services being provided. Clearly a large volume of service providers makes coordination difficult, and can be confusing for everyone, including the community:
Lots of confusion between who should do what - if we the service providers are confused, imagine the community! NGO service provider
There is duplication of services and it’s creating confusion in the community. They don’t know what services are doing and which one to turn to. Aboriginal organisation
Some stakeholders thought that resourcing was a major barrier to service coordination. A frequent comment from service providers was that delivering services to the community was their first priority, and absorbed so much time that coordination with other services was seen as a lower priority. For example, a representative from an Indigenous community health organisation said that because nurses are so busy attending to basic health needs of the communities, there is no ‘extra’ time to coordinate. The view was frequently expressed among service providers that coordination needed to occur at the regional, executive level.
Many service providers acknowledged the efforts of the GBM and believed that their presence in communities was undoubtedly improving the level of awareness and information sharing amongst service providers. However, the GBM had no authority to direct the activity of another agency, so ultimately much depended on the attitudes of individual service providers.
Non-Government Organisations
The objectives of RSD refer to improved coordination of government services. It is not clear where the Non-Government Organisations (NGOs) fit into this objective; arguably they could be considered ‘government services’ since they are contracted and funded by government. However, there was a strong sense among stakeholders that the involvement of NGOs had not been properly addressed in the RSD framework:
We need to engage more with the non-government sector. This wasn’t done adequately. We need to think more about how all those services are coordinated in the community. Senior government officer
Stakeholders thought that competition for funding and contracts was a significant deterrent to agencies sharing information and working together in a coordinated way, and contributed to service duplication.
Some said that funding arrangements still support silo services, which are oriented to individual program arrangements rather than addressing community service needs in a strategic way.
Different services in communities appeared to be working towards a number of different goals, primarily through focusing on the delivery of outputs in service delivery contracts. In this respect, service provision was more along single agency lines, rather than through coordinated delivery:
There’s still a sense from some agencies that they just roll into the community and deliver what they are funded to deliver and then off they go. We haven’t cracked the nut in better service coordination. There’s still a silo mentality - I’ve got a job to do and I just go in and do it; that’s what I’m paid for. Senior government officer
Coordination of the reporting and accountability requirements
There was a strong view amongst government stakeholders that the reporting requirements under RSD had been excessive and overly burdensome. Most recognised the need for accountability but questioned the value of much of the information that was requested of them. Some were critical that the information flow was essentially one-way, and they were not given a clear idea of how the information would be used:
It’s difficult reporting to different masters – the Minister, the state government, the Coordinator General. I’m still not clear on the Coordinator General’s relationship with the Minister and RSD Branch. We get requests from the Coordinator General’s Office and I’m not clear what I’m supposed to provide. There’s extra reporting requests for information at the drop of a hat. Senior government officer
I was surprised at lack of agreement up front on reporting requirements – for example expenditure statements. Things were written up in a ‘thou shalt’ manner but not really discussed. The haste was a problem. There were lots of words and rhetoric but no real discussion. Government officer
We need to get the reporting right. We need to agree what that looks like and simplify things. We haven’t set up the systems properly. Government officer
National level stakeholders generally did not believe that reporting requirements were excessive, and were unclear as to why other stakeholders had been critical:
We need to get to the bottom of that, what are people talking about when they say there is too much reporting? Senior government officer
It appears from the range of views that there is confusion around reporting requirements. It is likely that stakeholders operating at the state, regional and community levels have experienced the cumulative effect of different bodies requesting information, whether part of the formal reporting mechanism, or through the ad hoc requests for information.
As pointed out by stakeholders, when people can see a rationale for the provision of information and have a clear idea about how the reporting information will be used by those requesting it, they are more likely to see the value in investing time for this purpose. When they see it as unnecessary bureaucracy that takes time out from the ‘real work’ stakeholders have suggested it can result in high levels of frustration and resistance, and the quality of the information may be compromised.
5.6 Enhancing infrastructure and services
This section examines stakeholder perceptions of changes in services over the past three years, including the level of infrastructure and services, the quality of service delivery, and people’s access to services. Some stakeholders were not able to comment, as they had not been involved with the communities before RSD commenced. Some had some difficulty distinguishing RSD achievements from other current or past initiatives and programs. In the NT in particular, changes brought about through the NTER and Stronger Futures, as well as the amalgamation of community councils into Shire Councils, seemed to have had a more significant impact on communities in the minds of some stakeholders.
One of the objectives of the NPA RSD is to improve the range and standard of services in the selected RSD communities. Additionally, a principle of the NPA RSD is that the target communities should have standards of services and infrastructure broadly comparable with that in similar non-Indigenous communities.
A key issue of clarification here is the many understandings of the word ‘service’ itself. In stakeholder discussions it has variously been taken to mean: infrastructure such as buildings, houses, Internet access; essential services such as health and education that government is expected to provide in any town; and the more generalist services such as nutrition or wellbeing programs. Stakeholders who were involved in the early days of RSD development have mostly discussed RSD in terms of the first two: infrastructure and essential services.
In a general sense most stakeholders agreed that there had been enhancements in the level of infrastructure and services over the past three years, though the level of observable change varied from community to community. Children and Family Centres, Wellbeing Centres, new housing, a stronger police presence and enhanced school facilities were among the most frequently mentioned changes. Many stakeholders also noted increases in early childhood services and family support services. Whilst not all of these could necessarily be attributed to RSD, there was a sense that the RSD had brought greater focus to the communities and had helped to drive change:
The transparency with RSD and Working Futures has helped to shine a light on the RSD communities. Infrastructure has been delivered to the communities. There have been definite improvements in those sites. Senior government officer
RSD has given a focus to these communities, a commitment from three levels of government. And particularly the funding from the Australian government - that has been so important. The issues here are so much bigger than local government can manage. Shire Council representative
The RSD forced governments to come to the table, to look at the needs for infrastructure and services in those communities. Government service provider
In some sites, notably NSW communities, stakeholders commented that although there had been some broad service enhancements, they wished to emphasise that they did not believe RSD had contributed to the enhancements. They believed that they would have happened anyway, even if RSD had not been implemented. For example, efforts to enhance early childhood services were reported to be well underway before RSD:
Absolutely nothing has been achieved as a result of RSD and any changes that have occurred would have happened without it. NSW NGO service provider
A few stakeholders in NSW seemed to be suggesting that not only had RSD not contributed to service enhancements; it had in fact been a hindrance:
The RSD initiative was just another layer of bureaucracy. Government manager in NSW
5.6.1 The services
Whilst an increase in services since RSD commenced was widely acknowledged across most sites, several stakeholders observed that the quality of services and community access to services were still major issues in some cases:
It’s not enough just to have the service; the quality of the service matters. Community resident
We probably haven’t paid enough attention to service quality, we’ve had a much greater focus on service coordination. Senior government officer
An increase in the number of services was not universally seen to be a positive outcome, with some community based stakeholders noting that an increase in, and competition between service providers was confusing to community members.
Services are confusing - they are coming into the community and we don’t know what they’re doing. Community organisation representative
Service providers are competing with each other because their services cross over - Health, Medicare Local, and Save the Children - all competing. It is so expensive and inefficient. Fly in and fly out services are not here for long enough. Community resident
RSD has huge impacts on this community, but at the same time it also brings a malaise to the community. There are more services but more turnover of staff, totally confusing the community. Shire council representative
Stakeholders in one community described several concrete examples of service duplication. This particular community had experienced some difficulties in recruiting and retaining a suitable candidate for the GBM position, which was likely to be a contributing factor. It does however highlight the potential pitfalls of increasing the number of services in a community without careful consideration of need.
5.6.2 Leveraging of other funding sources
Several stakeholders observed that RSD had enabled government officers to advocate more strongly for funding from other programs. Some saw the ability to leverage funds to create new services as an achievement of RSD, enabling government to focus efforts on particular communities. Other stakeholders, including those with a more regional perspective, thought that at times the RSD sites were being over-serviced relative to some other communities in the region. It seems likely that a proliferation of generalist services may have been provided, in part, because of the difficulty and time needed to deliver on more of the essential long-term services.
5.6.3 Maintenance of new infrastructure
There seemed to be a lack of clarity among some stakeholders about which governments or agencies would be responsible for the ongoing maintenance of infrastructure. It is not clear to what extent these issues had been discussed amongst key parties during the LIP development phase or subsequently. However, some stakeholders were concerned at the possibility that infrastructure would fall into disrepair without the proper acknowledgement of responsibility and commitment of funding. In some jurisdictions the RSD has tried to address this issue through clearly identifying the infrastructure owner in the funding agreement at the setup of infrastructure projects.
In the NT, Shire Councils were relatively new and some said they were not involved in the early days of the LIP process. In this situation, councils were concerned about ongoing maintenance of buildings. As councils in most of the RSD areas have very low rates bases these concerns appear to have legitimacy.
5.6.4 Place-based approach within a regional framework
Stakeholders generally believed that the idea of a whole of government, place-based approach to planning and service coordination in remote Indigenous communities was a good concept. The strength of this approach is that it takes into account the unique circumstances of individual communities and provides a framework for better-targeted services to address community needs:
Place based is definitely the right approach, you can’t have a one model fits all approach. The more you understand the local environment the more likely you will be to find the right solutions. Senior government officer
Under the RSD model the place was envisaged as an individual community; however in some areas stakeholders believed that the place should be conceptualised at the regional level. In some jurisdictions stakeholders said there had been insufficient discussion among Australian, state/territory and regional level authorities regarding the appropriateness of the selected communities, and how the RSD could best be implemented, taking into account existing regional frameworks and priorities:
The place should have been whole of APY lands. It created problems where there is a community getting things and others not - this concept put the communities off from the beginning. It created problems between communities and made the messaging difficult. Communities didn’t like it at all. Government manager
Stakeholders supporting a more regionally focussed approach to planning said it enabled better deployment of resources to match need. Some suggested that a focus on specific communities could lead to a situation where those communities are over-serviced, at the expense of other communities in the region:
Place based planning is the way to go, with place being at the regional level. But we still need the ability to do things differently in communities, to address local issues. Government officer
There has been a tendency to push things to the RSD communities whether they need it or not. Government manager
Ultimately, place based approaches to planning and service delivery need to be considered in the context of the wider regions in which they are situated.
5.7 Community engagement
An objective of the RSD initiative is to create a process for ongoing conversation between the community and government about community priorities and how best to align government services with these priorities. RSD intended not just to improve coordination of government services but also to improve responsiveness of services to community needs and aspirations. Effective processes of community engagement are critical for achieving this objective.
Many stakeholders noted that the government engagement processes are being limited by general feelings of over-consultation in communities. As a result, it is increasingly difficult to ensure that community leaders attended meetings. A consistent theme was the need for a lower quantity of engagement, but with a focus on higher quality. This is issue was also identified in the NTER evaluation, which found that consultation activities were fragmented, working on a program-by-program basis rather than through coordinated discussions on interrelated policies and programs. This results in an increase in the overall level of consultation burden on communities, and reduced effectiveness of consultation.[269]
Informants also noted that engagement processes could be improved if sufficient lead times are provided for communities to absorb and discuss issues in advance. The need for engagement processes to have sufficient time was emphasised, especially where complex concepts are being discussed.
At the local level, GBMs are the most visible point of engagement, with the ROC and LRG (or equivalents) being the bodies representing the government and the community respectively.
5.7.1 The Local Reference Group
The purpose of the LRG is to be the voice of the community in a partnership between government and community. LRGs have been created based on the specific arrangements and needs in each community; each is therefore unique and uses whatever procedures or arrangements already exist for decision making in that community. Many communities have not established separate LRGs specifically for the RSD, but have incorporated these responsibilities into the work of other existing groups. The LRG concept appears to have worked best in communities where relatively strong governance arrangements already existed:
The LRG are working together really well and capturing the ideas of government. The LRG meetings make government stop and listen to community and use this knowledge to organise services in the aboriginal way. IEO
In many RSD communities there are a very limited number of people who have the ability and willingness to regularly participate in a representative group such as the LRG. Consequently, those involved in the LRG or equivalent have tended to be those who already have high levels of responsibility and commitments in the community. One of the challenges for RSD has been to maintain momentum and keep people involved through participating in regular meetings.
The LRG was also intended to provide a focal point for community governance and capacity building. A couple of stakeholders specifically mentioned that they had participated in governance training and found it to be very useful. These stakeholders wanted to see more of this, and they wanted to see others in the community being trained as well.
Government stakeholders who had been involved in developing the NPA RSD noted that the expectations about the role of the LRG might have been too ambitious in the sense of expecting this group to be the answer to the community governance agenda:
We should have done more to build on existing groups and individuals. But we also need to build up the capacity of other members in the community, so that the work doesn’t fall to the same people all the time. Senior government officer
As well as representing community interests to government, the LRG is also intended to provide regular feedback to the community about government priorities and initiatives. Some stakeholders have indicated that they saw feedback to community as the responsibility of the IEO. Others believed that as the LRG members were mostly chosen to represent all of the different groups that make up the community, they were best placed to provide this feedback. Many stakeholders were of the view that regular feedback to communities was not occurring at the level envisioned in RSD.
5.7.2 The Local Implementation Plan
A key element of RSD, the Local Implementation Plan (LIP) is intended to represent a joint effort by government and community to identify local priorities and actions for future investment. The LIPs serve as an accountability mechanism in attributing responsibilities to governments and timeframes for their delivery. They are also intended as a roadmap for service providers to coordinate their activities. Outside of the LIPs, some communities have other community wide plans that increased the coordination and collaboration challenges.[270]
Many concerns were raised during the interviews about the ways in which the LIP process was managed, however stakeholders generally felt that the concept of a planning document was important and that an improved version of the LIPs should be retained in any future arrangements.
The development of the LIPs
One of the most significant areas of criticism related to the timeframes in which the LIPs had to be developed and signed. A number of stakeholders expressed very negative views about the short timeframes that had been imposed on them and felt that it undermined one of the key principles of the RSD, that of good community engagement. Many, including those who have extensive experience in working with remote Indigenous communities, pointed out that people in communities need a lot of time to digest information from government and to properly understand what it means for them:
At the front end things were done too quickly. We were trying to give communities messages about RSD, about Closing the Gap and how it all fits together. Senior government officer
The strict timeline was the downfall. There was not enough thinking about the need for communities to have time to digest the information. ROC officer
The extent to which all relevant parties bought into the LIP process has been highly variable. Many stakeholders commented positively on the achievement of the LIPs in effectively bringing Australian and state/territory governments together by providing a joint framework for service delivery and accountability. However, other stakeholders raised concerns that not all key parties had been appropriately engaged, and there were examples of actions having been assigned to particular agencies where they had not been a party to the decision making.
One example was the lack of Shire Council involvement in the LIP development phase in some communities in the NT. This was noted by two Shire Council representatives as well as representatives from other levels of government. The lack of shire engagement in the early negotiations had created difficulties in those communities, essentially undermining the processes of collaboration and coordination that are the underpinnings of localised planning. As noted before in Section 5.6.3, it also had negative implications for shire acceptance of maintenance responsibilities for some new infrastructure:
We are a signatory to LIP but we were pressured by governments to sign off without having been involved. We took it upon ourselves to get involved and consult with the local community. Shire Council representative
However, comments from a range of stakeholders indicate that the Shire Councils have become more engaged over time, with the Australian and NT Governments recognising the key role played by Shire Councils in remote service delivery:
Of all the levels of government, they are the ones closest to the ground. Government officer
We are now more involved with the LRG meetings and the implementation of the LIP. We have duplicated actions from the LIP in our Shire plans because we saw them as important. Shire Council representative
Others saw the actions coming from the LIP as primarily a Australian Government-driven process that lacked true collaboration. One stakeholder was very critical of the lack of communication about infrastructure plans:
This (building) was supposed to be in place by now. We were told ages ago that the existing building would be knocked down and construction would start. Nothing’s happening and there’s a complete lack of clarity about it. We don’t even know why it isn’t happening let alone if it is going to ever happen at all. How can we plan around that? Local government representative
Planning and accountability functions of the LIP
Most stakeholders who had good knowledge of the LIPs thought that they contained too many actions and that this undermined their usefulness as an accountability mechanism. The RSD Implementation Review[271] noted that the LIPs contained nearly 4,000 actions across the 29 RSD sites. There was a strong view amongst stakeholders that it would have been better to focus on a much smaller number of achievable actions. In the words of one regional manager: ‘less is best’:
In the beginning we over-engineered the whole thing, made it too complex, especially the LIP and the LIP Refresh. We made it too big and now it is all so difficult. Senior government officer
There are some good things in the LIPs, but essentially they’re too big. In hindsight we should have made them simpler, more achievable. And we should be doing regular updates in a more simple way, not the big process of the LIP Refresh. Senior government officer
Many stakeholders also considered the range of actions identified in the LIPs as problematic. According to stakeholders the LIPs contain a mix of short and long-term actions, some with timeframes that go well beyond the RSD timeframe, and general statements about ‘things that government should be doing anyway’. In addition, there were actions where delivery was dependant on critical factors that may themselves require substantial timeframes to resolve, that were not always reflected in the LIPs.
A report from the Coordinator General’s Office noted that the scope and timeframes for commitments in the LIPs vary widely, with some actions as simple as arranging a meeting; and others as complex as the development and construction of major infrastructure, with complex services as part of the deliverable. The report goes on to note that the capabilities required to deliver in each location over a multi-year period are substantial. It points out that many actions are subject to critical dependencies, and sequencing of actions remains vital.[272]
Stakeholders in some jurisdictions believe that there has been a ‘backing away’ from the LIP commitments over time. The reasons for this were variously seen as political (different agendas in different levels of government), a sense that some of the actions were too ambitious and not achievable in the timeframe of the NPA RSD, or a combination of the two.
Stakeholders from several government agencies indicated that there were items in the LIPS that were the province of their departments, but to the best of their knowledge, no one in their department had agreed to. Thus the items were not funded and did not occur. This did not enhance the credibility of the LIPs.
Reporting against the LIP action was also a source of contention. The terms over-engineered and overly bureaucratic and similar sentiments were expressed frequently in relation to the LIPs.
Funding LIP actions to increase community engagement
There was a view amongst some stakeholders that a top-down decision making process was still in evidence, despite the rhetoric about needs and priorities being identified through a ‘ground up’ process. Part of the reason for this is the inability of people on or close to the ground to make funding decisions, even for relatively small amounts of expenditure. These stakeholders said they like to be able to approve and fund some of the small action items identified in the LIPs, so that they could delivered to a community within a reasonable timeframe:
It’s about an act of faith really. If we could have put in place some small things then the community could have seen the benefits of RSD, and the LRG for that matter. As it was they waited so long for things that they just stopped caring. Government officer
Stakeholders believed this culture of risk avoidance formed a significant block to ongoing engagement with some communities. Substantial time delays between the identification of a need in the community and getting approval from a centralised authority enhanced a community perception that it was ‘business as usual’, with decisions being made in Canberra. This did little to facilitate the notion of a genuine partnership:
There is a collision between place based initiatives and national rollouts. We (the Australian Government) are not good at place based; we are better at one-size fits all. Government officer
The problems were considerably exacerbated if the LIP item was large or required access to the Indigenous Remote Service Delivery (IRSD) Special Account. Stakeholders were particularly critical of the IRSD, the lengthy times for having even modest sums of expenditure approved, and the fact that it could be extremely difficult even to find out where the process was at or the likelihood of it being approved:
People closer to the action should have higher delegations. Decisions are made in Canberra and this does not help when you are trying to work in partnership with communities. Government manager
Some expressed the problem in terms of government’s inability to allow more power and decision making to communities themselves:
It is a fair criticism of RSD that the community governance capacity-building has not been there. There is not a lot of trust that Aboriginal communities can do things themselves and there has never been a lot of investment in their capacity. Senior government officer
Greater devolution of responsibility and decision making to those in a better position to make judgements about community needs would have considerably enhanced community ‘buy in’ and engagement with the RSD processes.
Service provider usage of LIPs
Several service providers commented positively about the usefulness of the LIP. They thought the LIP provided clarity about what service providers are seeking to achieve and what their respective roles are:
I like (the LIPs) because there are so many different activities… The LIP brought it all down to ‘this is the goal and this is the activity’. When you take the obligations and the money and where it’s supposed to be spent, these will tick all those boxes… You don’t have to be looking at five or six strategies or plans to try and map what you should be doing to make your contribution. It has come down to a very tangible thing. Government service manager
A state government regional manager explained that they sent the LIPs to any agencies looking to fund or run new programs or services so they could determine if they aligned with community priorities in the LIPs.
Some service providers noted that the LIP had assisted with their own service planning:
I refer to it when I do my strategic plan. We certainly take note of it when we do our strategic direction. Government service manager
The LIP is great; we're always looking at it. We refer to the targets for community safety and have used it to apply, successfully, to argue for funding. Community‑based government manager
Some described it as a useful accountability document:
(The GBM) comes up and asks about progress on the targets. It’s a signed off document with all the powers that be, so we have a responsibility to take notice. There are things in here that we want too, and we can use it to put a little pressure on. School principal
Community participation and ownership
There was a widespread view amongst stakeholders that the LIP process was essentially top down. Many pointed to the overly bureaucratic and template nature of the documents (and the similarities among many of them) as evidence that the process was largely government driven and lacking genuine community input.
However it was evident from the interviews that many of the ROC staff in particular put considerable effort into engaging with communities up front in a genuine effort to understand their needs and priorities and to ensure that these were reflected in the LIPs. Efforts were made to involve the wider community and not just to rely on the involvement of a few key people as spokespersons:
We were conscious when working with RSD that we didn’t want to buy into the same ‘political empires’ - the same spokespeople. We didn’t want to set up a new system that again allowed a few to have a say and didn’t engage the broader community. Our LIPs were based on broad engagement of all clan groups, elders, young people. Our IEOs were integral in this approach. They approached elders of all clan groups and asked them who we should be talking to from their clan group about particular issues. We still use that approach. ROC officer
Other stakeholders expressed frustration at not having sufficient time to properly engage communities in the LIP process due to the push for a quick sign off:
Early in the process there were community workshops but this was all done in a rush. There was an imperative to get things signed and say - we’ve done it. Our failing was to speed towards getting things signed. We should have taken longer to reflect, to spend more time in the communities trying to understand. ROC officer
In essence, the LIP has been developed according to the needs of government. The LRG has found the entire process to be somewhat top-down when they were told it would be community owned. GBM
Most stakeholders did not see the LIP as a plan that could be the focal point for an ongoing conversation between community and government, largely because of the unwieldy number of actions. The level of community ownership in the LIPs is explored in the community research study. See Chapter 4.
The importance of clear communication and mutual understanding
A concern frequently raised among stakeholders was that the LIPs had raised community expectations about things they wanted that were either not a priority of government and/or not going to be delivered in the short-term. This had resulted in community anger and frustration, and had caused damage to already fragile community / government relations. Stakeholders noted the need for government to have clear, open dialogue with communities about what could and could not be achieved, to assist communities to understand what government responsibilities were, what were community / individual responsibilities, and to ensure that the community had an understanding of the timeframes for delivery of services and infrastructure.
One stakeholder who had been living in Indigenous communities for several decades observed that even with the best intentions there is still a lot of miscommunication between government and community. She cited several examples of situations where she had checked people’s understanding of the outcome of a particular negotiation, only to find that the meaning had been misunderstood. Such observations highlight the need for straightforward messages, and the importance of ongoing dialogue where understandings can be checked and re-checked over time.
Differing expectations about the function of the LIP
It is clear from the interviews that stakeholders have different views about the value and utility of the LIPS and different expectations about their potential. One of the key differences appears to be around whether their primary focus is about accountability and planning at higher levels of government or whether they are a community-level document which engages the community in genuine partnership and provides the basis for an ongoing dialogue between community and government. It appears that in trying to do both their effectiveness has been diminished.
In summary, based on stakeholder feedback and other reports cited in this chapter, Indigenous community engagement is best undertaken by:
- providing clear messages
- tailoring engagement based on knowledge of what works locally and taking into account cultural norms
- strengthening communities’ leadership capabilities
- providing feedback loops, so that information is shared appropriately
- ensuring that processes are in place to monitor progress and rectify issues as they occur (continuous improvement).[273]
As discussed in Section 5.4.2 above, stakeholders were of the view that the RSD message or narrative was not clear from the beginning; hence the effectiveness of engagement was inevitably weakened. Generally speaking, stakeholders also considered that despite the best of intentions, engagement over the LIPs was not sufficiently tailored. The LRG has worked effectively where there were already strong governance mechanisms in place but is struggling elsewhere. Feedback loops appear to be relatively effective from the community to government through the IEO; however there is less evidence that feedback is occurring the other way.
Finally, it is important to note that effective engagement approaches are often closely linked with coordinated activities in communities. There are often overlaps and interdependencies between coordination and engagement activities. Effective community engagement and feedback loops can provide valuable information for policy development and review if openly shared, whilst effective coordination can support more tailored and targeted activities on the ground.[274]
5.8 Strengthening community governance and leadership
An objective of the RSD is to improve the level of governance and leadership within Indigenous communities and Indigenous community organisations. The stakeholder discussions suggest that there has been less of a focus on this objective than on enhancing services in the RSD communities.
5.8.1 Programs and courses
Under the RSD initiative a range of programs and courses have delivered some development opportunities to both emerging leaders and to youth in particular, and stakeholders considered these to be worthwhile initiatives.
Stakeholders also pointed out that one-off activities were insufficient to make any long-term difference for the people who attended them. For example, two development programs for young people in the Gulf communities in Qld were widely considered to be well run and to provide a good opportunity for young people to improve their skills and confidence. Several residents in these communities said they observed positive changes in the young people who had participated. However, they also noted that these changes had not been sustained; the young people had returned to their previous negative behaviours because of the lack of follow up and no real opportunities to reinforce their new found skills.
In WA, governance training for community council members has been instituted with the guidance of the LAC (GBM) and facilitated through the Kimberley Land Council. The training has been provided over the last year and whilst it is early days, stakeholders believe the initiative is beginning to reap some dividends. They say that the long-term training approach has given people some time to reflect and has resulted in reducing dysfunctional feuding between families, provided new knowledge and skills and helped people to see opportunities to improve governance processes. Attendance is voluntary but it has apparently attracted a sizeable group that attends regularly.
5.8.2 Existing community governance arrangements
Existing governance arrangements in communities vary widely and there are often complexities and historical difficulties that take considerable time to identify and understand. For example many communities have existing councils with very little or no capacity in financial management or strategic planning. Some existing councils have a fraught history: family feuds have influenced decisions; and accountability to community and government is poor or non-existent.
These issues represent a serious challenge to the development of governance and capacity building. There is a widespread view amongst stakeholders that assisting communities to develop functional and effective mechanisms for community representation takes time and simply cannot be rushed. Indeed the whole premise of the RSD rests on an assumption of partnership between community and government, and while there is no effective mechanism for representing a community perspective, government initiatives will inevitably be criticised for being top down.
5.8.3 Community capacity and service provision
Stakeholders in several sites noted the absence of community controlled organisations delivering services. They raised concerns that this was diminishing opportunities for developing community capacity and governance. Those who had long experience in working with communities noted an increasing trend towards ‘outsourcing’ service provision that had previously been delivered by local councils and providers. Frequently this outsourcing has been to large charitable NGOs. These stakeholders acknowledged that local providers often suffered from weak governance, poor financial management and a low level of service delivery capacity. However, a consequence of this shift has been a diminution of community control and community disempowerment.
There are questions around the long-term intentions of government when providers are contracted without building in, being prepared to pay for (and strictly monitoring) an obligation to mentor and train local Indigenous people, with the view to handing back service provision to the local community. It is not clear if such contractual obligations are being written into government contracts. Some NGO stakeholders were already employing local staff, while others indicated that they were experiencing difficulties in locating suitable local people for positions:
We shouldn’t have big NGOs from out of town coming in there running the services in the community - there should be local community controlled organisations running the services. There might have been problems with the community-controlled NGOs on the ground, but instead of providing them with the governance and leadership training and leaving the management in the community, the government has just taken the attitude that well, Salvation Army or Red Cross are doing a good job in town so we’ll fund them to do that over here… it’s cut out that ownership from the community, they don’t have that buy-in. Then the government would have a body to meet with, instead of going looking for them. Government officer
5.8.4 A long-term objective
The overall sense from the stakeholder interviews was that RSD had not yet delivered any substantial improvements in strengthening community governance and leadership. Many acknowledged that this was a long-term objective that would require sustained efforts over many years and even decades:
I would like to see council running the RSD with agencies going back through council again… I would like to see RSD continue for longer to give more community capacity and ownership… It needs to come more from community than from government. Government officer
Stakeholders recognise the complexity and difficulty, but this does not appear to be recognised in the RSD design:
Community governance is vital, yet this is one of the hardest areas to get traction on. There are significant barriers, such as poverty, community dynamics, factional fighting and so on. We needed to spend a lot more time thinking about this at the beginning, talking with communities about the notion of partnership and what it means, talking about the importance of communities having a voice. Senior government officer
One group of people came and did governance and leadership training - we need more. We need the young ones to get trained. They need to learn how to help each other, stand up for community. IEO
The governance and leadership issue has not been dealt with properly. In (community) we had a dysfunctional council, we had all this RSD stuff going on, but the council wouldn’t even meet. Senior government manager
I think this has been a lost opportunity. We could have done so much more earlier on. We expected the LRG to be the panacea, but that is not going to overcome decades of disadvantage. Senior government officer
It is not clear why less attention has been paid to the community capacity and governance objectives in the RSD. Some stakeholders suggest that these objectives were not given sufficient thought in the design phase, and in particular that insufficient attention was given to how these objectives would be addressed under RSD. Despite the strong acknowledgement that short-term, one-off courses are largely ineffective, most of the activities that have been directed towards community capacity and governance do not appear to have taken a long-term strategic approach. Many stakeholders have pointed out that building community capacity is a complex long-term agenda. Within the context of the five-year agreement there was perhaps an unspoken acknowledgement that this was beyond the scope of RSD.
5.9 Lessons learned
One of the overall evaluation objectives is to identify lessons learned from the RSD that could inform the implementation of future place based initiatives. This section discusses a number of themes that emerged from the stakeholder interviews.
5.9.1 A shared understanding of objectives and outcomes
Over time the RSD has come to mean different things to different people. As it operates today most stakeholders appear to see the main focus of RSD as being enhanced service delivery. The objectives of community capacity building and improved community governance and leadership seem to have had less emphasis in the implementation of RSD. This is a critical issue since the underlying philosophy of RSD is one of partnership between community and government, and an effective partnership will require strengthened community capacity. This is a long-term goal that requires a strategic and concerted effort.
Many stakeholders have noted that the lack of a strong narrative for RSD continues to frustrate efforts towards improvement. A key issue for the future of RSD and the implementation of other place-based initiatives should be to clarify objectives and to clearly set out the relationships and dependencies between different levels of objectives.
5.9.2 Investing in the front-end
There was a strong sense from many stakeholders that there had been pressure ‘to get runs on the board’ in the early days of implementation. They felt that insufficient time was given to engaging with communities to help them to understand what the RSD was trying to achieve. As well as giving communities time to absorb the changes, it was also important that government invest time in understanding the communities themselves, their existing governance processes, their strengths and challenges:
At the front end things were done too quickly. We never learn to think, reflect, take time. Senior government officer
At times our need to do things gets in the way of good process. We bamboozle the community. We need to set realistic timeframes. Government officer
Overall, there was a view that more time invested in the front end would have yielded greater benefits over the longer term, particularly in terms of improved relationships between government and community.
5.9.3 Realistic timeframes - a long-term view of change
In any initiative with a limited timeframe there is a tension between allowing sufficient time for planning and engagement on the one hand, and acting to facilitate change on the other. Some stakeholders thought that the timeframe of the NPA itself was too short for achieving sustained improvements and that what communities most needed was long-term planning and commitment:
We should have pushed back a bit initially; we should have been more realistic. You need to make the case at the design stage that there needs to be lots of time built in up front. But you need a longer program to justify investing more time in planning. In a three to four year program it is unpalatable to say that you will spend half that time planning. Senior government officer
The scale of change that is expected from the RSD is incompatible with the timeframes that were established under the NPA. Future initiatives should be realistic about the level of change that might be expected within a limited timeframe. Objectives that require longer time frames, such as community capacity building should be seen as needing a long-term strategic approach:
It’s still early days - RSD is just the beginning. Government officer
5.9.4 The importance of a mandate
Many stakeholders mentioned the importance of an unambiguous, high-level mandate to achieving effective service coordination in communities. RSD did have a strong initial mandate and there was a widespread view that this had a significant positive impact on people’s ability and willingness to work together to implement the RSD:
There has been a demonstration of partnership at the highest levels of government. Government officer
There was a genuine commitment from everyone that we needed to make things better in remote communities. Government officer
There is a sense from many stakeholders that the collaborative efforts of governments have diminished over time, in some jurisdictions more so than others. Some attributed this to fatigue or loss of enthusiasm, noting that coordination requires considerable investment of time and effort; others pointed to changes in government and differing policy priorities. Some stakeholders perceived RSD to be a FaHCSIA initiative rather than the whole-of-government approach that was the original intention:
The ebbing of the focus on RSD (like any new initiative) is inevitable, but how do you keep the mandate moving forward? Senior government officer
There are some concerns that with the waning of the mandate the ability of local agencies to continue to work together will be compromised. A key challenge for the future of RSD will be to reinvigorate the mandate for a whole-of-government, collaborative approach to working with remote communities.
5.9.5 More devolved decision-making
There was a view amongst many stakeholders that greater devolution of decision-making responsibility would improve the ability of government to be responsive to community needs. Although the RSD is designed to be a place based initiative, which does not take a one size fits all approach, there is a perception that control and decision-making power sits at some distance from the community and even the regional level.
Some saw a need for government to recognise community strengths and work to build their capacities, moving towards a model of true partnership over the longer term and one where the community has greater control over decisions that affect them.
Devolving decision-making power to a more local or regional level will require a significant shift in mindset on the part of all levels of government. It will also require a willingness to take risks and do things differently. This will not be easy and will take time to achieve, but will be necessary to fully achieve this objective. Devolving decision-making in this manner means the role of the central agency could be more appropriately conceptualised as one of leadership rather than control.
5.9.6 Investing in people
Whole of government initiatives such as the RSD require ongoing relationships and good collaboration to work effectively. Many stakeholders observed that there had been a high level of staff turnover in RSD and thought that this had hindered its implementation in several locations.
Stakeholder discussions suggest there were several factors which are likely to have contributed to high staff turnover, including: the difficult and isolating nature of the work for those based in communities; high levels of frustration due to lack of clarity around roles and responsibilities; and difficulty recruiting the most suitable people for positions.
The effectiveness of RSD in communities appears to rest heavily on individuals, so developing and supporting these key people should be a priority. Suggestions from stakeholders included: mentoring; more opportunities for sharing of good practice; better preparation and training for the role, especially training in coordination; more clarity around the role and what is expected of them; and better accommodation to enable their families to live with them in the community.
5.9.7 Tailor objectives and time frames to community capacity
Communities vary widely in terms of their ability to engage with government in a future-focussed conversation about priorities and service delivery issues because of their history, cultural makeup, and power / decision making structures. Some of the RSD communities have a stronger capacity to engage with government than others:
With the younger, fresher leadership on Council in [community], it is starting to permeate and creating an expectation in the community about getting involved. ROC officer
Some communities face considerable challenges, which inhibit their capacity to engage more effectively with government:
This community was experiencing lots of problems, family feuding, dysfunctional governance arrangements. All this RSD stuff was going on but the community council were refusing to meet. ROC officer
Future place based approaches should accept that objectives will require tailoring and the timeframes for achieving those objectives will need to be considered in the light of the capacities of individual communities.
5.9.8 The future of RSD
Overall there was a high level of support for the concept of RSD and the resultant infrastructure and service improvements. There is enthusiasm for continuing government efforts towards the goals of improving services and service coordination in remote communities. There is also a strong recognition of the need to improve community capacity in governance and leadership.
There is very strong support for the GBM and IEO positions, together with the concept of Local Implementation Plans. The effectiveness of the RSD initiative overall and its capacity to deliver improved service outcomes in Indigenous communities is dependent on each of these elements working optimally. Stakeholder opinions indicate that success has been mixed.
A number of stakeholders expressed concerns about what was going to happen in the RSD sites in the future. Some were of the view that there had been insufficient time since the roll-out of RSD for significant changes to take effect and questioned the sustainability of improvements to service coordination without a lead agency/initiative to drive that process. Others said that it was time to be thinking about and preparing for an exit strategy:
We need to be thinking about exit strategies. I have concerns about the level of expectation that has been raised. Have we thought it through? And also service providers in there competing. What will happen when the dollars are pulled out? Government officer
What happens beyond 2014? We’ve now got community behind this. It’s their lives, their communities. It’s all very hazy. Senior government officer
Some stakeholders felt strongly about the importance of continuing the RSD, recognising that efforts need to be sustained over a longer period of time:
I’m worried that people have given up on RSD. Its hard work, but we’ve got to keep going. Government manager
I’m a great supporter of RSD and its fundamentals. But I’m annoyed that we turned it into something bureaucratic and risk averse. We shouldn’t give up. We need to keep going, change course, be realistic in what we are trying to achieve. Government manager
A discontinuation of RSD would be a travesty, an abandonment of communities. This was always going to take more than four years. It needs sustained work over decades. Government officer
6 Survey of local service providers
6.1 Key findings
- A total of 338 service providers working in 33 communities (25 remote service delivery (RSD) communities and eight non-RSD communities) participated in an online survey. It was a cross-sectoral sample spread across the jurisdictions, of which 46 per cent lived in the community, and 22 per cent identified as being of Aboriginal and/or Torres Strait Islander background.
- The majority of respondents (73%) answered questions about a RSD community.
6.1.1 Perceptions of the National Partnership Agreement on Remote Service Delivery
- The National Partnership Agreement on Remote Service Delivery (NPA RSD) was seen as beneficial by more than half of the respondents (53%) who were answering about a RSD community and the figure rose to 69 per cent when the ‘don’t know’ responses were excluded.
- Respondents from Western Australia (WA) and Queensland (Qld) were more likely (78% and 70% respectively) than those from the Northern Territory (NT) and New South Wales (NSW) (62% and 53% respectively) to say the RSD was beneficial. This difference was statistically significant, as were the WA and Qld results when compared with the overall average. Almost half (47%) of the respondents in South Australia (SA) did not know, but 89 per cent of those that did know, said it was beneficial.
- There was a statistically significant difference in the perceived effectiveness of Regional Operations Centres (ROCs) in helping the coordination of service delivery for respondents from WA and NSW. WA had the highest proportion of respondents who viewed ROCs as ‘very effective’ or ‘quite effective’ (64%); whereas NSW had the lowest proportion (24%).
- The regional and local positions of the Single Government Interface (SGI) were viewed by many as having improved the coordination of services, however, respondents indicated there were considerable variations in the skill levels and turnover rates of local coordinators.
- Both Indigenous Engagement Officers (IEOs) and Government Business Managers (GBMs), or equivalent, were regarded by more than half of the respondents (57%) as being ‘very effective’ or ‘quite effective’ in helping community engagement.
- Local Implementation Plans (LIPs) were primarily viewed as ‘effective’ in identifying community priorities, but in general seemed to be seen as not well implemented.
6.1.2 Perceptions of change in the past three years
- There was a statistically significant difference in perceptions of service provision between the RSD and non-RSD groups. Forty three per cent of respondents in RSD communities thought the number of services had ‘increased’ in the previous three years, compared with only 28 per cent of respondents in non-RSD communities.
- In RSD communities, the main areas of positive change were seen as being related to local service provision, notably infrastructure, coordination and community engagement. However, in key Closing the Gap outcome areas, the most common response was that they were ‘about the same’ as they were three years ago. Similarly, the most common response (by half of the respondents) was that local governance and leadership was ‘about the same’.
- When compared with non-RSD community responses, there were few statistically significant differences, suggesting that perceptions of change in key outcome areas and current service delivery in remote Australia are not dissimilar and part of broader trends.
6.1.3 Perceptions of current service delivery
- More than one third of the respondents thought communication between local service providers was effective ‘most of the time’ (37%), and a slightly smaller proportion believed relevant information was shared openly ‘most of the time’ (26%).
6.1.4 Barriers and enablers of service delivery
- Perceived barriers to improving service delivery included: limited and competitive funding; inflexible service delivery models not suited to remote Indigenous communities; centralised ‘red tape’; inadequate communication and understanding between local service providers; staff turnover; and capacity issues in local community governance and leadership.
6.1.5 Future priorities
- Future priorities identified by local service providers included greater funding flexibility; better communication to improve service delivery; and local collaboration and coordination. Respondents also focused on the need for locally-driven decisions and services, and an increase in the employment of local people.
- In relation to the RSD, future priorities included the need for greater community ownership and governance; more concrete and practical outcomes; more support for and clarity of the roles of local coordinators; more authority to ensure implementation; longer-term commitment; and more flexible access to funding.
6.1.6 Comparison with results from Cape York Welfare Reform survey
- Conducted in 2012, the survey of service providers who worked in the Cape York Welfare Reform (CYWR) communities showed that they were, overall, more positive about perceived changes in key outcome areas, compared with the respondents in this survey. Fostering individual and family responsibility and re-establishing Indigenous authority were viewed as more important objectives by CYWR respondents.
6.2 Introduction
This chapter presents the results from an online survey of local service providers in 33 remote communities across five jurisdictions - WA, SA, NT, Qld and NSW. The chapter begins with the approach and method employed for the survey.
6.2.1 Aim of the survey
The aim of the survey was to investigate whether service providers across the remote communities consider that service delivery, including its availability and coordination, has improved, and to seek views from respondents on the barriers and facilitators that require change.
The survey complements other research components of the evaluation by seeking the views of service providers who work in the communities, either as resident or visiting providers. Online access to a questionnaire enabled a larger group of stakeholders to provide their perspective on key issues related to remote service delivery, informed by their applied experience.
Importantly, the survey methodology included comparison communities. This approach was used to assess if changes observed in RSD locations were unique to RSD locations or reflected a broader trend in comparable non-RSD locations.
6.2.2 Selection of communities
The survey was conducted in 25 RSD locations. The four CYWR communities were excluded, as they were surveyed in the previous year during the evaluation of the CYWR trial.[275]
A comparative sample of service providers in eight other communities was included in the survey. The communities were selected based on the size, location and population mix of the community, and consultations with Evaluation Advisory Group (EAG) members.
The communities selected were:
- Bourke and Brewarrina (NSW)
- Indulkuna and Ernabella (SA)
- Wyndham and Yungngora (WA)
- Lockhart River and Kowanyama (Qld).
Bourke and Brewarrina are in Western NSW, Indulkuna and Ernabella are in the Anangu Pitjantjatjara Yankunytjatjara Lands (APY Lands) in SA, Lockhart River and Kowanyama are east and west of Cape York respectively (and were not part of the CYWR trial), and in WA, Wyndham is a Kimberley town near Kununurra, while Yungngora is an Indigenous community near Fitzroy Crossing.
Comparison communities in the NT were not included because representatives on the EAG advised that multiple changes in policy and programme delivery in all remote communities in the NT made it difficult to identify comparison sites.
6.2.3 Development of the questionnaire
The questionnaire drew on earlier surveys of local service providers undertaken in the NT[276] and Qld.[277] A number of key questions were retained from the earlier surveys, and questions that focused on elements of the RSD were added. The questionnaire comprised a mix of fixed-choice and open-ended questions, and was tested and refined prior to finalisation.
6.2.4 Mapping and sampling of service sectors and organisations
Based on the Baseline Mapping Reports produced as part of the NPA RSD, and the results of previous surveys in remote Indigenous communities,[278] the main services provided in the communities include health clinics, police, schools and various municipal services. Visiting services include mental health, child welfare, legal and justice services, and discrete programs that may be funded from multiple sources and only for the short-term.
The delivery of services is typically provided by a mix of government and non-government organisations, including regional or local Indigenous organisations.
Another theme evident in previous research is the variation in accessible services; dependent on their proximity to regional centres e.g. Mossman Gorge in Cape York. A number of RSD communities e.g. Fitzroy Crossing and Wilcannia, are rural towns or regional hubs, and as the baseline mapping made apparent, they were more likely to have regional facilities and administrative centres for a range of social services.
For the two previous surveys of service providers in the NT and Qld, it was difficult to generate a robust sampling frame. There were no comprehensive up-to-date lists of the organisations that provide services in the remote communities, and key government agencies were not able to provide detailed information about staffing in the specified communities.
For this survey, lists of local and visiting service provider organisations and services were generated using stakeholder information from EAG members, together with local knowledge from SGI personnel. A targeted approach to the sample of service organisations resulted in a cross-section of local service providers being invited to participate in the survey.
The EAG and the Board of Managements coordinated the process of seeking support and agreement to the participation of government employees (of Australian government and state/territory agencies). Relevant shire managers and key non-government organisations were contacted directly, and staff in ROCs distributed letters to relevant stakeholders where necessary.
6.2.5 Regional meetings
To develop a sense of the service delivery issues in these areas, and to obtain local views on the questionnaire, it was important to communicate the purpose of the survey as a way of fostering interest and participation amongst stakeholders. Regional meetings involving key stakeholder groups were held in Broome and Dubbo in March 2013. The consultants who conducted the key stakeholder interviews attended the Dubbo meetings. A video conference was also held with the ROC Regional Leadership Group that covers the communities of Doomadgee and Mornington Island, as they had not been involved in past surveys of this kind.
6.2.6 Participation in the survey
In some locations, it was a challenge to generate interest and engagement from local service providers, especially in the non-RSD comparison communities - and they often responded less positively in the survey. The participation rates were checked mid-way through the survey and reminders were sent out by key brokers, including making telephone calls directly to local organisations.
The online survey was open from 15 April to 10 May 2013. The total number of respondents was 338. However, the total number of responses varied for each question, with a smaller number of answers for the questions towards the end of the questionnaire.
6.2.7 Sample characteristics
The sample characteristics are summarised in Table 6.1. Respondents were asked to nominate one community that they would be answering questions about and to indicate which jurisdiction they lived in. The biggest proportion of respondents was from WA (32%), followed by the NT (28%), Qld (15%), NSW (13%) and SA (12%). This distribution broadly aligns with the estimated populations of the communities in the respective jurisdictions, except for WA where there is a higher proportion of participants than was expected, given the size of the communities in that state.
Of the 33 communities (25 RSD and eight comparison communities) listed in the questionnaire, there was at least one respondent for each community. Seventy one of the respondents indicated they were answering questions for a non-RSD community. The largest number of responses for a single community was for Hall’s Creek in WA (n=31).
Table 6.1 also shows that nearly half (44%) of the respondents worked for a ‘state or territory government organisation’, and the most common sector they worked in was ‘health’. Just under half (46%) resided in the community where they provided a service.
Over half (52%) of the respondents were ‘female’ and one fifth (22%) identified as ‘Aboriginal and/or Torres Strait Islander’. The majority of the respondents had considerable experience in remote service delivery, with two-thirds (66%) indicating they had worked for ‘five or more years’ in roles where they provided services in Indigenous remote communities.
Table 6.1 Sample characteristics
|
|
|
Number |
Percentage* |
|---|---|---|---|
|
TOTAL survey respondents |
|
338 |
100 |
|
Jurisdiction |
Western Australia (4 RSD communities, 2 comparison) |
107 |
32 |
|
|
Northern Territory (15 RSD communities) |
94 |
28 |
|
|
Queensland (2 RSD, 2 comparison) |
51 |
15 |
|
|
New South Wales (2 RSD, 2 comparison) |
43 |
13 |
|
|
South Australia (2 RSD, 2 comparison) |
42 |
12 |
|
RSD community |
Yes |
197 |
73 |
|
Length of time working in nominated community |
Five or more years |
121 |
40 |
|
Resident in community |
Yes |
140 |
46 |
|
Organisation |
Australian government |
39 |
15 |
|
|
State or Territory government |
112 |
44 |
|
|
Non-government |
70 |
27 |
|
Sector |
Health |
47 |
19 |
|
Female |
Yes |
133 |
52 |
|
ATSI background |
Yes |
56 |
22 |
|
Experience of providing services in Indigenous remote communities |
Five or more years |
168 |
66 |
* Of those who answered the question, differing numbers skipped each question
Source: RSD Service Provider Survey data
Overall, a slightly higher proportion of respondents (55%) had worked in the nominated community for ‘three or more years’, compared to those who had worked there for ‘less than three years’ (45%). Table 6.2 shows that WA and NSW respondents were more likely to have worked in their nominated community for ‘three or more years’. There was little difference in the distribution of responses to this question between RSD and non-RSD communities.
Visiting service providers (59%) were more likely to have worked in the community for ‘three or more years’ compared to resident service providers (50%). Visiting service providers most commonly responded that they visited the community ‘at least once a month’ (31%), followed by ‘at least once every six months’ (24%), ‘as required’ (20%), ‘at least once a week’ (10%), ‘at least once a fortnight’ (7%) and ‘at least once a year’ (7%).
In the past year, 36 per cent said they had spent ‘less than 10 days’ in the community, 34 per cent spent ‘between 10 and 30 days’ in the community, 17 per cent ‘between 30 and 60 days’ and 13 per cent had spent ‘more than 60 days’ in the community.
Table 6.2 Length of time worked in the community, by jurisdiction and RSD (number, %)
|
|
Western Australia |
South Australia |
Northern Territory |
Queensland |
New South Wales |
RSD |
Non-RSD |
|||||||
|---|---|---|---|---|---|---|---|---|---|---|---|---|---|---|
|
|
n |
% |
n |
% |
n |
% |
n |
% |
n |
% |
n |
% |
n |
% |
|
Less than 3 years |
37 |
41 |
21 |
55 |
43 |
51 |
25 |
54 |
12 |
29 |
89 |
45 |
23 |
46 |
|
3 or more years |
54 |
59 |
17 |
45 |
42 |
49 |
21 |
46 |
30 |
71 |
108 |
55 |
27 |
54 |
|
Total n |
91 |
100 |
38 |
100 |
85 |
100 |
46 |
100 |
42 |
100 |
197 |
100 |
50 |
100 |
Source: RSD Service Provider Survey data
6.2.8 Limitations of the survey
There are limitations to a survey of this kind. Participation rates varied by community and jurisdiction, and a number of respondents had worked in the community for less than three years. As it did not employ a rigorous sampling frame, it should be viewed as an inclusive form of consultation of a key stakeholder group, rather than a comprehensive and empirically-sound survey. It was a cost-effective means of obtaining views from a large number of stakeholders - local service providers - but the results presented in this chapter represent only one part of the mixed-method approach of the evaluation.
In open-ended responses, a number of respondents indicated that they provide services to more than one community, and they found it frustrating that they could only answer for one nominated community. The fixed-choice of responses to some questions also frustrated several respondents who felt they did not have the opportunity to explain how some services, specific organisations and individuals impede or adversely affect local service delivery, or how particular initiatives or individuals had made a positive difference. However, the aim of the in-depth stakeholder interviews was to identify and explore these kinds of nuanced accounts of what happens at a local level as shown in Chapter 5.
6.3 Results
The key results from the survey are presented in five sections under the following headings:
- views of RSD and its various components
- changes in key outcome areas and in service delivery in the past three years
- current service delivery and practice
- barriers, enablers, and future priorities
- comparison with the Cape York Welfare Reform (CYWR) survey.
A thematic analysis of the open-ended questions covered issues that enable or inhibit improvements in service delivery, and changes to support future reforms. Focus was on whether service providers who work in the RSD communities had different responses to those who work in the comparison communities - and where this is relevant, results are presented below. Further analysis (ANOVA tests of statistical significance) showed whether key variables affect the results, such as being a RSD community, jurisdiction or sector.
Where relevant, results are compared with those from the survey conducted for the CYWR evaluation.[279]
6.3.1 Views of RSD and its various components
A total of 197 respondents (73%) said the community they would be answering questions about was a RSD site. The sub-sample were asked four questions specific to the RSD initiative and related to their perceptions of the effectiveness of the RSD and three key components - SGI (ROCs, GBMs and IEOs); LIPs; and Local Reference Groups (LRGs). This section concludes with a summary of the differences in responses by jurisdiction and organisation type.
Overall opinion of RSD
Of the respondents who answered questions about a RSD community, over half (53%) thought the RSD has been beneficial, compared to 24 per cent who said it was not, and 24 per cent answered ‘don’t know’. Opinions of the RSD varied by jurisdiction, and the differences are explained in the section on jurisdictional comparisons.
Of the respondents who considered that they did know about the effectiveness of the RSD[280], the majority (69%) thought it was beneficial. In particular, people thought that the number of services had increased since the start of the RSD, which was a specific objective of the NPA RSD.
Coordinated service delivery
A key objective to establishing the ROCs and GBMs or equivalent was to improve the coordination of service delivery. The most common response about the effectiveness of these two elements were that that they were ‘quite effective’, although more respondents were positive about the effectiveness of GBMs than they were about the ROCs. Excluding the ‘don’t know’ responses, two-thirds (66%) of respondents said that GBMs or equivalent were ‘very effective’ or ‘quite effective’ in helping to coordinate service delivery, compared to 59 per cent for the ROC.
Thirty four per cent of respondents said the ROC was ‘not effective’ or ‘not very effective’, compared to 29 per cent for the GBM or equivalent (Figure 6.1).
Figure 6.1 Perceived effectiveness of the ROCs and GBMs in helping to coordinate service delivery (%)
.JPG)
n=196 for ROC question, n=189 for GEC/GBM/RSDCs
Source: RSD Service Provider Survey data.
Community engagement
Respondents were asked to rate the effectiveness of four elements of the RSD - GBMs or equivalent, IEOs, the LIP process and LRGs - in helping with community engagement.
Both IEOs and GBMs were regarded as being the most effective with 57 per cent of respondents in RSD communities saying they were ‘very effective’ or ‘quite effective’. When the ‘don’t know’ responses are excluded this figure rises to 68 per cent for IEOs and 69 per cent for GBMs. IEOs were viewed by almost a third of respondents as ‘very effective’ (30%). LRGs were not far behind with over half the respondents (52%) saying they were ‘very effective’ or ‘quite effective’ in helping with community engagement. The LIPs had mixed results with 30 per cent saying they were quite effective and 29 per cent saying they were not very effective (Figure 6.2).
Figure 6.2 Perceived effectiveness of various elements of the RSD in helping with community engagement (%)
.JPG)
n=196-198
Source: RSD Service Provider Survey
Local Implementation Plans
Respondents were asked to identify how effective LIPs were in identifying local community priorities, generating change in the local communities, increasing government accountability to local communities, and improving infrastructure.
Although LIPs were perceived to be the least effective in helping community engagement, more than half of the respondents (58%) said they were ‘very effective’ or ‘quite effective’ in identifying local community priorities. When the ‘don’t know’ responses are excluded, the figure rises to around 70 per cent (Figure 6.3).
Smaller proportions thought LIPs were ‘very effective’ or ‘quite effective’ in improving infrastructure (38% total, 48% excluding ‘don’t know’ responses); increasing government accountability to local communities (31% total, 40% excluding ‘don’t know’ responses); and in generating change in local communities (27% total, 34% excluding don’t know responses).
Figure 6.3: Perceived effectiveness of Local Implementation Plans (%)
.JPG)
n=194-196
Source: RSD Service Provider Survey data.
Importance of objectives
A question asked of all respondents (not just those answering about a RSD community), referred to the importance of eight listed objectives of remote service delivery reform.
The rankings in Table 6.3 are based on the responses marked ‘very important’ and were as follows: giving local people more opportunities (83%); improving services (82%); families being more responsible (82%); individuals being more responsible (79%); giving local people more control (67%); increasing services (64%); increasing investment in the region (62%); and re-establishing Indigenous authority (58%).
As Table 6.3 shows, there was a difference in rankings between RSD and non-RSD communities. The objective of ‘families being more responsible’ ranked first for the respondents from non-RSD communities, followed by ‘improving services’. The differences in percentages however are not statistically significant.
Table 6.3 Listed objectives of reforms in remote service delivery perceived to be ‘very important’, RSD versus non-RSD (%)
|
Reforms |
RSD community |
Non-RSD community |
Total |
|---|---|---|---|
|
Giving local people more opportunities |
85 |
81 |
83 |
|
Improving services |
83 |
84 |
82 |
|
Families being more responsible |
81 |
86 |
82 |
|
Individuals being more responsible |
77 |
80 |
79 |
|
Giving local people more control |
68 |
61 |
67 |
|
Increasing services |
64 |
61 |
64 |
|
Increasing investment in the region |
60 |
65 |
62 |
|
Re-establishing Indigenous authority |
57 |
59 |
58 |
n=197 RSD communities, n=49 non- RSD communities
Source: RSD Service Provider Survey data
Comparison by jurisdiction and organisation type
Responses to the four questions relating to RSD were analysed by a variety of factors. Three factors were found to have a statistically significant effect on respondents’ views - jurisdiction, organisation type, and for fewer questions, whether the service provider was resident in the community.
For most items relating to RSD, WA and Qld respondents were more positive than their counterparts in the other three jurisdictions. As shown in Table 6.4, when asked if the RSD has been beneficial in the nominated community, of those who knew, 78 per cent of WA respondents and 70 per cent of Qld respondents said ‘yes’ respectively, compared to 62 per cent in the NT and 53 per cent in NSW. In SA almost half (47%) of the respondents did not know if RSD has been beneficial to their community, and of those who did know, 89 per cent indicated that RSD has been beneficial which was the most positive of all the jurisdictions (see Tables 6.4 and 6.5).
Table 6.4 Perceptions of whether the RSD was beneficial for the community, by jurisdiction (%) excluding ‘don’t know’ responses
|
Jurisdiction |
Yes |
No |
|---|---|---|
|
Western Australia |
78 |
22 |
|
Queensland |
70 |
30 |
|
Northern Territory |
62 |
38 |
|
South Australia |
89 |
11 |
|
New South Wales |
53 |
47 |
|
Total |
69 |
31 |
n=149
Source: RSD Service Provider Survey data.
Table 6.5 Perceptions of whether the RSD was beneficial for the community, by jurisdiction (%) including ‘don’t know’ responses
|
Jurisdiction |
Yes |
No |
Don’t know |
|---|---|---|---|
|
Western Australia |
65 |
18 |
17 |
|
Queensland |
59 |
26 |
15 |
|
Northern Territory |
47 |
29 |
24 |
|
South Australia |
47 |
6 |
47 |
|
New South Wales |
36 |
32 |
32 |
|
Total |
53 |
24 |
24 |
n=195
Source: RSD Service Provider Survey data.
In relation to the coordination of service delivery, Qld respondents were by far the most positive about the ROC with 30 per cent of respondents stating that it was ‘very effective’ and 26 per cent responding ‘quite effective’. WA and NT respondents were more inclined to say the ROC was ‘quite effective’, with 48 per cent and 37 per cent respectively. The SA respondents were the most negative with 39 per cent saying it was ‘not very effective’, and 28 per cent of NSW respondents stating the same. SA, NT and NSW had the highest proportion of ‘don’t know’ responses - 22 per cent for both SA and NT, and 24 per cent for NSW (Table 6.6). When compared with the average for all jurisdictions, respondents from WA and NSW displayed a statistically significant difference in their responses.
Table 6.6 Perceived effectiveness of Regional Operational Centres (ROCs) in helping the coordination of service delivery, by state (%)
|
Jurisdiction |
Very effective |
Quite effective |
Not very effective |
Not effective |
Don’t know |
|---|---|---|---|---|---|
|
Western Australia |
16 |
48 |
14 |
12 |
10 |
|
South Australia |
6 |
33 |
39 |
0 |
22 |
|
Northern Territory |
5 |
37 |
26 |
11 |
22 |
|
Queensland |
30 |
26 |
22 |
4 |
17 |
|
New South Wales |
0 |
24 |
28 |
24 |
24 |
n=189
Source: RSD Service Provider Survey data.
Service providers in all jurisdictions, with the exception of NSW, were reasonably positive about the effectiveness of the GBMs or equivalent in helping the coordination of service delivery. There was a statistically significant difference in perceptions of the effectiveness of the GBMs or equivalent for respondents from NSW. In NSW, only 32 per cent of respondents answered that GBMs or equivalent had been ‘very effective’ or ‘quite effective’ in helping coordination (compared with more than 50 per cent for each of the other jurisdictions). However, the higher percentage of ‘don’t know’ responses in NSW (36%) perhaps reflects difficulties in filling, or lack of contact, with these positions. NT participants had the highest proportion of ‘not very effective’ responses (26%). (Appendix M Table M.1)
WA respondents were the most likely to have positive responses about the effectiveness of LIPs, with 33 per cent saying they were ‘very effective’ in identifying local community priorities. When compared with other jurisdictions, the difference in perceptions about the effectiveness of LIPs was found to be statistically significant for WA (Appendix M Table M.2). In terms of community engagement, the most common response for all jurisdictions was that LRGs were ‘quite effective’ - although 25 per cent of WA respondents indicated that they were ‘very effective’ and nearly half of SA respondents (44%) ‘did not know’ (Appendix M Table M.3). It should be noted that the LRGs were called Community Councils in SA which could explain the perceived lack of knowledge of the LRG in this jurisdiction.
When asked about governance and leadership and whether it had changed in the past three years, WA and Qld were more likely to say it was ‘better’, compared with their counterparts. Leadership was viewed as having become ‘better’ by 25 per cent and 26 per cent of respondents in WA and Qld, respectively (Appendix M Table M.4). However, when compared with the average for all jurisdictions, there was a statistically significant difference in perceptions of change in leadership for respondents from WA only.
Respondents in WA were more likely than those from other jurisdictions to view aspects of service delivery as ‘better’ compared with three years ago. In WA, differences in perceptions of change in service delivery with regard to accessibility, standards and infrastructure were statistically significant. The same was true in the NT for perceptions of change in accessibility and infrastructure, and in NSW for infrastructure only.
Given these results, it would be worth looking more closely across jurisdictions, at how initiatives have been implemented and how well they are working, particularly in WA, where respondents tended to be more positive.
Of the four organisation types (Australian Government, state/territory government, local government and non-government organisation), Australian Government employees were more positive than respondents who worked for the other organisations (Appendix M Table M.5). For example, regarding the question whether the RSD has been beneficial to the nominated community, of those who felt they knew, 90 per cent of Australian Government employees said ‘yes’; while 66 per cent of state/territory government employees, 65 per cent of non-government organisations and 40 per cent of local government employees, said ‘yes’. Australian Government respondents were also more positive about some of the key components of the NPA RSD. For instance, LIPs were viewed by 48 per cent of Australian government employees as being ‘very effective’ in identifying local community priorities, and ‘very effective’ by 39 per cent in improving infrastructure. However, a similar proportion of respondents across all organisation types stated that LIPs are ‘not very effective’ in generating change.
Service providers who live in the communities are generally less aware of, or less willing to report on, the effectiveness of various elements of the RSD than those who provide visiting services (Appendix M Table M.6). On average, nearly one quarter of resident service providers ‘did not know’ how effective various elements of the RSD have been, compared to 14 per cent of visiting service providers. Of those who answered the question , there was no difference between resident and visiting service providers on the perception of RSD benefits, with around two-thirds of both groups (66% and 72% respectively) stating that the RSD has been beneficial in their nominated community. Visiting service providers were slightly more positive about coordination of service delivery when rating the effectiveness of the SGI in helping with community engagement.
6.3.2 Changes in key outcome areas and service delivery in the past three years
This section examines responses to questions about perceptions of change in the community in the past three years. This includes changes in the nominated community in key outcome areas such as education, employment, health and safety. It includes a comparison of responses by jurisdiction, between RSD and non-RSD communities, and between service providers who are resident in the community and those who are not. This is followed by an analysis of questions about perceived changes in governance and leadership, and in service delivery. The section concludes with a summary of responses to the open-ended question about other changes in the community that respondents wished to describe.
Perceptions of change in outcome areas
In relation to the 13 listed outcome areas, the most common response was that they were ‘about the same’, with between 35 and 48 per cent giving this response (Table 6.7). At least one quarter of the respondents said there were positive changes in the community with more ‘local people in paid jobs’ (27%), and more ‘children going to school’ (26%). There was also the perception that negative changes were occurring in some places as respondents stated there was more ‘drinking alcohol/grog’ (25%), ‘smoking marijuana/gunja’ (34%) and ‘gambling’ (27%). Between 15 and 35 per cent stated they ‘did not know’, to each of the outcome areas.
Table 6.7 Perceptions of changes in various outcome areas in previous three years (%)
|
|
More |
About the same |
Less |
Don’t know/ Not applicable |
|---|---|---|---|---|
|
Local people in paid jobs |
27 |
43 |
14 |
15 |
|
Adults studying |
17 |
40 |
13 |
30 |
|
Children going to school |
26 |
39 |
12 |
23 |
|
High school kids going to boarding school |
20 |
39 |
6 |
35 |
|
Families managing their money well |
7 |
47 |
18 |
28 |
|
Looking after houses |
19 |
48 |
14 |
19 |
|
Drinking alcohol/grog |
25 |
44 |
13 |
17 |
|
Smoking marijuana/gunja |
34 |
40 |
7 |
19 |
|
Gambling |
27 |
45 |
6 |
22 |
|
Fighting in families |
22 |
44 |
15 |
18 |
|
Fighting between families |
23 |
45 |
14 |
18 |
|
Managing unsafe or feral animals |
18 |
35 |
17 |
29 |
|
Vandalism or damage to property |
22 |
39 |
16 |
22 |
n=262-266
Source: RSD Service Provider Survey data.
Differences in perceptions of change in outcome areas
People responding about a RSD community were less likely to be positive about changes relating to ‘children going to school’, ‘families managing money’, and ‘looking after houses’, than people responding for a non-RSD community (Appendix M Table M.7). Respondents for a RSD community were more likely to not know whether there were changes in outcome areas, with about a quarter indicating they ‘did not know’ compared to 14 per cent in non-RSD communities.
There were only two items where there was a statistically significant difference between responses by jurisdiction. Qld and NSW respondents were more likely than those in the NT, SA and WA, to say that more ‘children were going to school’. Qld and WA respondents were more likely to say there were more ‘high school children going to boarding school’.
Whether or not a service provider resided in the community had an effect, but this seems to be related primarily to the proportion of respondents who could answer the question. Over one quarter of resident service providers stated ‘did not know’ for the majority of items, compared with an average of 13 per cent of visiting service providers.
Perceptions of change in community governance and leadership
When asked if governance had changed in the local community in the past three years, half of the respondents (51%) said governance was ‘about the same’, 21 per cent said it was ‘better’ and 13 per cent said it was ‘worse’. Sixteen per cent ‘did not know’. Similarly, 48 per cent said leadership in the local community was ‘about the same’, 19 per cent said it was ‘better’ and 17 per cent said it was ‘worse’ - 15 per cent ‘did not know’. When responses for RSD communities were compared with non-RSD communities, there was very little difference for whether local community governance and leadership was ‘better’ or ‘about the same’ (Table 6.8). Nearly twice as many RSD respondents said it was ‘worse’, but this should be viewed with caution as the number of responses was quite small, especially for the non-RSD sample.
Table 6.8 Perceptions of changes in local community governance and leadership in the past three years, RSD v non-RSD (%)
|
|
Better |
About the same |
Worse |
Don’t know/Not applicable |
||||
|---|---|---|---|---|---|---|---|---|
|
|
RSD |
Non-RSD |
RSD |
Non-RSD |
RSD |
Non-RSD |
RSD |
Non-RSD |
|
Governance |
21 |
24 |
49 |
58 |
15 |
8 |
15 |
10 |
|
Leadership |
20 |
22 |
46 |
62 |
19 |
8 |
15 |
8 |
n=197 RSD, n=50 non-RSD
Source: RSD Service Provider Survey data.
Perceptions of change in service delivery
In relation to whether the number of services has changed in the past three years, 40 per cent of all respondents said they have ‘increased’, 32 per cent said they were ‘about the same’, and 10 per cent said they have ‘decreased’ - 18 per cent ‘did not know’. When the ‘don’t know’ are removed, just under half (49%) of all respondents said they had ‘increased’ and 40 per cent thought they were ‘about the same’. Table 6.9 shows that respondents answering for an RSD community were more likely to say that the number of services has ‘increased’ (43%), than those answering for a non-RSD community (28%). The difference between the two groups was found to be statistically significant.
Table 6.9 Perceptions of change in the number of services in the local community in the past three years, RSD v non-RSD (%)
|
|
RSD |
Non-RSD |
Total |
|---|---|---|---|
|
Increased |
43 |
28 |
40 |
|
About the same |
28 |
48 |
32 |
|
Decreased |
8 |
16 |
10 |
|
Don’t know |
20 |
8 |
18 |
n=197 RSD, n=50 non-RSD
Source: RSD Service Provider Survey data.
Respondents were asked to reflect on whether their own organisation has changed the way it works with other service providers. More than half of all respondents (52%) said it has ‘increased’, 35 per cent said it was ‘about the same’, and five per cent said it has ‘decreased’ - eight per cent ‘did not know’. There was no obvious difference in the distribution of responses between RSD and non‑RSD communities.
Service providers were given the opportunity to specify comments in a free text field about how their organisation had changed the way in which it worked with other service providers. Twenty one responses were provided. Six of the responses related to an improvement in working relationships, better collaboration and partnerships between service providers, and two comments referred to improved communication. A few comments (n=3) indicated that there are some examples of improvements with a shared outcome focus across service providers, with one respondent commenting:
A stronger focus on the outcomes achieved for the community rather than just an output as a result of the construction/maintenance works completed. The inclusion of a training/employment schedule for civil works focussed on community engagement.
However, another respondent commented:
Improved but still a way to go. We all seek the same outcome but differ in approach.
The majority of RSD respondents (65%) felt that their service has changed the way it engages with the local community, compared with 24 per cent who said it has not - 11 per cent did not know. This positive response does not seem to be limited to RSD communities, with 67 per cent of respondents from non-RSD communities also believing that their service has changed the way it engages with the local community. In addition, there were 19 comments provided in the free text field, including responses about more focus on local decision-making (n=4) and improved engagement (n=3). There were also individual responses about increases in staff, changes in staff, engagement in training and employment opportunities, targeted activities with an outcome focus, more frequent visits/increased service delivery, and improved consultation - however, budget cuts and self-service technology were viewed by several respondents as having affected these changes.
One-third of respondents said their organisation employed more local Indigenous people than they did three years ago (34%), and nearly half (49%) said the number was about the same. Ten per cent said they employed fewer local Indigenous people than they did three years ago, and seven per cent did not know. Slightly more of the RSD community respondents (35%) said there were more local people employed in their organisation, than those from non-RSD communities (31%).
In relation to service delivery, respondents were asked if accessibility, accountability, standards, coordination of services and infrastructure in the local community had changed in the past three years. ‘Coordination of services’ and ‘infrastructure’ were the most likely to be rated as ‘better’ compared to three years ago (35% and 36% respectively). However, for these two and for the other three categories (accessibility, accountability and standards) the most common response was that they were ‘about the same’ (between 38% and 49% of responses). Table 6.10 shows that for all of the items (except for ‘accountability’) RSD respondents were more likely to say they were ‘better’ than those from a non-RSD community, however this was not statistically significant. Overall, the most common response from both groups was ‘about the same’.
Table 6.10 Perceptions of change in service delivery in the local community in the previous three years, RSD versus non-RSD (%)
|
|
Better |
About the same |
Worse |
Don’t know/Not applicable |
||||
|---|---|---|---|---|---|---|---|---|
|
|
RSD |
Non-RSD |
RSD |
Non-RSD |
RSD |
Non-RSD |
RSD |
Non-RSD |
|
Accessibility |
31 |
24 |
46 |
66 |
8 |
2 |
15 |
8 |
|
Accountability |
23 |
24 |
48 |
60 |
12 |
6 |
16 |
10 |
|
Standards |
28 |
20 |
49 |
70 |
9 |
2 |
14 |
8 |
|
Coordination of services |
35 |
28 |
37 |
56 |
16 |
8 |
12 |
8 |
|
Infrastructure |
36 |
24 |
38 |
50 |
15 |
18 |
11 |
8 |
n of responses to items varied between 194-197 for RSD communities, and n=50 for non-RSD communities
Source: RSD Service Provider Survey data.
Other changes
When asked if there were other changes they would like to describe, a total of 70 respondents provided comments. There were three types of responses - those that referred to a general change, those that referred to a specific initiative or factor, and those that detailed what hadn’t changed and needed to be addressed, or what remained unaddressed.
With the first category of general change, mention was made of mining operations, Royalties for Regions and the East Kimberley Development Fund, along with infrastructure upgrades. Other positive trends identified by respondents included a decline in food prices, logistics of living in the region becoming less arduous, and more locals with mobile phones.
There were also a number of general negative changes identified including:
- ‘brain drain’ of Aboriginal people moving to other places in the region, or beyond, for work
- ‘super shire’, making too many decisions outside of the community
- constant state of change (in the NT) with the shires, the Northern Territory Emergency Response, homelands funding, and negotiations for a new lease with a mining company
- more workers coming in from outside.
Specific factors or initiatives that were viewed as making a positive difference included:
- Police-Citizens Youth Club/more police/permanent police presence
- improvements in the school
- an individual GBM
- more programmes for women and children
- more home support for families
- alcohol restrictions/reduction in full strength alcohol sales
- significant efforts at the ministerial level and from Premier’s Department to collaborate with community leaders
- removal of old machinery and vehicles
- improvements in animal management.
Changes in service delivery that were mentioned included:
- agencies working together and being more transparent in their work and outcomes
- cooperation between service providers/improved coordination of government services at all levels/working together with other local services to make change without overlap
- improved and responsive contract management of services
- more meetings and regular updates to all providers
- general awareness of who is delivering which services and how the community may influence the delivery of those services.
The positive outcomes most frequently referred to were more infrastructure and local housing. With local infrastructure, examples included a swimming pool, new art centre, roads, and in one place there was a new school, hospital, child care centre and police station.
6.3.3 Current service delivery and practice
This section presents the survey results in relation to questions about perceptions of:
- availability of services
- staff recruitment and retention
- the commitment of organisations to various reforms in the delivery of services
- the level of understanding, collaboration and communication between organisations and local service providers
- the level and type of community engagement by their own service.
In the questionnaire, 22 services were listed and respondents were asked to indicate whether these were currently available in the nominated community, and if it was a resident or visiting service. The services most likely to be available as resident services were ‘primary school’, ‘general store’, ‘medical centre/health clinic’, and ‘church’. Those most frequently selected as visiting services were ‘mental health’, ‘Aboriginal legal aid’ and ‘child welfare/protection’. The services that respondents were least likely to know about were ‘men’s centres’, ‘women’s centres’, ‘Job Services Australia’ and Aboriginal community police (Appendix M Table M.8).
Staff recruitment and retention
The majority of respondents (71%) said recruiting appropriately skilled or experienced staff was a ‘big’ issue for their service, while 58 per cent said staff retention was a ‘big’ issue. Fewer respondents from RSD communities said that staff recruitment was a ‘big’ issue (69%) compared with non-RSD respondents (80%). Staff retention was seen as even less of a ‘big’ issue in RSD communities (55%) than it was in non-RSD communities (70%), and this was a statistically significant difference.
Commitment of organisations to various reforms in the delivery of services
The majority of respondents said their organisation ‘always’ demonstrated a commitment to ‘improved access to services’ (65%), ‘improved delivery of services’ (67%), and ‘community capacity to engage with services’ (68%). Other organisations were more likely to be seen as demonstrating such a commitment ‘most of the time’ (between 41% and 47% for each of the four items). Table 6.11 shows that respondents answering for RSD communities were slightly more positive about their own and other organisations’ commitment to the range of objectives, when compared with respondents for non-RSD communities.
Table 6.11 Perceptions of own organisation and other organisations demonstrated commitment to a range of service reforms, RSD versus non-RSD (%)
|
Always |
Most of the time |
Some of the time |
Never |
Don't know |
||||||
|---|---|---|---|---|---|---|---|---|---|---|
|
RSD |
Non-RSD |
RSD |
Non-RSD |
RSD |
Non-RSD |
RSD |
Non-RSD |
RSD |
Non-RSD |
|
|
Q12: Own organisation's demonstrated commitment to… |
||||||||||
|
Improved access to services |
70 |
60 |
20 |
32 |
7 |
6 |
2 |
2 |
2 |
0 |
|
Improved delivery of services |
72 |
60 |
20 |
30 |
5 |
8 |
2 |
2 |
2 |
0 |
|
Community capacity to engage with services |
71 |
60 |
17 |
26 |
7 |
10 |
3 |
4 |
2 |
0 |
|
|
Q13: Other organisations demonstrated commitment to… |
|||||||||
|
Improved access to services |
9 |
10 |
50 |
38 |
34 |
44 |
1 |
0 |
6 |
8 |
|
Improved delivery of services |
9 |
10 |
47 |
40 |
37 |
42 |
1 |
0 |
6 |
8 |
|
Community capacity to engage with services |
10 |
6 |
43 |
48 |
37 |
38 |
3 |
0 |
7 |
8 |
Q 12 n=197 for RSD communities, n=50 for non-RSD communities
Q 13 n=194 for RSD communities, n=50 for non-RSD communities
Source: RSD Service Provider Survey data.
Level of understanding, collaboration and communication between organisations and between local service providers
Respondents in general were more positive about the roles and responsibilities of their organisation in comparison to those of other organisations, and more than one third thought collaboration and communication was effective ‘most of the time’. A smaller proportion thought relevant information was shared openly. Figure 6.4 shows:
- Roles and responsibilities of their own organisation were viewed as clear ‘always’ by 43 per cent of respondents, and ‘most of the time’ by 43 per cent.
- Roles and responsibilities of other organisations were viewed as clear ‘some of the time’ by 45 per cent, and ‘most of the time’ by 43 per cent.
- Communication between local service providers was seen as generally effective ‘some of the time’ by 56 per cent, while 37 per cent said it was generally effective ‘most of the time’.
- Relevant information was seen as openly shared between local service providers ‘some of the time’ by 61 per cent, ‘most of the time’ by 26 per cent, and ‘never’ by nine per cent.
- Organisations involved in delivering services were viewed as working collaboratively with the local community ‘some of the time’ by 51 per cent, and ‘most of the time’ by 37 per cent.
Figure 6.4 Perceptions of current communication, coordination and collaboration (%)
.JPG)
n for each question varied between 276 and 279
Source: RSD Service Provider Survey data.
Level and type of community engagement by their own service
Based on responses to six listed forms of community engagement, the one performed most ‘often’ by the respondents service was ‘consult with local community members’ (78%), followed by ‘consult with local leaders’ (71%), ‘attend community meetings’ (53%), ‘attend meetings of a local reference group’ (50%), ‘attend local council meetings/local board meetings’ (42%), and ‘use a local Indigenous interpreter’ (28%). (Figure 6.5)
There was little difference between RSD and non-RSD responses in terms of use of interpreters (29% for RSD versus 32% for non-RSD). The proportion of RSD respondents, who consulted ‘often’ with local leaders (74%), and with local community members (81%), was slightly higher than the non-RSD respondents (64% and 74% respectively).
Figure 6.5 Perceptions of own service’s level of community engagement (%)
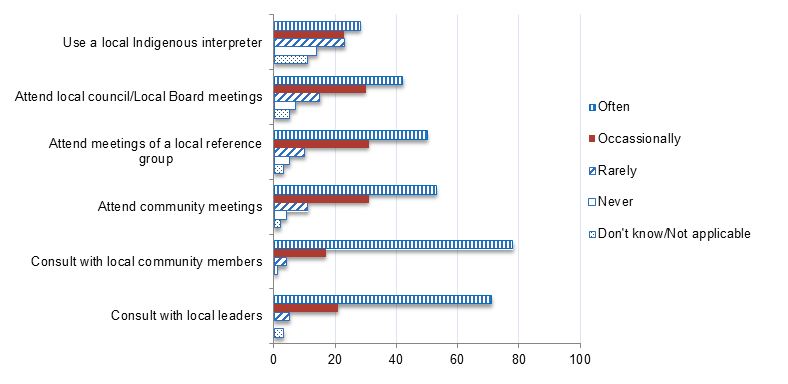
n=275
Source: RSD Service Provider Survey data.
6.3.4 Barriers, enablers and future priorities
This section presents the results from a series of open-ended questions that asked respondents to document what they saw as barriers and enablers relating to efforts to improve service delivery. A number of themes were identified in the responses and are summarised here. The section concludes with the key themes that emerged on future priorities for RSD communities and on changes that would support future RSD (or similar) reform measures.
Barriers
In an open-ended question, respondents were asked to identify what barriers inhibit the ability to improve service delivery in this community. A total of 253 participants responded. There were mixed views with most respondents raising a number of barriers within a single response. The most common barriers to service delivery that were identified include:
- funding
- lack of collaboration
- lack of infrastructure
- staff retention
- remoteness
- lack of resources
- relationships, including community engagement
- need for community empowerment and local ownership
- lack of culturally appropriate service delivery
- red tape.
The most common barrier mentioned was the lack of available funding, including budget cuts and the inflexible and competitive nature of funding (16%). In particular, short-term funding was seen by some respondents as inhibiting the ability to deliver longer term outcomes and services. Examples of responses that referred to funding as a barrier included:
Too many different service providers with many of them competing for same funding
Short-term funding inhibits the ability to provide a longer term program provision. We need to encourage longer term contracts and establish a communication information hub in communities that actually identifies what is being rolled out if and how they may be supported and communicates the message out to try and prevent reinventing all over!
This was closely followed by a lack of collaboration as a barrier to improving service delivery (15%). Respondents indicated a need for more collaboration between service providers, between governments and with the community. The specific issue of duplication of services due to a lack of collaboration between service providers is illustrated by the following response:
Too many services, duplications, and there is no clear direction, what services is doing what, a lot of services are doing exactly what the other service is doing, too many fly in fly out services and community are not getting any benefit from all of these services, services are not working together for the betterment of community, outside organisation that comes in this community they spend only 2 hours a fortnight for community, 4 hours travelling 1 hour break - community miss out.
Respondents cited a common reason for poor collaboration as a lack of communication, between services, between government, and with communities, with comments such as the one below:
Lack of formal collaborative working arrangements - e.g. case management protocols, lack of willingness of some services to work collaboratively, infrequent service provider meetings, staff turnover of both our staff and other service staff.
Lack of infrastructure, in particular the lack of available housing for staff and visiting service providers, was another common barrier raised by 15 per cent of the respondents.
Difficulties associated with staff retention were cited by 13 per cent of respondents as a barrier to service provision, with a number of respondents underlining the need for suitably experienced, skilled and qualified staff. This was closely followed by, and possibly linked to, the issue of remoteness and isolation of communities (12%).
The need to build better relationships with other service providers and/or with the community was raised by nine per cent of respondents. Impediments to relationship building cited by the respondents included high staff turnover, difficulty recruiting suitably skilled or qualified staff, staff attitudes and community mistrust, the difficulty in building trust and relationships with intermittent service provision (fly-in-fly-out nature of some services), and limited transport options e.g. infrequent flights and poor road conditions.
Respondents also saw the lack of resources including financial resources, facilities (e.g. office space, phone, internet access, vehicles), and personnel/human resources as a barrier to effective service delivery (8%). Examples of responses included:
The lack of resources to address the chronic issues within the community, including drug use. Government cuts that impact on staffing and budgets and the building of further government housing.
There is no one independent centre like a Resource Centre/Library which can underpin the educational programs in place in schools and TAFE and support the wider community that may not be engaged in educational programs and also provide after-hours access for students. There is a great need for computer and information access across the community-computers, books, newspapers and magazines. Notice Boards with relevant community information-not the Shire and not the Visitors centre or IGA notice board-this needs to be independent and run professionally!
Another perceived barrier relates to the need for community empowerment, local ownership and community driven approaches to service delivery (8%). Some of the responses indicated that community leadership, community governance and capacity issues were seen as a barrier to improving service delivery. A number of respondents also underlined the need for more employment opportunities for local people.
A related barrier raised in seven per cent of the responses is the perceived lack of culturally appropriate service delivery models, and the inflexible nature in which services are delivered in remote Aboriginal communities. One service provider commented:
(there should be) enough flexibility available to be able to take a common sense approach to how issues manifest in the remote Aboriginal context.
The issue of ‘red-tape’ and inflexible government policies were raised as a barrier by over seven per cent of respondents, with one respondent stating:
Lack of proactive approach to service delivery limited by very high delegations whereby even routine decisions need to be approved by several layers taking up significant time and the community loses interest by then.
In response to the question about perceived changes in service delivery in the past three years, some of the negative comments echo many of the views expressed about barriers, such as:
- lack of accommodation
- increased availability of home brew since closure of tavern
- total lack of animal management as funding was handed back due to lack of skills/didn’t want to deal with it
- rapid changeover in Community Development Employment Project managers (six in three years); lack of understanding of job services contract
- having bureaucrats making the decisions now is no different to pre-RSD
- period post intervention where leases needed renegotiation caused a large amount of work, confusion and an inability to progress plans in an environment of uncertain tenure
- high leadership turnover
- little had changed in terms of quality of life for Aboriginal people despite alcohol bans - community says problems are now more underground
- too much fly in/fly out.
Enablers
Respondents were also asked to specify what enablers or factors help with improving service delivery in the nominated community. A total of 236 participants responded, with most respondents raising a number of factors within a single response. The common enabling factors to effective service delivery included:
- effective collaboration and coordination
- established relationships with community and service providers
- community based services
- services tailored to local needs
- community driven decision making and services
- staff retention
- funding
- employment of local people.
The most common enabling factor raised by the highest proportion of responses (30%) was related to effective collaboration and coordination between service providers, government and the community. Respondents gave examples of effective coordination and collaboration through a range of mechanisms, which included:
- cross agency meetings
- coordinated meetings and service delivery visits
- having a shared outcomes focus to service delivery, planning and programme/policy development and implementation
- taking a collaborative, cohesive and partnership approach to funding services and programmes
- sharing information, with better communication and meaningful engagement, including involvement of IEOs.
Comments included:
That we all work collaboratively. We formed a service providers group in 2011 so that we all share common understandings of what is happening in our community.
Effective co-ordination of services; Co-ordination of funding so that the focus is on what the community needs and how each department can help with the overall plan rather than a focus on what each department provides and how this might be spent in the community; Empowering community structures that bring resident consumers and providers together to solve problems on the ground and advocate for the community at higher levels; Land tenure reform (more land available for housing); Education around how government works and how to get the best out of government (promote the idea of agency within the local/state/national system).
The second most common enabling factor for improved service delivery (raised by 17% of the respondents) was established relationships with community and service providers. Comments noted a range of factors that support this such as treating people with respect; long-term working relationships; service providers willing to go the extra mile (take the extra time); and ongoing commitment and accountability. A small number of respondents also specified the benefit of having a mandate at district and ministerial levels.
More than 11 per cent of the respondents indicated that having services based within the community was helping to improve service delivery. Ten per cent of the respondents identified service delivery models and tailoring services to meet local community needs as enablers to improving service delivery. The importance of understanding culture and the local community, having local knowledge and being accepted by the community was identified by over eight per cent of the respondents. Flexibility in the way services are delivered, including how programmes are developed, was identified in over five per cent of the responses, with flexible and realistic timeframes also mentioned.
One respondent commented:
Those services that have the approach of being culturally sensitive and culturally appropriate even as simple as using people's Aboriginal Torres Strait Islander name instead of their English name. Those service providers that invite and enable community members to attend meetings, those service providers that ask community's advice, those service providers that listen to community's advice, that do participate in sharing information and working collaboratively are able to respond quicker to an issue that arises; are able to deliver more holistic support and are more trusted by community as they are more accessible. Those services that go out to meet people/introduce themselves to the community and don’t expect people to come to them. Those service providers that make the effort to learn some words of the most commonly spoken language of the community, those service providers that offer lifts to people, those service providers that are kind.
Another common enabling process included encouraging community driven decisions (9%) and locally driven services (13%), through strengthening community involvement and having input from local community leaders and community. There were some responses indicating a need to better identify who is integral to local community governance and decision making. Comments also indicated a need for more whole-of-community input to community decisions (with specific mention by a few respondents of youth strategies), and the need to share information and consult with the wider community. Stakeholder engagement to build community capacity was suggested as an enabling factor by three per cent of respondents.
An enabler identified by eight per cent of the respondents was effective staff retention, investment in staff through training, support, allowances, incentives and improved work conditions, such as improving housing availability for outreach service provision. A smaller number of respondents (4%) also suggested that having qualified, skilled and committed staff is a factor that enables improved service delivery. Funding is viewed as a factor, with seven per cent of responses indicating more programme funding would enable better service delivery, as would investment in roads, housing and service buildings/facilities. Another enabling factor was the employment of local community people, and an increase in Indigenous people working in the delivery of services, as was indicated by over six per cent of the respondents.
Future priorities
Participants who were responding about a RSD community were asked what could be changed to better support RSD or similar reform measures in the future. There were 119 responses to this open-ended question, and the following five key themes emerged:
- community ownership
- government coordinators
- concrete outputs and accountability
- LIPs
- length of commitment.
The most common theme (18%) was the need for improved or greater community ownership/input/governance, and to a lesser extent, engagement:
More involvement of local people from ALL walks of life, not just the same, chosen few.
More capacity building around leadership and governance will improve the effectiveness of empowering communities to take control of their own future.
The second most common theme relates to GBMs/GECs/RSD co-ordinators and IEOs. A considerable proportion of responses (12%) specifically referred to GBMs/GECs/RSD co-ordinators. Most of these talked about the need for more clearly defined roles, support for those who are doing a good job, and reducing the staff turnover. More training and career development was suggested for IEOs. An example follows where the respondent was happy with the current GBM, but was critical of the turnover and of the disproportionate number of service providers:
We have good GBM who has been here for a number of years, they are often moved on too quickly and not given enough time to understand community and build relationship. There are too many service providers, they are too specialised for small remote communities and too hard to co-ordinate and communicate. Means they live outside community and fly-in and fly out.
A total of 11 responses (9%) emphasised the need for more concrete or practical outcomes, and seven (5%) referred to a greater need for accountability of certain services, or implementation of the initiative:
Better management and leadership, and accountability at a local and regional level. Greater familiarity with plans and strategies and commitment to support their implementation. Greater emphasis and commitment to actually implementing client centred care, rather than just planning and talking about it. A move away from a tick the box mentality. Efforts to address low morale and increase social capital within teams and organisations.
The LIPs were mentioned in 11 responses (9%) as a good idea that was not necessarily well-implemented. More generally, several respondents noted a lack of ‘teeth’, an absence of any mechanism to ensure government acted on the plans:
LIPs more specific. LIPs more representative of what community wants vs. what government wants. Better allocation of actions to agencies, reminders to agencies about their commitment to the LIPs and RSD - increased engagement by all parties (e.g. local government, community members). Continuity of RSD and LIPs - a long-term commitment required to achieve change.
Other suggestions included the need for a longer-term commitment, more flexible access to funding, and more skilled staff and resources. One respondent raised the issue of RSD site selection:
RSD sites on APY Lands - not sure on what indicators target communities were chosen, seems to have created a divide between the haves and have nots in local population's mind. Also seems the GBMs are often away tied up with reporting/commitments to head office. Also would like more easily accessible information about progress of RSD sites against indicators.
General priorities raised by respondents for the future included:
Local people to lead and govern on their own community
Funding for ongoing literacy and numeracy programmes
Employment is the key changer for social problems; anything that can provide real jobs
Employing local people rather than outsiders
Programmes for unemployed. Hands on education for parents. Skills education.
6.3.5 Comparison with CYWR survey
The four Cape York RSD communities - Aurukun, Hope Vale, Mossman Gorge and Coen - are both RSD communities and CYWR communities. This survey was not conducted in the four CYWR communities as service provides participated in a similar survey in 2012 as part of the CYWR evaluation. However, it is possible to provide a comparison of findings between this survey and the CYWR survey where comparable questions were asked in both surveys. It is important to note that the samples of the two surveys are somewhat different, for example, a greater proportion of respondents in the CYWR survey worked in the non-government sector and local government, more Indigenous people participated in that survey (27%), and a lower proportion (41%) lived in the community for which they answered questions. More detail on the CYWR survey can be found in a separate report.[281]
Perceptions of the CYWR trial compared to the NPA RSD
Findings from earlier qualitative research and surveys to evaluate the CYWR trial, undertaken with both local residents[282] and survey providers, found that the CYWR trial had far more visibility and significance in the four Cape York communities than the fact the communities were designated RSD communities.
The CYWR survey involved service providers who worked in the four communities of Aurukun, Coen, Hope Vale, and Mossman Gorge. The majority of respondents in the CYWR survey (70%) said the trial had been beneficial, compared to the 53 per cent of respondents in 25 RSD communities, who said the NPA RSD was beneficial.
When the objectives viewed as ‘very important’ in the CYWR survey were compared with the results from the current survey, it was evident that the CYWR respondents placed more emphasis on individual responsibility (86% CYWR vs. 77% RSD) and family responsibility (86 % vs. 81%), and re-establishing Indigenous authority (76% vs. 57%) compared to respondents in the RSD survey. Conversely, more RSD respondents identified improving services as very important compared to CYWR respondents (83% RSD vs. 78% CYWR).
Perceptions of changes in key outcome areas
Compared with responses from the RSD survey, the CYWR service providers were more positive about perceived changes in outcome areas. In the CYWR communities, out of the total sample, 67 per cent said more ‘children were going to school’ (compared with 26% in the current RSD survey); 42 per cent said more ‘high school kids were going to boarding school’ (compared to RSD 20%); 42 per cent said more ‘families were managing their money well’ (compared to RSD 7%); 41 per cent said there were more ‘local people in paid jobs’ (compared to RSD 27%); and 38 per cent said that ‘looking after houses’ had improved (compared to RSD 19%).
In the CYWR survey, the most common responses to a list of social problems found that they were ‘about the same’, with the proportion ranging from 35 per cent to 45 per cent. A higher proportion of CYWR respondents said there was less ‘drinking of alcohol’ (26%), less ‘fighting in or between families’ (24%), and less ‘vandalism’ (29%), than those who said these problems had increased. Respondents in the RSD communities where more likely to say various social problems were ‘about the same’ (from 35% to 45%), but fewer respondents said there were less ‘social problems’ than those who said they had increased.
Service delivery – engagement, coordination and staffing
More than half of the CYWR respondents (52%) said their own service’s engagement with local community had improved (compared to 65% of the RSD respondents), 20 per cent said it had not changed (compared to RSD 24%) and 27 per cent said they ‘did not know (compared to RSD 11%). This contrast means that a greater proportion of the RSD respondents believed that in the past three years their service has changed the way it engages with the local community, compared to the number of CYWR service providers.
When comparing responses between the CYWR and RSD surveys in relation to coordination and collaboration between service providers, there was a similar distribution of the responses. The only noticeable difference between the CYWR and RSD surveys was that the CYWR respondents were less likely to say that the roles and responsibilities of other organisations were clear, and were more likely to say that information was shared openly and frequently between service providers.
In both the CYWR and RSD surveys the most common forms of community engagement by the respondents’ own services, were ‘consultation with community leaders’ and ‘consultation with local community members’. However, CYWR respondents were less likely to indicate that their service ‘used a local Indigenous interpreter’, or ‘attended local council meetings’ or ‘local advisory group meetings’.
The CYWR respondents were less likely to view the recruitment of appropriately skilled or experienced staff as a ‘big’ issue, than service providers in other communities (45% compared with 69% RSD, 80% non-RSD). A similar proportion of the RSD and CYWR service providers viewed staff retention as a ‘big’ issue (51% for CYWR communities and 55% for RSD communities), both of which were less than the non-RSD communities (70%).
6.4 Conclusion
The general conclusion from the survey is that, although the NPA RSD has been in place for only three years, service providers are already seeing some benefits. It is clear from the ‘don’t know’ responses that a considerable proportion of respondents did not know about or did not feel able to comment on the efficacy of the RSD and its elements. However, the majority of respondents (69%) who knew about the RSD believed it was beneficial. In particular people thought that services had increased since the start of the RSD, which was a specific objective of the NPA RSD. In key outcome areas, however, there was less indication of change as a result of RSD. Local community governance and leadership was seen by half of the respondents as about the same as three years ago. Similarly, various social problems and outcome areas associated with the ‘Closing the Gap’ objectives were most commonly seen as about the same. However, as it is unrealistic to expect significant change in just three years, these results should be interpreted in the context of the time scale of the RSD.
The SGI was perceived to be quite effective in improving community engagement. The stand outs were the IEOs and GBMs, with both being perceived as effective by 57 per cent of the respondents. In relation to coordination of services, respondents were more positive about the role of local coordinators (GBMs etc.) than they were about the ROCs. Further support and skills development for GBM positions was suggested by survey respondents.
Responses suggested that if processes such as LIPs and LRGs are to be effective mechanisms for community engagement, then they need to involve a good cross section of community representatives, and also need to have tangible short-term shared outcomes that are communicated to all stakeholders. A renewed commitment to the employment of local people and community-driven services was a key priority that emerged from respondents’ comments, which will contribute to and benefit from efforts to enhance governance and leadership.
In various places in remote Australia there are some changes for the better - including access to and coordination of services - and the changes certainly seem more pronounced in RSD communities. However, from a local service provider perspective, there continues to be a range of challenges in remote service delivery. In their responses and comments, respondents were in effect arguing for an ongoing focus on the original objectives of the RSD initiative, which aim for:
- effective collaboration and coordination between service providers, government and the community
- establishing and maintaining well-established relationships between services and with the community
- community based services, community driven decisions and local driven services, and increasing the number of Aboriginal employees delivering services to Aboriginal communities
- flexibility in service delivery and tailoring service delivery models to meet local community needs.
7 Outcomes
7.1 Introduction
This chapter examines trends in outcomes for the Remote Service Delivery (RSD) communities. The National Partnership Agreement on Remote Service Delivery (NPA RSD) is intended to contribute to the COAG objective to close the gap between life outcomes for Indigenous and non-Indigenous Australians. Under the National Indigenous Reform Agreement (NIRA), the Council of Australian Governments (COAG) committed Australian governments to six high level ‘Closing the Gap’ targets across seven ‘building blocks’.[283] The seven building blocks are early childhood, schooling, health, healthy homes, safe communities, economic participation and governance and leadership. The indicators are presented under six of these building blocks. Governance and leadership is not covered as there are no relevant quantitative outcome indicators.
The performance indicators were intended to be selected in connection with the development of the Local Implementation Plans (LIPs). While significant progress had been made, not all indicators were finalised at the time of the 2013 Implementation Review[284]. The outcome indicators used in this evaluation are consistent with those specified in the performance measurement framework agreed in the Implementation Review. [285]
In making an assessment of progress care is taken wherever possible to establish whether any change is statistically significant. This is essential otherwise changes that may reflect statistical noise could be incorrectly treated as being meaningful changes.
Importantly, we need to consider what could realistically be expected in the timeframe. A key element of the NPA RSD is the Local Implementation Plans (LIPs) and many of these plans were not in place until the latter half of 2010 or 2011. Much of the outcome data show trends up to 2011 for the Census of Population and Housing – Australian Bureau of Statistics (the Census) data or 2013 for other data. This is a limited time frame in which the NPA RSD could have affected outcomes. While the outcome data are important they need to be read in conjunction with the rest of the evaluation, particularly the evidence on how the NPA RSD has affected the coordination and operation of services. The high–level logic frame (discussed in Chapter 2) indicates that after two or three years the nature of change that might be expected would largely concern access to and use of services. Generally it is too soon to see changes in most outcomes and the data in this chapter provide a picture of the level of need in RSD communities which may be used in the future to assess progress.
There are also limits on the attribution of causality and data availability, privacy restrictions regarding publication of small numbers and limits on options for comparisons. The sources of data for indicators and particular issues in interpreting trends are also described.
7.1.1 Limitations of the data
The data available has some unavoidable limits which are particular to some sectors. As an example, we use police data on incidents or offences where data on the actual level of crime are lacking. While useful, police data do not provide a full picture, as much crime is not reported to police. The most valid way to analyse changes in the underlying level of crime is using crime victimisation surveys. Unfortunately, such surveys are rarely conducted at a community level, so many studies in Australia and overseas use police data to analyse trends in crime over time.
Attribution and causality are important issues in evaluation. The NPA RSD was conducted within the context of the broader COAG reform commitment to collectively close the gap in Indigenous disadvantage. Therefore isolating the effect of the NPA RSD is simply not possible with any precision. We have attempted to address this significant limitation by a range of in-depth comparison over time, by community, and with non-RSD communities.
Compiling community-level outcome data, while useful, provides only limited information on policy effectiveness. Aggregate outcome data are influenced by many factors which may not relate to either the NPA RSD or other policies. Even so, this chapter provides a valuable picture of trends in outcomes across the RSD communities to date. We now have a great deal of information about these 29 communities, probably more than we have had in the past.
Data about individuals who are assisted by services are not available for most indicators covered in this chapter. However, data were available about early childhood development for children who attend schools in RSD communities. This allowed more detailed analyses on statistically significant differences over time. For all other outcome variables, changes are observed only at the community level, and where possible an aggregated average across all 29 RSD communities can be computed and compared.
Comparisons have been used where available to examine the extent of change in RSD communities. Where possible, differences were investigated by comparing a pre-RSD implementation period with a post-RSD implementation time period. Trends in RSD communities were also compared to comparable non-RSD areas to check if differences observed in the RSD communities over time appear to be unique to the RSD communities or reflect broader trends occurring in remote Australia. It is very important to avoid the risk of attributing changes that are part of a broader trend to the NPA RSD.
One option for making this comparison would have been to choose a small number of comparison communities in each RSD jurisdiction and monitor whether change differs from any change in comparison communities. This approach is useful in some contexts, but care is required as trends in the comparison communities may themselves be unusual. For this chapter a pragmatic approach has been adopted, where we have compared outcomes with readily available data for similar areas and broader regions. In some instances this involves comparisons with other non-RSD communities. This pragmatic approach reflects variation in data availability at different levels of geography. As an example, while police data are available for individual RSD communities, hospitalisation data are not available below the Statistical Local Areas (SLA). [286]
7.1.2 Selection of outcome indicators used in this chapter
As discussed above, the chapter generally uses the indicators specified in the performance measurement framework, grouped under the COAG building blocks. The selection of outcome indicators was guided by the NPA RSD, and shaped by the availability of data. Paragraph 22 of the NPA RSD states that ‘this proposal is part of COAG efforts to address the six targets essential to closing the gap in Indigenous disadvantage’ – for this reason we have reported, wherever possible, on data for the Closing the Gap targets. However, it is not conceptually possible to report on progress against some of the Closing the Gap targets such as life expectancy for small communities. Where this is the case we report against related indicators.
The RSD Implementation Review[287] described the intended approach to a performance measurement framework. These data are intended to allow for changes in outcomes in each location to be analysed and reported based on a national set of core outcomes data for every location. This allows for nationally consistent analysis of progress. The RSD Implementation Review also states that the core national outcomes data should be aligned to the broader Closing the Gap agenda and will be organised by COAG Building Block.[288]
Paragraph 23 of the NPA RSD states that: ‘under this proposal, performance benchmarks and indicators will differ from location to location. Performance indicators and benchmarks will be developed as part of the process of developing Local Implementation Plans’. Indicators were not developed as part of the LIPs, however, in the NT and WA high level performance indicators were agreed.[289] Most of these agreed indicators are the same or similar to those used in the baseline mapping reports and to the indicators that are specified in the NIRA.
The COAG six high level Closing the Gap targets and six ‘building blocks’, under the NIRA, guide the selection of indicators, however other data are readily available regarding community wellbeing. Health, for example, has wide range of data about communities or similar geographic areas, covering service use such as disability and treatment for alcohol and other drug use, primary health care data about potentially preventable hospitalisations and avoidable deaths, and health status and outcomes like low birth weight babies, hospitalisation rates for dialysis or assault and alcohol-related conditions, and mortality. While extensive, there remain gaps in coverage, such as data at local health clinic level which could make a valuable contribution in the near future.
Four of the Closing the Gap targets are measurable by community with available data and so are reported in this chapter (see Table 7.1). Other indicators of progress are reported which provide trends over time and where data are available for the RSD communities.
This chapter reports on eleven topic areas and around 30 indicators, which together provide a rich picture of social and economic wellbeing (see Table 7.1). The final set emerged through a process of establishing what was available at community level for all jurisdictions, in collaboration with the five participating jurisdictions, whose agreement was required to obtain data. Some indicators in the NIRA are not available at the community level; this is because surveys are either not conducted in remote communities or do not collect large enough sample sizes to be usable.
The advantages of this set of indicators are that they are agreed to by jurisdictions and comparable across communities and provide reasonable trends across time. It takes considerable effort to select and test the usability and availability of indicators at the community level and we hope that this set of indicators can be used in the future to provide longer-term trends.
Table 7.1 Sources of indicators by building blocks, noting Closing the Gap targets *
|
Building block |
Indicators |
Source |
|---|---|---|
|
Early childhood |
Early childhood education preschool program enrolment* Australian Early Development Index (AEDI) of school readiness |
ABS National Early Childhood Education and Care Collection, compiled from jurisdictions administrative systems, unpublished data Australian Early Development Index, unpublished data |
|
Schooling |
Reading, writing and numeracy achievement, National Assessment Program – Literacy and Numeracy (NAPLAN) tests* School attendance, primary and high school attendance Year 12 or equivalent, attainment rates for students aged 20 to 24 years*, same for adults aged 20-64 and Completion of post school qualifications |
My School website Compiled from jurisdictions administrative systems 2011 Census of Population and Housing |
|
Health |
Indicators of service use include disability and aged care, child protection, juvenile justice and treatment for alcohol and other drug use. Primary health care indicators include potentially preventable hospitalisations and avoidable deaths. Health status and outcome indicators include low birth weight babies, fertility rates, hospitalisation rates overall and by selected causes, and mortality. |
Compiled by the Australian Institute of Health and Welfare (AIHW) from a range of jurisdictions’ administrative systems |
|
Healthy homes |
Overcrowding and severe overcrowding |
2011 Census of Population and Housing |
|
Safe communities |
Police-recorded incidents and/or offences |
Compiled by the Australian Institute of Criminology (AIC) from Police administrative systems from jurisdictions |
|
Economic participation |
Employment rate for non-Community Development Employment Projects (CDEP) employment* Welfare dependence – income support and CDEP Wages Employment assistance – Job Services Australia (JSA) |
2011 Census of Population and Housing Australian Government administrative systems Australian Government administrative systems |
* Closing the gap targets
Key findings for each of the eleven topics are provided at the start of each section. The chapter is based on material from a wide range of sources including the Census, other national collections and Australian Government and jurisdictions administrative systems. The Australian Institute of Health and Welfare (AIHW) collated material on health and Australian Institute of Criminology (AIC) collated material on crime from a range of systems.
7.2 Early childhood
7.2.1 Access to preschool programmes
Key findings
Preschool programme participation in RSD communities is high, with 95 per cent of the eligible Indigenous population enrolled in early childhood education. In 2012, 550 Indigenous children aged four or five years old living in RSD communities were enrolled in an early childhood education programme. This is higher than the Indigenous rate of enrolment in a preschool programme in remote Australia, which was 88 per cent in August 2012.
Preschool program participation
Given that participation in early childhood education is voluntary, the target for the achievement of universal access, which is also the Closing the Gap target, is 95 per cent enrolment of eligible children living in remote areas in the year before full time school.
From the available data, the former DEEWR reported that there were 550 Indigenous children aged four or five year’s old living in RSD communities who were enrolled in an early childhood education program in 2012. This represents 95 per cent of the eligible population.[290] This means that the target of 95 per cent of enrolled Indigenous children across remote areas to attend a quality early childhood education program in the year before they start fulltime school, has been met within the RSD communities.
This is higher than the Indigenous rate of enrollment in a preschool programme in the year before full-time schooling in remote Australia. The new National Early Childhood Education and Care Collection[291] show that this was 88 per cent in August 2012.[292] While this is lower than the estimate for 2011 of 91 per cent[293], this apparent fall represents improvements in data quality (such as the removal of duplicate records). Substantial improvements have been made in the quality of data in the National Collection since the initial collection in 2010. The data are more consistent and comprehensive and enable a clearer picture of preschool participation for all children, including Indigenous children living in remote communities.
In addition, a goal of the NPA on Universal Access to Early Childhood Education is to increase the number of university qualified early childhood teachers. There were 34 teachers with a three year degree qualification or higher, teaching a preschool program in the RSD communities in 2012.[294] This seems encouraging, given the challenge of attracting qualified teachers to remote locations.
Table 7.2 lists all of the available preschool programs in the RSD communities. Of the 29 RSD communities, two (Walgett and Wilcannia) have more than one preschool program.
Table 7.2 All preschool programs available in the RSD communities, 2012
|
Community |
Location of preschool |
|---|---|
|
Amata |
Amata Anangu Child Parent Centre at Amata School – Preschool to Year 12 |
|
Angurugu |
Angurugu School – Preschool to Year 12 |
|
Ardyaloon |
One Arm Point Remote Community School |
|
Aurukun |
Cape York Aboriginal Australian Academy Aurukun Campus – Pre-prep to Grade 7 |
|
Beagle Bay |
Sacred Heart School – Kindergarten to Year 10 |
|
Coen |
Cape York Aboriginal Australian Academy Coen Campus. Pre-prep to Grade 7 |
|
Doomadgee |
Doomadgee State School – Pre-prep to Grade 10 |
|
Fitzroy Crossing |
The Fitzroy Valley District High School – Preschool to Year 12 |
|
Galiwinku |
Shepherdson College – Preschool to Year 12 |
|
Gapuwiyak |
Gapuwiyak School – Preschool to Year 12 |
|
Gunbalanya |
Gunbalanya Primary School – Preschool to Year 12 |
|
Halls Creek |
Warlawurru Catholic Primary School – Preschool to Year 7 |
|
Ntaria (Hermannsburg) |
Ntaria School – Preschool to Year 12 |
|
Hope Vale |
Located at Cape York Aboriginal Australian Academy Hope Vale Campus, pre-prep to Grade 7. George Bowen Memorial Kindergarten – Kindergarten and pre-prep programs for 3.5 to 4.5-year-olds |
|
Lajamanu |
Lajamanu School – Preschool to Year 12 |
|
Maningrida |
Maningrida School – Preschool to Year 12 |
|
Milingimbi |
Milingimbi School – Preschool to Year 12 |
|
Mimili |
Mimili Anangu School |
|
Mornington Island |
Mornington Island State School – Preschool to Year 10 |
|
Mossman Gorge |
Mossman township – Mossman Community Kindergarten |
|
Nguiu |
Murrupurtiyanuwu Catholic Primary School – Preschool to Year 6 |
|
Ngukurr |
Ngukurr School – Preschool to Year 12 |
|
Numbulwar |
Numbulwar School – Preschool to Year 12 |
|
Umbakumba |
Alyarrmandumanja Umbakumba School – Preschool to Year 12 |
|
Wadeye |
Our Lady of the Sacred Heart Thamarrurr Catholic College – Preschool to Year 12 |
|
Walgett |
Birraleegal Goondi Preschool Walgett Community College |
|
Wilcannia |
Barlu Kurli Preschool at Wilcannia Central School – Preschool/Kindergarten to Year 12. St Therese's Community School (Catholic) – Preschool/Kindergarten to Year 2 |
|
Yirrkala |
Yirrkala School – Preschool to Year 12. Yirrkala Homeland School – Preschool to Year 12 |
|
Yuendumu |
Yuendumu School |
Source: ABS National Early Childhood Education and Care Collection 2012 (unpublished data).
7.2.2 Early development assessment
Key findings
The Australian Early Development Index (AEDI) shows there are significant variations between RSD communities in how children are developing as they enter their first year of school. This is based on nine of the 29 RSD communities which have comparable results for both the 2009 and 2012 AEDI collections. Overall there are two significant changes in two domains of early development between 2009 and 2012, one positive and one negative change. There was a decrease in children assessed as vulnerable in the communication and general knowledge domain. However, there was an increase in children assessed as vulnerable in the emotional maturity domain. Positive change in RSD communities does not necessarily reflect a contribution by the NPA RSD, as it mirrors broader trends among Indigenous children in remote and very remote Australia.
The level of vulnerability in RSD communities is much higher than national levels and did not change significantly between 2009 and 2012. Two thirds of Indigenous children in the nine RSD communities for which data are available were assessed as vulnerable on one or more domains, compared to less than one quarter of all children nationally.
Introduction
The Australian Early Development Index (AEDI) can be used to monitor changes in aspects of child development that are associated with the welfare of children, and can predict future health and human capital.[295] It is therefore a useful indicator of progress in early childhood wellbeing.
The AEDI is a population-based measure of how all young children are developing in Australian communities as they enter their first year of formal full-time school. Information for the AEDI is collected through a teacher-completed checklist that measures five areas of early childhood development: (i) physical health and wellbeing, (ii) social competence, (iii) emotional maturity, (iv) language and cognitive skills, and (v) communication skills and general knowledge. These five areas, or domains, are closely linked to the predictors of adult health, education and social outcomes.[296]
There have been two comprehensive collections of the AEDI to date: the first in 2009 (with some supplementary data from 2010)[297] and a second collection in 2012. The AEDI results for each of the five domains assessed are classified as ‘on track’, ‘at risk’ or ‘vulnerable’ in that domain.[298]
This section analyses the AEDI results of two groups of children: those who started formal full-time school in 2009 and those who started in 2012. It also compares the AEDI assessments for the children in RSD communities in relation to national level and state/territory data and includes analysis of Indigenous children and non-Indigenous children.
The NPA RSD was signed in January 2009 although the key elements of the NPA RSD did not commence until the 2009–10 financial year. Hence we interpret the 2009 AEDI data as representing outcomes before RSD and the 2012 AEDI results as outcomes after the implementation of RSD.[299]
Analysis of RSD cohorts
Only nine of the total of 29 RSD communities can be reported here, as only nine have comparable results for both the 2009 and 2012 AEDI collections. This is because the regional geography and names of local communities that were separately identified changed between the 2009 and 2012 AEDI collections.[300] Data for the remaining 20 RSD communities cannot be separated out by locality.
The statistical analysis of change in AEDI assessments between 2009 and 2012 can only be carried out for this subset of nine distinctly identified RSD communities (with AEDI results reported at the community level for both the 2009 and 2012 collections).[301] There were 369 Indigenous children in these nine RSD communities assessed in 2009 and a smaller number (290) were assessed in 2012.
The AEDI data show the level of vulnerability in RSD communities is much higher than the national levels. Table 7.3 shows that 66 per cent of Indigenous children in the nine RSD communities in 2009 were assessed as vulnerable on one or more domains. This is much larger than the proportion of all children nationally assessed as vulnerable on one or more domains, which is 23.6 per cent (and 48.5 per cent for Indigenous children nationally).
Almost half (47.9 per cent) of Indigenous children in the nine RSD communities were assessed as vulnerable on two or more domains in 2009. This compares with 11.9 per cent of all children nationally assessed as vulnerable on two or more domains (and 30.5 per cent for Indigenous children nationally).
By 2012 there was no statistically significant change in these measures. The proportion of Indigenous children in these same nine RSD communities assessed as vulnerable on one or more domains increased slightly in 2012 to 67.9 per cent (an increase of 1.9 percentage points which is not statistically significant). The percentage of Indigenous children assessed as vulnerable on two or more domains decreased to 44.9 per cent (a decrease of 3 percentage points, also not statistically significant). The second last column of Table 7.3 notes whether the percentage point difference observed between 2009 and 2012 is a ‘significant change’. This assessment uses the recommended ‘critical difference’ methodology developed for testing statistically significant changes in the AEDI data at community level.[302] [303] This method relies on the absolute value of the observed change being larger than a computed ‘critical value’ (as show in the last column of Table 7.3). The magnitude of changes observed between 2009 and 2012 in the nine RSD communities on the summary measures of vulnerable on either ‘one or more’ or ‘two or more’ domains are too small to be categorized as a significant difference between the two AEDI collections.
Table 7.3 Aggregate data of the proportion of Indigenous children vulnerable on specific AEDI domains for the nine RSD communities identified in both 2009 and 2012
|
Vulnerable on domain |
2009 (%) |
2012 (%) |
Change (2012 – 2009) (percentage points) |
Is change statistically significant? |
Critical value* |
|---|---|---|---|---|---|
|
One or more |
66.0 |
67.9 |
1.9 |
No |
4.5 |
|
Two or more |
47.9 |
44.9 |
-3.0 |
No |
3.3 |
|
Domains: |
|
|
|
|
|
|
Physical health and wellbeing |
31.6 |
35.0 |
3.4 |
No |
4.0 |
|
Social competence |
30.4 |
29.6 |
-0.8 |
No |
2.7 |
|
Emotional maturity |
23.4 |
29.1 |
5.7 |
Yes (worsened) |
3.0 |
|
Language and cognitive skills |
48.5 |
48.6 |
0.1 |
No |
2.9 |
|
Communication and general knowledge |
39.7 |
35.6 |
-4.1 |
Yes (improved) |
3.5 |
* Critical values based on Gregory and Brinkman method.
Source: AEDI unit record data tabulated at FaHCSIA.
There are significant positive and negative changes in specific domains. Comparison of 2009 and 2012 results for the five individual domains (Table 7.3) shows that the percentage of children assessed as vulnerable in the emotional maturity domain increased, but the percentage of children assessed as vulnerable in the communication and general knowledge domain decreased. Both results are large enough to be statistically significant.
National and jurisdictional level results for Indigenous and non-Indigenous children
The overall national and jurisdictional level AEDI summary assessment results provide context for the trends for RSD communities. The analysis below shows that the general improvement seen nationally for all Australian children overall is not consistent across RSD communities.
In 2012, 22.0 per cent of all children assessed nationally were vulnerable on one or more domains (Table 7.4). This proportion represented a slight decrease from the 23.6 per cent of total children in 2009. Children assessed as being vulnerable on two or more domains also shows a small decrease nationally, from 11.9 per cent of children assessed as vulnerable in two or more domains in 2009 to 10.8 per cent in 2012.
For Indigenous children in 2012, the relative percentages of children assessed to be vulnerable are substantially higher than for non-Indigenous children. Among Indigenous children 43.2 per cent were classified as vulnerable on one or more domains and 26 per cent vulnerable on two or more domains. However, this is a significant decrease from the 2009 levels, where 48.5 per cent of Indigenous children were classified as vulnerable on one or more domains and 30.5 per cent as vulnerable on two or more domains.
The broader trend shown in Table 7.4 is a decrease in the proportion of children classified as vulnerable. This indicates a general improvement for both Indigenous and non-indigenous children at the national level.
The national Indigenous data broken down by remote and non-remote areas (Table 7.4), show that this trend is stronger for remote than non-remote locations.[304] The proportion of Indigenous children assessed as vulnerable is consistently higher in remote areas, but over time there have been larger improvements in the AEDI results for Indigenous children in remote compared to non-remote areas. For instance, the proportion of Indigenous children in remote areas vulnerable on two or more domains decreased from 42.5 per cent in 2009 to 36.2 per cent in 2012, while in non-remote areas the decrease was a modest change – from 25.9 per cent to 23.6 per cent.
Table 7.4 Summary AEDI assessments at national level, 2009 and 2012
|
|
Total number of children assessed* |
Developmentally vulnerable on one or more domain/s (%) |
Developmentally vulnerable on two or more domain/s (%) |
||||
|---|---|---|---|---|---|---|---|
|
National results |
2009 |
2012 |
2009 |
2012 |
2009 |
2012 |
|
|
All children |
252,462 |
272,282 |
23.6 |
22.0 |
11.9 |
10.8 |
|
|
Male |
127,253 |
137,119 |
30.3 |
28.2 |
16.3 |
14.8 |
|
|
Female |
125,209 |
135,163 |
16.9 |
15.7 |
7.5 |
6.8 |
|
|
Non-Indigenous |
240,541 |
258,271 |
22.4 |
20.9 |
11.0 |
10.0 |
|
|
Indigenous |
11,920 |
14,011 |
48.5 |
43.2 |
30.5 |
26.0 |
|
|
Remote (Indigenous) |
3,286 |
2,687 |
62.4 |
55.9 |
42.5 |
36.2 |
|
|
Non-remote (Indigenous) |
8,634 |
11,324 |
43.1 |
40.2 |
25.9 |
23.6 |
|
Data reported for 2009 are for the combined Cycle 1 (see footnote 300) data including the 2010 supplementary collection.
* The number of children reported here are children for whom the assessment on whether they are vulnerable on one or more domains could be made. This number varies slightly from the total number of children assessed and also from the number assessed for vulnerability on two or more domains.
Source: AEDI unit record data tabulated at FaHCSIA.
The comparable data by Indigenous status at the state and territory level for the five jurisdictions that contain the RSD communities (NSW, Qld, NT, WA and SA) are shown in Table 7.5. These data show that the gaps between the proportion of vulnerable Indigenous and non-Indigenous students are large in all jurisdictions. However, over time these summary results for Indigenous children have improved in all jurisdictions except for SA.
Some of the observed improvements for Indigenous children are quite large and statistically significant. For instance, in the NT the proportion vulnerable on two or more domains decreased from 50.2 per cent in 2009 to 38.2 per cent in 2012. Significant falls in the proportion vulnerable were also observed in Qld. In contrast, the SA results are higher in 2012 than in 2009 for both Indigenous and non-Indigenous children – however, as there are no SA communities among the nine RSD communities used for the analysis above, we do not know if the trends for SA in general are relevant to the two RSD communities in SA (see Table 7.5).
Table 7.5 Summary AEDI assessments for the state/territory jurisdictions with RSD communities, 2009 and 2012
|
RSD jurisdictions |
Total number of children assessed * |
Developmentally vulnerable on one or more domain/s (%) |
Developmentally vulnerable on two or more domain/s (%) |
|||
|---|---|---|---|---|---|---|
|
2009 |
2012 |
2009 |
2012 |
2009 |
2012 |
|
|
New South Wales |
|
|
|
|||
|
Indigenous |
3,711 |
4,550 |
39.0 |
36.7 |
22.5 |
21.0 |
|
Non-Indigenous |
80,448 |
84,371 |
20.5 |
19.0 |
9.7 |
8.5 |
|
Queensland |
|
|
|
|||
|
Indigenous |
3,462 |
4,152 |
50.8 |
43.0 |
31.3 |
25.8 |
|
Non-Indigenous |
49,841 |
53,842 |
28.3 |
24.9 |
14.8 |
12.8 |
|
Northern Territory |
|
|
|
|||
|
Indigenous |
1,433 |
1,196 |
68.4 |
59.2 |
50.2 |
38.2 |
|
Non-Indigenous |
1,805 |
1,921 |
22.8 |
20.7 |
9.7 |
10.2 |
|
Western Australia |
|
|
|
|||
|
Indigenous |
1,740 |
2,033 |
52.6 |
49.0 |
32.5 |
30.1 |
|
Non-Indigenous |
25,412 |
28,598 |
22.9 |
21.2 |
10.8 |
9.9 |
|
South Australia |
|
|
|
|||
|
Indigenous |
545 |
692 |
49.4 |
51.4 |
32.3 |
35.7 |
|
Non-Indigenous |
14,924 |
16,663 |
21.9 |
22.6 |
10.8 |
11.2 |
Data reported for 2009 are for the combined Cycle 1 (see footnote 300) data including the 2010 supplementary collection.
* The number of children reported here are children for whom the assessment on whether they are vulnerable on one or more domains could be made. This number varies slightly from the total number of children assessed and also from the number assessed for vulnerability on two or more domains.
Source: AEDI unit record data tabulated at FaHCSIA.
The overall national trend cloaks some variation in the extent and direction of change by jurisdiction. This highlights the value of disaggregation of results. However the options for breaking down the data are limited due to the very small sizes of the RSD communities.
While there have been decreases in vulnerability nationally and for Indigenous children in non-remote and remote areas, in the nine aggregated RSD communities assessments of being vulnerable on one or more domains, or two or more domains, did not change between 2009 and 2012. These comparisons support the conclusion that the RSD communities did not share in the general improvement in the AEDI assessments of Indigenous children that occurred in other areas in remote Australia. Among the nine RSD communities used in this analysis, there is substantial variation at the level of individual RSD communities. Several specific RSD communities show large reductions in the summary vulnerability percentages.
Some examples which show large changes can be reported.[305] In Mornington Island the percentage vulnerable on one or more domains decreased by 23 percentage points between 2009 and 2012; and there was an even larger decrease of 45 percentage points in the proportion vulnerable on two or more domains. On the other hand there were communities, such as Fitzroy Crossing and Galiwinku, where the proportion vulnerable on one or more and two or more domains increased between 2009 and 2012. The general improvement seen nationally is not consistent across the RSD communities.
7.3 Schooling
This building block includes school attendance; achievements in reading, writing and numeracy; and targets for Year 12 or equivalent attainment rates. Two of the Closing the Gap targets (listed in Table 7.1) directly relate to the schooling building block.
7.3.1 School attendance
Key findings
There are no overall trends between 2008 and 2012 in the average school attendance in each jurisdiction or by schooling level. However, there are many individual schools where attendance rates have increased over the RSD period. There were significant improvements at Mornington Island and Aurukun in Qld[306] and improvements for primary schools in NSW. However there were small declines across both primary and secondary schools in the NT, and larger declines in SA, particularly for secondary school. WA figures available for 2010 to 2012 show a fall in school attendance in most RSD communities in WA.
Introduction
The aim of this analysis was to look at trends in attendance rates of children enrolled in schools in the 29 RSD communities to identify any changes to attendance rates during the RSD period. School attendance data for the RSD communities were obtained from the relevant jurisdictions. However there are differences between the jurisdictions in the way attendance has been measured and in the time period covered.
Some jurisdictions measure ‘annual’ attendance in reference to a specific period while others report attendance for each school term and these can be averaged into an annual rate. Some jurisdictions have provided attendance data on an annual basis from 2006 to 2012, but others cover shorter periods. The shortest period covered is for WA data which are available only for 2010 to 2012. Also, attendance data are available by the level of education offered (primary and secondary school) for all jurisdictions except Qld. For Qld a detailed assessment of trends in school attendance was provided in the Cape York Welfare Reform Evaluation.[307]
Due to these differences in data it is not possible to present an aggregate picture of attendance across all 29 RSD communities. Comparison of the trends in attendance in the ‘pre-RSD’ and ‘post‑RSD’ is limited to jurisdictions with more comprehensive time series.
Attendance rates by jurisdiction and schooling levels
The section analyses average attendance rates by jurisdiction (Table 7.6). Apart from Qld, the attendance data are reported separately for primary and secondary schools. The average attendance rates are a weighted average of the attendance rate of schools in each jurisdiction. The data are weighted by enrolment number at each school level.[308]
Any possible effect of RSD would be represented by changes between 2008 and 2012. Data for earlier periods prior to 2006 are not reported in Table 7.6. Overall the table provides an impression of little change in average school attendance rates from 2009 to 2012. The overall average school attendance for 2006 to 2012 across jurisdictions and school levels is 58 per cent.
Table 7.6 Average attendance rate by jurisdiction and school level in RSD communities, 2006‑2012
|
|
|
Pre-RSD Years |
RSD Years |
|
|||||
|---|---|---|---|---|---|---|---|---|---|
|
State |
School Level |
2006 % |
2007 % |
2008 % |
2009 % |
2010 % |
2011 % |
2012 % |
Average over RSD period % |
|
New South Wales |
Primary School |
73 |
74 |
81 |
80 |
84 |
86 |
86 |
84 |
|
|
Secondary School |
69 |
64 |
67 |
66 |
73 |
67 |
65 |
68 |
|
Northern Territory |
Primary School |
59 |
59 |
56 |
57 |
52 |
53 |
55 |
54 |
|
Secondary School |
58 |
51 |
49 |
50 |
45 |
46 |
47 |
47 |
|
|
Queensland |
Combined1 |
n.a. |
n.a. |
55 |
63 |
68 |
67 |
63 |
65 |
|
South Australia |
Primary School |
81 |
77 |
71 |
72 |
72 |
68 |
63 |
68 |
|
Secondary School |
68 |
67 |
66 |
59 |
58 |
48 |
54 |
55 |
|
|
Western Australia |
Primary School |
n.a. |
n.a. |
n.a. |
n.a. |
74 |
73 |
69 |
72 |
|
Secondary School |
n.a. |
n.a. |
n.a. |
n.a. |
52 |
48 |
42 |
47 |
|
1 Qld only: combined attendance rates for all levels of education offered by each school.
Source: State or Territory administrative data
In a few cases there have been relatively large declines in the 2012 attendance data, such as for all schools in SA and WA. Results for each jurisdiction with specific examples of individual schools are provided below.
New South Wales
In the NSW RSD communities, school attendance is consistently higher than in other jurisdictions. Across the RSD schools in NSW, the average attendance rate has remained largely unchanged since 2008.
Of the three RSD primary schools, the attendance rate over the RSD period fell by one percentage point at Walgett Community College, increased by four percentage points at St Joseph’s School[309] and increased by 10 percentage points at Wilcannia Central School. Overall, the average primary school attendance rate in the NSW increased 4.3 percentage points from 81 per cent in 2008 to 86 per cent in 2012.
The results differ at the two RSD secondary schools. Wilcannia Central School experienced a fall of 12 percentage points in its attendance rate over the period, while Walgett Community College saw a rise of three percentage points. Overall, the average secondary school attendance rate for these two schools in NSW declined 2.5 percentage points from 67.3 per cent in 2008 to 64.8 per cent in 2012.
Northern Territory
Across the RSD schools in the NT, there has been a decline in average attendance rates since 2008. Of the 16 RSD schools, 11 have seen their attendance rates for primary students fall over the period while five have seen them rise. The largest declines were recorded at Lajamanu School (11 percentage points), Milingimbi School (11 percentage points) and Yirrkala Homeland School (13 percentage points). The largest gains were recorded at Alyarrmandumanja Umbakumba School (11 percentage points) and Maningrida School (12 percentage points). Overall, the average primary school attendance rate in the NT declined from 56.3 per cent in 2008 to 54.5 per cent in 2012.
Results were very similar in the 16 RSD secondary schools: 11 have seen their attendance rates fall over the period while five have seen them rise. The largest declines were recorded at Gapuwiyak School (19 percentage points), Milingimbi School (18 percentage points) and Ntaria School (17 percentage points). The largest gains were recorded at Alyarrmandumanja Umbakumba School (8 percentage points), Gunbalanya School (8 percentage points) and Maningrida School (11 percentage points). Overall, the average secondary school attendance rate in the NT declined 2.2 percentage points from 48.8 per cent in 2008 to 46.6 per cent in 2012.
South Australia
Across the RSD schools in SA, the average attendance rate has declined since 2008. Of the two RSD primary and secondary schools – Amata Anangu School and Mimili Anangu School – both have experienced declines in attendance rates over the period. Amata Anangu School was down six percentage points in primary school attendance and nine percentage points in secondary school attendance. Mimili Anangu School was down 12 percentage points in primary school attendance and 16 percentage points in secondary school attendance.
Overall, the average primary school attendance rate in SA declined 8.6 percentage points from 71.2 per cent in 2008 to 62.6 per cent in 2012. The average secondary school attendance rate declined 12.1 percentage points from 65.6 per cent to 53.5 per cent over the same period.
Western Australia
School attendance rates for RSD schools in WA are only available from 2010 onwards. There has been a decline in attendance rates over this period. Of the five RSD primary schools, four have seen their attendance rates fall over the period while only one has experienced a rise. The largest declines were recorded at Halls Creek District High School (11 percentage points) and Ngalapita Remote Community School (12 percentage points). The only gain was recorded at Sacred Heart School (8 percentage points). Overall, the average primary school attendance rate in WA declined from by 5.4 percentage points 74.2 per cent in 2010 to 68.8 per cent in 2012.
Similar results were recorded in the four RSD secondary schools, where three have seen their attendance rates fall over the period while only one has seen its rise. The largest decline was recorded at Halls Creek District High School (16 percentage points). The gain was recorded at Sacred Heart School (26 percentage points). Overall, the average secondary school attendance rate in WA declined 9.4 percentage points from 51.6 per cent in 2010 to 42.2 per cent in 2012.
Queensland
Across the RSD schools in Qld, there has been an improvement in attendance rates since 2008. Of the six RSD combined schools, three have experienced declines in attendance rates and three have seen a rise over the 2008 to 2012 period[310]. However, the large gains made by Aurukun Campus of Cape York Aboriginal Australian Academy (12 percentage points) and Mornington Island State School (18 percentage points) far outweigh the declines recorded for students from Mossman Gorge attending Mossman State School and Mossman State High School[311] (7 percentage points) and Doomadgee State School (5 percentage points). Overall, the average combined school attendance rate in Qld improved by 7.6 percentage points from 55.4 per cent in 2008 to 63 per cent in 2012, all of the increase occurring between 2008 and 2009.
Additional data on school attendance on selected Qld RSD communities are also available from the final report of the Cape York Welfare Reform Evaluation 2012. In that report unit record data for each student from the four Cape York Welfare Reform communities and selected comparison communities were analysed. The availability of unit record data for each student by school term means that more rigorous statistical tests could be performed to detect statistically significant trends over time.
The key finding was that school attendance rates in Aurukun rose substantially between Term 1 2008 to Term 1 2012 (the latest data available for that report) and this was a statistically significant improvement.[312] The timing of this improvement appears to be related to the intervention of the Family Responsibilities Commission. The improvements observed in school attendance in Aurukun were not a part of a broader trend observed in the other three Cape York Welfare Reform communities, nor was there an upward trend in school attendance rates among all Indigenous communities in Qld. However Aurukun was not the only RSD community in Qld to experience an improvement in school attendance. Attendance rates also increased in Mornington Island – this increase was from 60 per cent in Term 1 2008 to 76.5 per cent in Term 1 2012.[313]
Statistical analyses of school attendance trends in the RSD communities
To check if the apparent trends described above are robust in statistical terms, we analysed the attendance trends across the past five years from 2008 to 2012 using attendance figures for individual schools in the RSD communities.[314] The regression analysis reveals that there is a weak linear relationship in these data indicating there is no real change in school attendance rates across all of the 29 RSD communities in this time period.
The range of attendance levels for individual schools, between 2006 and 2012 varied substantially. The highest annual attendance rate was in Nhulunbuy in 2011 at 96 per cent. The lowest was 23 per cent In Maningrida in 2011. In 2012, the mid-range[315] was between 44 and 62 per cent.
Breaking up the school groupings by jurisdiction or school level does not change the results at all. The goodness of fit remains extremely low and not significant. These results are not surprising given the low numbers of schools concerned. Any changes would need to be very large to attain statistical significance.
7.3.2 Achievements in reading, writing and numeracy
Key findings
There were no statistically significant changes overall in achievement of reading, writing and numeracy[316] for Indigenous students attending schools in RSD communities in Years 3 and 5 between 2008 and 2012. There are substantial variations at school level from year to year in the National Assessment Program – Literacy and Numeracy (NAPLAN) results. These may result from differences across the RSD communities and reflect the volatility of test results with the small class sizes observed in many RSD community schools.[317]
Across Australia the vast majority of all students and all Indigenous students meet national minimum standards (NMS) in NAPLAN. However, results for Indigenous students vary strongly by remoteness areas. The vast majority of Indigenous students in metropolitan areas meet the NMS, most Indigenous students in very remote areas do not meet these standards. In 2012 there are several instances where the proportion of students meeting NMS in Year 3 reading is very low – below 20 per cent.
No consistent trends were found when testing the significance of changes over time in the NAPLAN results for schools in RSD communities. For instance, in results for Year 3 reading there were RSD schools where the percentage meeting NMS increased between 2008 and 2012. On the other hand there were schools where the NMS percentage decreased between 2008 and 2012 or between 2009 and 2012.[318]
Introduction
The NAPLAN is an annual assessment for students in Years 3, 5, 7 and 9. It has been an everyday part of the school calendar since 2008.[319] NAPLAN tests the sorts of skills that are essential for every child to progress through school and life, such as reading, writing, spelling and numeracy. The assessments are undertaken nationwide, every year, in the second full week in May.
NAPLAN results for individual schools are available on the MySchool website. For this analysis data from 2008 to 2012 were obtained for each of the schools in the RSD communities through the Australian Curriculum, Assessment and Reporting Authority (ACARA). Some additional data for the schools in the RSD communities were provided by the state and territory Education Departments for this report and for the earlier RSD community baseline reports.
The main purpose of this section is to document the changes that have occurred in the NAPLAN results of the RSD community schools over the 2008 to 2012 period. It does not seek to attribute any direct causes for the changes observed.
The analysis focuses on the changes in the proportion of students at or above national minimum standards (NMS) among all students in the RSD community schools who participated in the specific NAPLAN tests. A national minimum standard is the minimum level of skill and understanding a student should demonstrate in their particular year of schooling, in a specific subject area or domain. As many of the RSD schools do not offer secondary schooling, this analysis is restricted to NAPLAN results for Year 3 and 5 students in Reading and Numeracy.[320]
Considerable variability from year to year in NAPLAN results for Indigenous students in regional and remote locations is expected at the level of individual school level where the number of children sitting for each NAPLAN test is often small (as low as two or three students). However, this section looks beyond the fluctuating results at specific RSD schools and focuses on detecting if there has been a consistent trend in the NAPLAN results in the proportion of all students at or above NMS across all RSD schools. We test for statistically significant changes[321] in the proportion of students at or above NMS at the aggregate level across all RSD communities, using the full set of data at school level between 2008 and 2012.[322]
Overview of NAPLAN results for remote Indigenous students at national level
To provide some context for the analyses of RSD NAPLAN results, we can look at national results between 2008 and 2012 for Indigenous students attending school in remote or very remote locations.
Of the range of assessments that are feasible (over two test domains - reading and numeracy; four year levels - Year 3, 5, 7, and 9; and two location categories - remote and very remote) there are only two statistically significant improvements in NAPLAN results for Indigenous students: Year 3 reading in very remote locations and Year 7 reading in very remote locations. On the other hand there were two statistically significant declines in NAPLAN results: Year 3 numeracy in remote and very remote areas.
In all other 12 instances the comparison results for Indigenous students indicate no statistically significant change.
NAPLAN data by school in the RSD communities
Examples of the NAPLAN data available at the level of each school in the 29 RSD communities are given in Table 7.7 which shows the proportion of students who meet national minimum standards for Year 3 reading in RSD schools.[323] The table shows considerable year-on-year variability for the individual schools, making patterns over time difficult to assess, especially over short periods.[324]
Table 7.7 indicates the variability of results across the individual schools in a given year as well as volatility over time for a specific school. School level NAPLAN results can be expected to vary considerably from year to year, especially when school enrolments are small.
An example of variability between places is the 2012 results for Gapuwiyak School where only 4 per cent of students achieve NMS in Year 3 reading compared to 89 per cent in One Arm Point School. A good example of volatility based on small numbers is in the results for Doomadgee in Table 32. The proportion of Year 3 students who meet NMS in Year 3 reading was 17 per cent in 2008, 55 per cent in 2009, 75 per cent in 2011 and 53 per cent in 2012.
While the data are volatile, there are some noteworthy differences across the schools. For example, unlike many other RSD schools, the vast majority of students at One Arm Point School meet the national minimum standards for Year 3 reading. It is also worth noting that, while not shown in Table 32 due to small numbers, the Cape York Aboriginal Australian Academy (CYAAA) reports that at the Coen campus in 2012 all Year 3 Coen students met national minimum standards in every NAPLAN category. In the Aurukun campus the CYAAA reports that average scores have improved in seven out of the 12 categories since 2010.[325]
Looking at changes in the NAPLAN results between 2008 and 2012 for the schools noted in Table 7.7, there are no consistent patterns. Of the 12 instances where the 2008 and 2012 results can be compared, there are large increases in the NMS in three instances (Galiwinku, Doomadgee, and Mornington Island), and large decreases occur in four instances (Gapuwiyak, Wadeye, Yirrkala Homeland School, and Walgett Community College). In the other five instances there are smaller increases or decreases. If one focuses on the 2009 to 2012 changes where a larger number of schools (16) can be included, again there is no consistent pattern. We find three large increases (Galiwinku, Numbulwar and Nguiu), two modest increases, one unchanged, five modest decreases and five large decreases (Hope Vale, Ntaria, Wadeye, Gapuwiyak and Walgett Community College).
Statistical analyses
In spite of the natural volatility of the NAPLAN data at the level of individual RSD community schools, it is important to test whether any changes are statistically significant otherwise changes that reflect random variation (statistical noise) may be considered meaningful. The test for statistically significant changes can be done only at the aggregate level as statistical tests of differences over time use the ‘average’ school in the RSD communities for which NAPLAN data are available on a year to year basis (i.e. from 2008 to 2012). The NAPLAN data used for these statistical tests are more detailed than what was reported in Table 7.7 because additional data were provided by ACARA that what is available on the MySchool website. The results of two separate but related statistical tests are shown in Appendix N Table N.2.
The regression analyses find no statistically significant changes in the RSD schools in the proportion of students meeting national minimum standards in reading and numeracy from 2008 to 2012. This is not surprising given the high degree of volatility in the data that reflects small student numbers.
Participation in NAPLAN
The MySchool website provides data on the percentage of students who participate every year on specific NAPLAN tests conducted in each school. It is important to examine changes in the participation rate in NAPLAN tests to understand the pattern of NAPLAN results over time. Large variations in the participation rate can affect trends in the NAPLAN tests, especially for schools where enrolments are small. Examination of the trends in the proportion of students assessed is in Appendix N Table N.4.
Overall, there is no clear pattern in the assessment rate of students in the NAPLAN Year 5 Numeracy test. Comparing changes only between 2008 and 2012, there are more schools where the assessment percentage has decreased (13) than where it has increased (9).
Comparison of the proportion of Year 5 students assessed in Numeracy with Reading showed that a consistently higher proportion of students are assessed in the NAPLAN Reading test. Among the RSD community schools with comparable data, the proportion of students assessed in Year 5 Reading was greater than or equal to the proportion assessed in Year 5 Numeracy in a vast majority of the RSD community schools (20 out of 26 schools in 2011, and in 18 out of 23 schools in 2012).
Table 7.7 Proportion of students at or above National Minimum Standard for Year 3 Reading by community, with school enrolment (all students - Indigenous and non-Indigenous), from 2008 to 2012 a
|
|
|
2009 Year 3 enrolment |
2011 Total school enrolment |
Students at or above NMS |
||||
|---|---|---|---|---|---|---|---|---|
|
School name |
Community |
2008 |
2009 |
2010 |
2011 |
2012 |
||
|
|
|
No. |
No. |
% |
% |
% |
% |
% |
|
CYAAA |
Aurukun |
21 |
197 |
14 |
33 |
73 |
69 |
27 |
|
CYAAA |
Coen |
7 |
48 |
20 |
57 |
- |
- |
- |
|
CYAAA |
Hope Vale |
12 |
121 |
41 |
64 |
83 |
46 |
29 |
|
Mossman |
Mossman Gorge |
- |
20b |
- |
- |
- |
- |
- |
|
Doomadgee |
Doomadgee |
44 |
335 |
17 |
55 |
68 |
75 |
53 |
|
Mornington Island |
Mornington Island |
15 |
303 |
27 |
75 |
47 |
95 |
73 |
|
Angurugu |
Angurugu |
18 |
263 |
- |
9 |
- |
- |
- |
|
Shepherdson |
Galiwinku |
60 |
533 |
10 |
8 |
34 |
19 |
>36 |
|
Gapuwiyak |
Gapuwiyak |
21 |
220 |
33 |
28 |
13 |
- |
4 |
|
Gunbalanya |
Gunbalanya |
28 |
344 |
- |
31 |
65 |
7 |
>28 |
|
Ntaria |
Hermannsburg |
23 |
161 |
- |
71 |
70 |
64 |
54 |
|
Lajamanu |
Lajamanu |
22 |
152 |
- |
- |
- |
21 |
- |
|
Maningrida |
Maningrida |
49 |
626 |
6 |
- |
67 |
13 |
12 |
|
Milingimbi |
Milingimbi |
41 |
295 |
- |
20 |
- |
- |
- |
|
Murrupurtiyanuwu |
Nguiu |
31 |
207 |
26 |
14 |
9 |
44 |
35 |
|
Numbulwar |
Numbulwar |
22 |
184 |
55 |
12 |
18 |
7 |
40 |
|
Ngukurr |
Ngukurr |
25 |
223 |
- |
25 |
29 |
63 |
35 |
|
Our Lady of the Sacred Heart Thamarrurr |
Wadeye |
51 |
440 |
35 |
18 |
24 |
18 |
18 |
|
Yirrkala Homeland |
Yirrkala |
19 |
175 |
40 |
- |
- |
- |
17 |
|
Yirrkala |
Yirrkala |
16 |
134 |
- |
43 |
60 |
19 |
- |
|
Yuendumu |
Yuendumu |
10 |
154 |
- |
33 |
71 |
- |
- |
|
Alyarrmandumanja Umbakumba |
Umbakumba |
11 |
96 |
- |
- |
20 |
- |
33 |
|
One Arm Point |
Ardyaloon |
10 |
114 |
- |
100 |
89 |
67 |
89 |
|
Sacred Heart |
Beagle Bay |
5 |
102 |
- |
75 |
90 |
64 |
43 |
|
Ngalapita |
Fitzroy Crossing |
- |
25 |
- |
60 |
- |
- |
- |
|
Yakanarra |
Fitzroy Crossing |
- |
56 |
- |
- |
- |
- |
- |
|
Yiyili |
Halls Creek |
8 |
61 |
- |
75 |
- |
- |
- |
|
Amata Anangu |
Amata |
5 |
123 |
- |
- |
- |
- |
40 |
|
Mimili Anangu |
Mimili |
4 |
60 |
- |
- |
- |
- |
- |
|
Community College |
Walgett c |
11 |
110 |
92 |
85 |
60 |
- |
41 |
|
Central |
Wilcannia |
10 |
120 |
|
43 |
43 |
60 |
>43 |
- signifies this datum is not reported by ACARA.
a The percentage of students at or above national minimum standard (NMS) is derived from the percentage of assessed students who are in the Bands at or above NMS. For Year 3 NAPLAN results, this represents all students in Band 2 or higher. In several instances the per cent of students in specific bands (2 or higher) have been suppressed due to small number of students achieving in these bands. In those instances, the full count of students at or above NMS cannot be derived. What is reported in Table 7.7 is the minimum value, which is the sum of percentages in Bands 2 or higher that are not suppressed, with the indication that the true value will be larger than this computed sum. Band-wise suppression only occurs in a few instances in MySchool while more generally the data for the entire test cohort is suppressed when the results did not meet ACARA's reporting requirements.
Total enrolment for Year 3 in 2009 is derived from the RSD Baseline Mapping reports, based on data provided by state and territory jurisdictions. DETE in Qld provided more detailed data for their schools than is available through MySchool.
b Mossman Gorge community students attend nearby Mossman community schools. Results for these students are not available as a separate group.
c St. Joseph’s School in Walgett was excluded from this analysis because just over half of the students are non-Indigenous, making it very different from the other RSD community schools.
Source: MySchool and ACARA tables provided.
7.3.3 Year 12 or equivalent attainment
Key findings
The gap for Indigenous students attaining Year 12 or equivalent has narrowed slightly, with improvement in attainment rates for 20-24 year olds in 21 of the 29 RSD communities between the 2006 and 2011 Census. For 11 communities the increase was more than 10 percentage points. However, this trend is not unique to RSD communities. It mirrors a broader trend across Indigenous Australia, especially in very remote areas. While the same trend is apparent for adults (20‑64 year olds), it is too soon to see change in the timeframe since the start of the NPA RSD.
Introduction
Progress against this target is measured with data on the proportion of 20–24 year olds who have attained a Year 12 or above level of education.[326] Figure 7.1 shows the data for the RSD communities in 2011 that are used to monitor the Year 12 Closing the Gap target. The data should be treated with caution, as the number of 20–24 year olds in some communities can be very small. In addition it is worth noting that some young people may have moved away from their community after completing school.
RSD communities
In 2011, for Australia as a whole just over half (53.9 per cent) of all Indigenous people aged 20‑24 years had attained at least Year 12 or equivalent level of education. The comparative rate at 2011 for all Australians of the same age was 85 per cent. Since 2006, the Indigenous Year 12 attainment rate has risen by 6.5 percentage points, from 47.4 per cent.
As figure 7.1 shows all of the RSD communities have a Year 12 or equivalent attainment level that is below the overall national average. All but three of the RSD communities have a Year 12 or equivalent attainment level that is below the average for all Indigenous Australians. In Coen, Hope Vale and Beagle Bay the Indigenous Year 12 or equivalent attainment rate was above the comparative rate for all young Indigenous adults, aged 20-24 years in 2011.
Figure 7.1 Year 12 attainment or equivalent or Certificate II level or above,
Indigenous persons 20-24 years, 2011
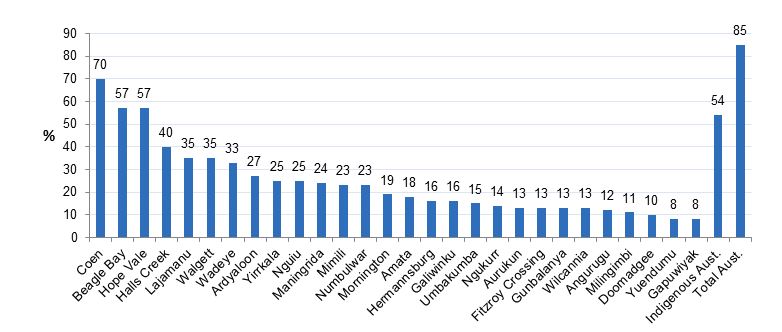
Source: Census 2011, unpublished data
On a positive note Figure 7.2 shows that from 2006 to 2011 the Year 12 or equivalent attainment rate has increased in 21 of the RSD communities (excluding Mossman Gorge where data are not available), by as much as 27 percentage points at Lajamanu and 25 percentage points at Wadeye. For 16 communities the increase was by five or more percentage points and for 11 communities the increase was more than 10 percentage points. While the numbers should be treated with caution given the small number of people involved in each RSD community the overall trend is a positive one.
Figure 7.2 Change in Year 12 attainment or equivalent or Certificate II level or above between 2006 and 2011, Indigenous persons 20-24 years *
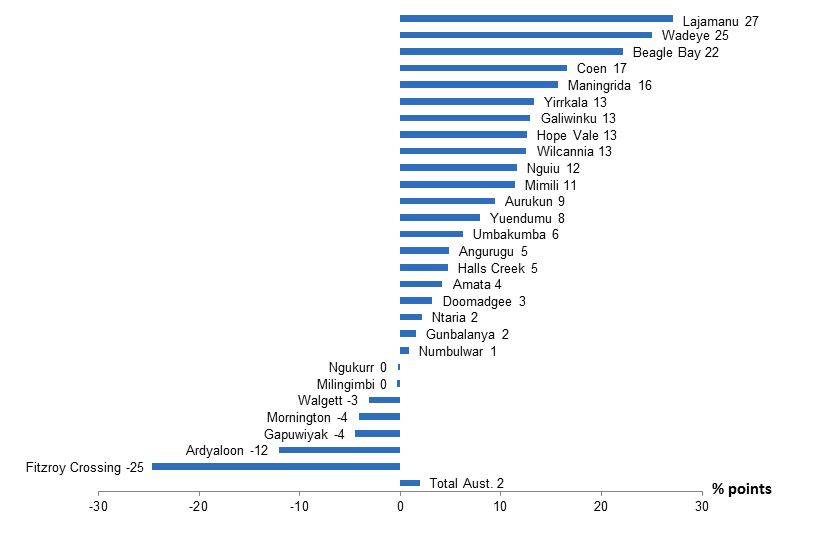
* The result for Mossman Gorge is not available.
Source: Census 2011, unpublished data.
Comparison with overall trends for remote areas
While the improvements to Year 12 or equivalent attainment rates across the RSD communities are positive, it is important to provide some comparative perspective as the changes may be part of a broader trend. All of the 29 RSD communities, with the exception of Mossman Gorge (which is in outer regional Australia) are in remote or very remote areas. Most of the RSD communities with the exception of Walgett, Wilcannia, Wadeye and Hope Vale are in very remote Australia rather than remote Australia.
Table 7.8 shows the proportion of Indigenous 20-24 year olds who have attained at least a Year 12 or equivalent level of education for remote and very remote areas in the RSD jurisdictions. The table shows strong growth in Year 12 or equivalent attainment particularly in very remote areas. The improvements in Year 12 attainment in the RSD communities appear to be part of a broader trend that is not unique to the RSD communities.
Table 7.8 Indigenous 20-24 year olds who have attained a Year 12 or above level of education for remote and very remote areas in the RSD jurisdictions, change from 2006 to 2011
|
2006 |
2011 |
Change 2006-2011 |
|
|---|---|---|---|
|
% |
% |
% points |
|
|
New South Wales |
|||
|
Remote |
37.1 |
39.6 |
2.5 |
|
Very Remote |
20.4 |
38.8 |
18.4 |
|
All NSW Indigenous |
49.8 |
55.9 |
6.1 |
|
Queensland |
|||
|
Remote |
45.2 |
49.8 |
4.6 |
|
Very Remote |
45.4 |
53.5 |
8.1 |
|
All Qld Indigenous |
57.9 |
62.5 |
4.6 |
|
South Australia |
|||
|
Very Remote |
19 |
23.8 |
4.8 |
|
All SA Indigenous |
42.7 |
50.7 |
8 |
|
Western Australia |
|||
|
Remote |
42 |
46.6 |
4.6 |
|
Very Remote |
25.5 |
29.2 |
3.7 |
|
All WA Indigenous |
39.6 |
45.4 |
5.8 |
|
Northern Territory |
|||
|
Remote |
23.9 |
34.6 |
10.7 |
|
Very Remote |
9.4 |
20.1 |
10.7 |
|
All NT Indigenous |
18.2 |
28.7 |
10.5 |
|
Australia |
|||
|
Remote |
36.7 |
43.0 |
6.3 |
|
Very Remote |
22.5 |
30.7 |
8.2 |
|
All Indigenous Australians |
47.4 |
53.9 |
6.5 |
Source: Census 2006 and 2011, unpublished data.
Highest level of schooling completed
It is also worth looking at the level of education among Indigenous adults in the RSD communities and how this has changed over time. The data presented in Table 7.9 is for the highest level of schooling completed, for Indigenous 20-64 year olds.
These data are slightly different to the highest level of education completed as some people who may have left school at Year 10 may have completed a post-school qualification. However, the data do give a broad indication of the relative level of education among Indigenous people in the RSD communities. In all but one of the RSD communities the proportion of Indigenous adults with a Year 12 level of schooling was below the national average for all Indigenous people in 2011 (29.1 per cent).
On a positive note the percentage of Indigenous 20-64 year olds whose highest level of schooling is Year 12 or equivalent rose from 2006 to 2011 in 24 of the 29 communities for which data are available (data were not available for Mossman Gorge for 2006).
Table 7.9 Indigenous 20-64 year olds whose highest level of schooling is Year 12 or equivalent, change from 2006 to 2011
|
2006 |
2011 |
Change 2006-2011 |
|
|---|---|---|---|
|
% |
% |
% points |
|
|
New South Wales |
|||
|
Walgett |
15.0 |
19.6 |
4.6 |
|
Wilcannia |
3.0 |
6.0 |
3.0 |
|
Queensland |
|||
|
Aurukun |
3.0 |
8.4 |
5.4 |
|
Coen |
23.0 |
29.6 |
6.6 |
|
Doomadgee |
6.0 |
11.4 |
5.4 |
|
Hope Vale |
17.0 |
26.5 |
9.5 |
|
Mornington |
18.0 |
20.3 |
2.3 |
|
Mossman Gorge |
np |
9.1 |
n.p |
|
South Australia |
|||
|
Amata |
4.0 |
5.9 |
1.9 |
|
Mimili |
4.0 |
9.7 |
5.7 |
|
Western Australia |
|||
|
Ardyaloon |
14.0 |
17.9 |
3.9 |
|
Beagle Bay |
25.0 |
20.5 |
-4.5 |
|
Fitzroy Crossing |
18.0 |
13.9 |
-4.1 |
|
Halls Creek |
16.0 |
17.5 |
1.5 |
|
Northern Territory |
|
|
|
|
Angurugu |
7.0 |
7.7 |
0.7 |
|
Galiwinku |
6.0 |
17.2 |
11.2 |
|
Gapuwiyak |
8.0 |
4.4 |
-3.6 |
|
Gunbalanya |
13.0 |
10.7 |
-2.3 |
|
Hermannsburg (Ntaria) |
4.0 |
7.4 |
3.4 |
|
Lajamanu |
8.0 |
12.9 |
4.9 |
|
Maningrida |
5.0 |
18.2 |
13.2 |
|
Milingimbi |
9.0 |
12.0 |
3.0 |
|
Nguiu |
10.0 |
17.5 |
7.5 |
|
Ngukurr |
10.0 |
12.8 |
2.8 |
|
Numbulwar |
13.0 |
15.1 |
2.1 |
|
Umbakumba |
16.0 |
5.9 |
-10.1 |
|
Wadeye |
5.0 |
34.0 |
29.0 |
|
Yirrkala |
13.0 |
15.0 |
2.0 |
|
Yuendumu |
3.0 |
8.0 |
5.0 |
|
Indigenous Australia |
23.9 |
29.1 |
5.1 |
|
Total Australia |
52.7 |
58.9 |
6.2 |
Source: Census 2006 and 2011, unpublished data.
While increases in the proportion of Indigenous 20-64 year olds whose highest level of schooling is Year 12 or equivalent are positive, Table 7.10 shows that similar trends are apparent for Indigenous Australians across remote and very remote areas and that the improvements in the RSD communities appear to be part of a broader trend.
Table 7.10 Indigenous 20-64 year olds whose highest level of schooling is Year 12 or equivalent, change from 2006 to 2011
|
2006 |
2011 |
Change 2006-2011 |
|
|---|---|---|---|
|
% |
% |
% points |
|
|
New South Wales |
|||
|
Remote |
15.2 |
19.8 |
4.6 |
|
Very Remote |
8.9 |
14.2 |
5.3 |
|
All NSW Indigenous |
23.3 |
27.6 |
4.4 |
|
Queensland |
|||
|
Remote |
21.7 |
25.0 |
3.4 |
|
Very Remote |
25.4 |
30.3 |
5.0 |
|
All Qld Indigenous |
30.4 |
35.7 |
5.3 |
|
South Australia |
|||
|
Remote |
20.8 |
20.9 |
0.0 |
|
Very Remote |
8.8 |
12.5 |
3.7 |
|
All SA Indigenous |
21.2 |
26.1 |
4.9 |
|
Western Australia |
|||
|
Remote |
19.7 |
24.7 |
5.0 |
|
Very Remote |
14.9 |
18.6 |
3.7 |
|
All WA Indigenous |
20.6 |
25.2 |
4.6 |
|
Northern Territory |
|||
|
Remote |
11.9 |
16.8 |
4.8 |
|
Very Remote |
6.6 |
13.5 |
6.8 |
|
All NT Indigenous |
11.0 |
17.1 |
6.0 |
|
Australia |
|||
|
Remote |
17.1 |
21.8 |
4.6 |
|
Very Remote |
13.6 |
18.8 |
5.2 |
|
All Indigenous Australians |
23.9 |
29.1 |
5.1 |
Source: Census 2006 and 2011, unpublished data.
Completion of post school qualifications
Another useful measure is to look at the completion of post school qualifications (Certificate level III and above). Table 7.11 reveals that completion of Certificate level III and above for Indigenous 20‑64 year olds has increased in most RSD communities since 2006, in line with overall increases in this level of attainment by all Indigenous people. However, despite increases from 2006 to 2011 the proportion of Indigenous adults with post-school qualifications in all of the RSD communities is lower than the average for all Indigenous Australians.
Table 7.11 Indigenous 20-64 year olds with a post school qualification Certificate III or above, change from 2006 and 2011
|
2006 |
2011 |
Change 2006-2011 |
|
|---|---|---|---|
|
|
% |
% |
% points |
|
New South Wales |
|
|
|
|
Walgett |
12.4 |
21.95 |
9.56 |
|
Wilcannia |
8.6 |
11.32 |
2.72 |
|
Queensland |
|
|
|
|
Aurukun |
2.3 |
6.10 |
3.84 |
|
Coen |
23.5 |
20.62 |
-2.91 |
|
Doomadgee |
6.8 |
5.52 |
-1.27 |
|
Hope Vale |
17.6 |
26.25 |
8.61 |
|
Mornington |
6.5 |
9.96 |
3.50 |
|
Mossman Gorge |
4.3 |
6.6 |
2.26 |
|
South Australia |
|
|
|
|
Amata |
1.8 |
3.03 |
1.21 |
|
Mimili |
0.0 |
5.07 |
5.07 |
|
Western Australia |
|
|
|
|
Ardyaloon |
12.5 |
21.09 |
8.59 |
|
Beagle Bay |
17.8 |
18.56 |
0.75 |
|
Fitzroy Crossing |
11.8 |
11.99 |
0.18 |
|
Halls Creek |
6.9 |
11.32 |
4.40 |
|
Northern Territory |
|
|
|
|
Angurugu |
1.0 |
9.53 |
8.49 |
|
Galiwinku |
8.7 |
13.23 |
4.57 |
|
Gapuwiyak |
5.9 |
2.64 |
-3.22 |
|
Gunbalanya |
4.0 |
8.09 |
4.13 |
|
Hermannsburg |
6.1 |
11.34 |
5.20 |
|
Lajamanu |
3.8 |
15.02 |
11.25 |
|
Maningrida |
3.4 |
4.61 |
1.23 |
|
Milingimbi |
5.9 |
9.16 |
3.29 |
|
Nguiu |
10.4 |
15.35 |
4.90 |
|
Ngukurr |
7.5 |
11.01 |
3.54 |
|
Numbulwar |
5.1 |
7.50 |
2.45 |
|
Umbakumba |
2.1 |
2.33 |
0.21 |
|
Wadeye |
2.7 |
5.47 |
2.77 |
|
Yirrkala |
7.0 |
14.50 |
7.51 |
|
Yuendumu |
4.9 |
8.15 |
3.28 |
|
All RSDs |
6.6 |
10.3 |
3.74 |
|
Indigenous Australia |
24.0 |
30 |
6.00 |
|
Total Australia |
49.2 |
55 |
5.80 |
Source: Census 2006 and 2011, unpublished data
7.4 Health and community services
7.4.1 Key findings
A wide range of health and community services information is available for RSD communities. Indicators of service use include disability and aged care, child protection, juvenile justice and treatment for alcohol and other drug use. Primary health care indicators include potentially preventable hospitalisations and avoidable deaths. Health status and outcome indicators include low birth weight babies, teenage fertility rate, hospitalisation rates overall and selected causes (dialysis, diabetes, poor environmental health, assault and alcohol-related conditions) and mortality.
Progress can only be assessed in one area of community service use, for disability services, due to small numbers, a lack of data or insufficient time in which to observe any change. From 2006–07 to 2010–11, use of disability services was higher among Indigenous than non-Indigenous people in all RSD locations.
While numbers for alcohol and other drug treatment services are too small to assess any individual community trends, combined data for 2006–07 to 2010–11 show a higher level of service use among Indigenous than non-Indigenous residents of RSD communities, predominantly related to alcohol misuse. This appears consistent with a greater level of need, as hospitalisation for alcohol-related conditions is five times as likely for Indigenous people in RSD communities than for other Australians nationally (using combined data 2008–09 to 2010–11), up from 4.4 times based on combined data for 2003–04 to 2007–08.
The data on health status confirms the gap between RSD communities compared with the Australian population. Compared with Indigenous national or jurisdictional rates, residents of RSD communities generally have higher rates of low birth weight babies, mortality for all causes and preventable diseases, and hospitalisation for conditions including potentially preventable hospitalisations, diabetes, assault, conditions requiring dialysis, and diseases associated with poor environment.
No prior trend in health status of Indigenous residents of RSD communities is evident. The years leading up to 2011 show mixed results across the RSD communities where local-level data were available. While the data do not permit evaluation of the impact of the NPA RSD, as changes in health outcomes cannot be attributed to short-term programme exposure, this information could provide a baseline against which to evaluate progress of initiatives in the future when data become available spanning further years.
7.4.2 Introduction
This section summarises health and community services information for 29 RSD communities. It provides an update on indicators presented in a baseline mapping project undertaken in 2010. The Australian Institute of Health and Welfare (AIHW) was engaged to analyse the available data for RSD communities relating to health and community services. Data are presented for the most recent period available and, where possible, time series data are discussed to show change over time.[327]
The most recently available data for most health indicators was for 2010-11, the year in which LIPs were being established in most RSD communities. The AIHW suggests that measurement of progress in health in RSD communities will not be possible until data are available for 2013, 2014, 2015, or 2020 depending on the indicator. Given the lag time between implementing a new initiative and any effect on health outcomes, even after two to three years of implementation, it would be unrealistic to expect significant changes.
The indicators are discussed under the following categories:
- service use – administrative data on service use including child protection, juvenile justice, alcohol and other drug use, disability and aged care (community level data on antenatal care is not yet available)
- primary health care – proxy indicators including potentially preventable hospitalisations and avoidable deaths
- health status and outcomes – low birth weight babies, teenage fertility rate, hospitalisation rates for overall and selected causes (dialysis, diabetes, poor environmental health and assault and alcohol-related conditions) and mortality rates.
Community level data are not available in most administrative data collections, therefore RSD communities are approximated by Statistical Local Areas (SLAs) or postcodes which are the closest units of geography to a community for which data are available. In ten of these SLAs, the community represents 99.8 to 100 per cent of the Indigenous population of the SLA, while in a further two SLAs the community represents 60 to less than 99.8 per cent of the Indigenous population. In seven SLAs the community represents less than 50 per cent of the Indigenous population of the SLA. Due to data quality issues, Amata and Mimili are approximated by remote and very remote areas of SA when showing data for morbidity (hospitalisations) and mortality.
Difficulties in assessing impact of programs
The main aim of the analyses was to assess the impact of the NPA RSD on health outcomes. However, such an assessment is difficult for a number of reasons:
- improvements in health outcomes are not likely to be seen just a few years after the introduction of an initiative such as the NPA RSD
- changes in health outcomes cannot be attributed to the short-term exposure to a program or policy initiative
- there are difficulties in identifying significant changes if only comparing data for a few years after the introduction of an initiative. For some health measures such as low birth weight the most recent data available are for 2009, the year in which the RSD initiative was implemented. For hospitalisations, only two data points are available since the NPA RSD was implemented and it is too early for any changes to be reflected in this data
- rates can be highly misleading when based on small highly fluctuating populations
- in this section, a RSD community is defined to include a whole SLA. Where an initiative is implemented for a specific community the data are monitoring a change in a larger geographic area and this may not show a true change at the community level.
It is difficult to ascertain whether any changes in health outcomes seen in RSD communities are due to the impact of a program from the existing data sets (e.g. hospital data). It is anticipated that data collections such as the national key performance indicators that collect clinical data at local clinic level will address this gap to some extent in the future. A limitation of local clinic data would be the lack of baseline data as the collection started in June 2012. Nevertheless, this will be a valuable resource to assess the impact of ongoing service delivery and health outcomes. AIHW report that data on antenatal care will soon be available for the 2011 calendar year.[328]
7.4.3 Service use
The Service Use section covers child protection and juvenile justice, alcohol and other drug treatment services, disability and aged care services.
Child protection and juvenile justice
Data on child protection are not available at the community level for most RSD communities, except for some communities in Qld and WA. Data provided for Indigenous communities in WA are relatively small and show no consistent pattern. In Qld where data were available by state and for some communities, they show that rates of substantiated child protection notifications are higher in all communities except Mossman Gorge, compared with the state average in 2010–11. Fluctuations in small numbers from year to year may be driven by changes in reporting practices or staffing levels.
While there are no data at the RSD community level on young people under juvenile justice supervision for RSD communities, data indicate that in general Indigenous young people were more likely to be in supervision than the non-Indigenous youth. This over-representation occurred in all states and territories: Indigenous young people (aged 10-17) were between 14 and 18 times as likely as non-Indigenous young people to be under supervision in Qld, SA and NSW.[329]
Alcohol and other drug treatment services
Data relating to Indigenous substance use services are drawn primarily from treatment episodes where clients identifying as Indigenous have accessed mainstream services and/or services that receive funding from state and territory governments. In 2010–11, 13 per cent of all treatment episodes involved clients who identified as being Indigenous. On average, Indigenous clients tended to be younger than non-Indigenous clients.
Nationally, Indigenous Australian clients reported the same top four principal drugs of concern as the population overall - alcohol (52% of episodes), cannabis (23%), amphetamines (7%) and heroin (6%). Indigenous Australians were more likely to report alcohol as the principal drug of concern than non-Indigenous clients (52% compared with 46%, respectively).
In SLAs where RSD communities are located and where data are available, combined data for the periods between 2006–07 and 2010–11 show that more Indigenous than non-Indigenous residents accessed alcohol and other drug treatment services (shown by numbers of closed treatment episodes[330] in Table 7.12). Alcohol was the most common principal drug of concern reported by Indigenous clients, followed by cannabis.
Table 7.12 Closed treatment episodes for alcohol and other drugs, by Indigenous status, SLAs for RSD communities and jurisdictions, 2006-07 to 2010-11
|
SLAs for RSD communities a |
Indigenous |
Other b |
||
|---|---|---|---|---|
|
|
Number |
Per cent |
Number |
Per cent |
|
Queensland |
16,401 |
12.9 |
110,988 |
87.1 |
|
Aurukun (S) |
44 |
<100.0 |
<3 |
n.p |
|
Cairns (R) – Douglas c |
58 |
48.3 |
62 |
51.7 |
|
Cook (S) |
144 |
58.1 |
104 |
41.9 |
|
Doomadgee (S) |
54 |
87.1 |
n.p |
12.9 |
|
Hope Vale (S) |
12 |
66.6 |
n.p |
33.3 |
|
Western Australia |
16,202 |
18.5 |
71,518 |
81.5 |
|
Broome (S) |
922 |
72.9 |
343 |
27.1 |
|
Derby-West Kimberley (S) |
50 |
87.7 |
n.p |
12.3 |
|
Northern Territory |
10,564 |
61.0 |
6,760 |
39.0 |
|
East Arnhem (S) d |
10 |
100.0 |
0 |
0.0 |
|
West Arnhem (B) –Bal e |
n.p |
72.7 |
n.p |
27.3 |
|
Australia |
86,234 |
11.6 |
654,880 |
88.4 |
n.p. not published due to small numbers.
a Areas are grouped using 2010-11 SLA names.
b Includes people who are non-Indigenous or had unknown Indigenous status.
c Douglas (S) prior to 2009.
d Angurugu (CGC), East Arnhem - Balance and Groote Eylandt prior to 2009.
e Kunbarllanjnja prior to 2009.
Source: AIHW analysis of AODTS–NMDS 2006–07, 2007–08, 2008–09, 2009–10 and 2010–11.
Of all closed treatment episodes, counselling was the most common form of main treatment provided to Indigenous clients in RSD communities.[331] Nationally the most common form of treatment provided for Indigenous clients was ‘other’ which included detoxification, rehabilitation, support/case management, information/education or assessment only.
Disability and aged care services
Data on disability service users are available at the postcode level. Numbers of disability service users residing in postcodes where the RSD communities are located were high among Indigenous residents and continued to increase over time when compared with their non-Indigenous counterparts. Between 2006–07 and 2010–11, the increase in the number of Indigenous people using disability services was greatest in 16 postcodes where RSD communities are located while moderate increases were noted in four communities.
Home and Community Care (HACC) services were the most commonly used aged care services and were used in all RSD communities between 2004-05 and 2010-11. In almost all communities the most common HACC service provided was ‘delivered meals’, followed by ‘centre day care’ and ‘transport’. HACC services provide basic support and maintenance services to assist frail older people and younger people with moderate, severe or profound disabilities and their carers.
7.4.4 Primary Health Care
This covers rates of hospitalisation for potentially preventable conditions and mortality rates for avoidable deaths, as both are indicators of where death, disease or chronic illness could be prevented through effective public health and timely medical intervention.
Potentially preventable hospitalisations
Potentially preventable hospitalisations are where, in theory, hospital admission is thought to be avoidable through the provision of appropriate non-hospital health services. These include primary health care together with general practice, community care, emergency department care and outpatient care. Hospitalisations for conditions that can be addressed at primary health care services provide a good indicator of access to services.
Potentially preventable hospitalisation rates cover three categories of conditions:
- vaccine-preventable conditions (e.g. tetanus, measles, mumps, rubella)
- acute conditions (e.g. ear, nose and throat infections, dehydration/gastroenteritis)
- chronic conditions (e.g. diabetes, asthma, angina, hypertension, congestive heart failure and chronic obstructive pulmonary disease).
In 2010-11, rates of potentially preventable hospitalisations for Indigenous Australians in most SLAs where RSD communities were located were higher than the Indigenous rates for their respective jurisdiction.
Over the period between 2003–04 and 2010–11, only Walgett experienced a statistically significant decrease in hospitalisations for potentially preventable conditions, while several communities (Galiwinku, Gapuwiyak, Milingimbi and Yirrkala) experienced significant increases.
Avoidable deaths
Avoidable mortality is a population-based method of counting untimely and unnecessary deaths from diseases that could be prevented through effective public health and timely medical intervention. An excess of avoidable mortality is generally used as a measure of quality, effectiveness and/or accessibility of the health system.
On average, in 2003–10, Indigenous Australians in RSD communities died from diseases that could have been prevented at 10 times the rate of other Australians nationally. Standardised mortality ratios[332] for avoidable mortality in RSD communities ranged from 5.0 in Angurugu to 19.5 in Umbakumba (this means that Indigenous Australians in Umbakumba died from avoidable causes at over 19 times the rate of other Australians, nationally).
7.4.5 Health status and outcomes
Low birth weight babies
Birth weight is a key indicator of infant health and a principal determinant of a baby’s chance of survival and good health during the first year of life and propensity to experience ill health in childhood. Low birth weight (new born babies weighing less than 2,500 grams) is associated with premature birth or suboptimal intrauterine environments. Low birth weight can also increase the likelihood of developing chronic diseases later in life.
Over the period 2007–09, babies born to Indigenous mothers at the national level were twice as likely to be of low birth weight as babies born to non-Indigenous mothers (12.3% compared with 5.9%). When multiple births are excluded, approximately 11 per cent of live born babies born to Indigenous mothers were of low birth weight compared with around four per cent of babies born to non‑Indigenous mothers.
In most RSD communities, in 2008-09, the rate of low birth weight babies was high when compared with the rates for the jurisdictions where the communities are located as well as the national rate. Most RSD communities also had higher rates of babies born of low birth weight to Indigenous mothers compared with remote and very remote areas of Australia.
Teenage fertility rate
In 2008‑09, the teenage fertility rate of Indigenous women (75 babies per 1,000 women) was almost five times the teenage fertility rate of all women (17 babies per 1,000 women). This pattern was also apparent in RSD SLAs. All RSD SLAs had much higher teenage fertility rates compared with the teenage fertility rate for all women. Moreover, most RSD SLAs had higher teenage fertility rates compared with the teenage fertility rate for all Indigenous women. Only Mossman Gorge (61 babies per 1,000 women) and Hermannsburg (62 babies per 1,000 women) had lower rates than the national Indigenous average of 75 per 1,000 women.
Hospitalisations overall, for dialysis and diabetes
Hospitalisations data provide an indication of the extent of serious acute illnesses and conditions requiring inpatient hospital treatment in a population and the access to and use of hospital inpatient services by people with such conditions. Hospitalisation rates for a particular disease do not directly indicate the prevalence of that disease in the population as these data are on the number of hospital episodes rather than on the number of individual people who are hospitalised. A person who has frequent admissions for the same disease is counted multiple times.
In 2010–11, Indigenous hospitalisation rates for all conditions excluding dialysis were higher in most RSD SLAs compared to rates for Indigenous Australians nationally. Communities with lower rates of hospitalisations than the national average were Wadeye, Nguiu, and Maningrida in the NT.
In 2010–11, the NT RSD SLAs including Umbakumba, Wadeye, Nguiu, and Maningrida had lower hospitalisation rates for all conditions excluding dialysis than the Indigenous jurisdictional average. However, RSD SLAs in NSW, Qld, WA and SA had higher hospitalisation rates than their respective jurisdictions.
Indigenous Australians have high rates of chronic kidney disease, which has a major effect on these data. The incidence rate of end stage kidney disease, which requires regular dialysis or a kidney transplant for survival, is significantly higher for Indigenous Australians than for non-Indigenous Australians. Combined data for 2008–09 to 2010–11 for 29 RSD communities indicate that Indigenous Australians in these communities are more likely than other Australians nationally to be hospitalised for care involving dialysis (10 times as likely compared with 7.4 reported at the baseline (combined data 2003–04 to 2007–08)).
Indigenous Australians are also more likely than other Australians, nationally, to be hospitalised for diabetes which is the most common cause of kidney failure requiring dialysis. Combined data for the period 2008–09 to 2010–11 indicate that Indigenous Australians in RSD communities were over six times as likely as other Australians to be hospitalised for diabetes. This may explain the high rates of dialysis hospitalisations among Indigenous Australians.
Analyses of overall trends in the data for the medium-term (between 2003–04 and 2010–11) show that the rate of hospitalisation for all conditions (excluding dialysis), increased significantly in Galiwinku, Gapuwiyak, Milingimbi, Yirrkala, Mossman Gorge, Mornington Island, Amata and Mimili. Walgett had significantly reduced rates of hospitalisations over the same period.
Hospitalisation for poor environmental health
In 2010–11, hospitalisation rates for diseases associated with poor environmental health (these include infectious, bacterial and respiratory conditions) were higher in most RSD communities when compared with the rates for Indigenous people nationally. Most RSD communities in NSW, Qld, WA and SA had higher rates of hospitalisations for diseases associated with poor environmental health compared to the Indigenous rates of their respective jurisdictions. In the NT, most RSD communities (except for Lajamanu, Hermannsburg and Yuendumu) had lower rates compared to Indigenous rates in the NT.
When compared with the Indigenous rates of hospitalisation for diseases associated with poor environment in remote and very remote areas of Australia, higher rates were seen in all RSD communities of WA and Doomadgee, Mossman Gorge, Hope Vale, Mornington Island in Qld. In the NT, Hermannsburg and Yuendumu communities had rates that were higher than the Indigenous rates of remote and very remote areas of Australia.
Over the period between 2003–04 and 2010–11, hospitalisation for diseases associated with poor environmental health declined in nearly half the 29 RSD communities but the change was not always statistically significant. Only Walgett, Fitzroy Crossing, Amata and Mimili communities experienced a significant decline in hospitalisations for diseases associated with poor environmental health. In contrast Mornington Island had significant increases in hospitalisations associated with poor environmental conditions.
Hospitalisation for assault and alcohol-related conditions
Combined data for 2008–09 to 2010–11 indicate that Indigenous Australians in RSD communities are more likely than other Australians nationally to be hospitalised for assault (over 20 times as likely) and alcohol-related conditions (5 times as likely), shown in Figure 7.3. This compares to the values reported in the baseline (combined data 2003–04 to 2007–08) of 18.5 and 4.4 respectively.
Rates for hospitalised for assault, were highest in the SLAs that included Hermannsburg and Yuendumu and lowest in the SLAs that included Maningrida, Angurugu and Numbulwar. Rates for hospitalised for alcohol-related conditions, were highest in the SLAs that included Wilcannia and Mossman Gorge and lowest in the SLAs that included Angurugu, Numbulwar and Ngukurr.
Figure 7.3 Median standardised hospitalisation ratios a b: RSD communities c to other Australians nationally, 2003-04 to 2007-08 and 2008-09 to 2010-11 d
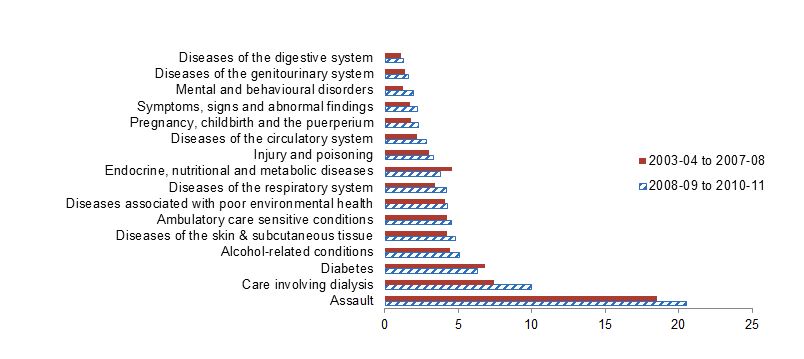
a Standardised hospitalisation ratios (also called morbidity ratios) are the ratio of observed hospital separations for Indigenous Australians in this SLA to the expected number of separations if the age-specific hospital separation rates (for specific principal diagnosis) in this SLA were the same as in the standard population. The standard population used here is other Australians (i.e. non-Indigenous plus not stated) in NSW, Vic, Qld, WA, SA & NT combined. Ratios greater than 1.0 indicate that observed Indigenous separations in this SLA are higher than would be expected if the age-specific separation rates in this SLA were the same as in the standard population. Conversely, ratios lower than 1.0 indicates that observed separations are lower than expected. If the confidence interval includes the value of 1.0 then observed separations are not significantly different from expected separations, at the 95% confidence level.
b For calculation of median values, duplicate values for the same SLA were excluded. For Amata and Mimili, information at SLA level was not available and values for Remote and Very Remote areas in SA were used instead. These values were included in the median calculations.
c RSD communities are approximated by SLAs.
d Data for the SLAs that include Angurugu, Gunbalanya, and Numbulwar are for the one-year period 2008-09.
Source: AIHW National Hospital Morbidity Database.
Mortality
The mortality rate of a population is considered a good summary measure of overall health status. It enables comparison of overall health status of different populations and monitoring of changes over time.
Between 2006 and 2010 Indigenous people had an overall death rate (age-standardised) twice the rate of other Australians. This is despite a 33 per cent reduction in all‐cause mortality rates for Indigenous Australians between 1991 and 2010 – this is based on data from three jurisdictions considered to have adequate levels of Indigenous identification in mortality data for long‐term trends (WA, SA and the NT). The trend between 2001 and 2010 for five jurisdictions with adequate data quality (NSW, Qld, WA, SA, and the NT) show a five per cent decline in all‐cause mortality rates.
Mortality data for Indigenous residents of RSD communities, approximated by the SLAs in which these communities are located were presented for eight years combined (2003 to 2010). The rates calculated for these SLAs are based on small numbers and subject to fluctuations over time and should be interpreted with caution.
Indigenous Australians in RSD communities experienced higher rates of deaths from all causes than other Australians did nationally, in the period 2003–10. Indigenous Australians in Angurugu experienced an all-cause death rate 2.2 times that of other Australians nationally and Indigenous residents in Umbakumba had a death rate 7.1 times that of other Australians nationally. The most common causes of death among Indigenous persons of RSD communities were circulatory diseases, followed by cancer and respiratory diseases.
7.5 Healthy homes
7.5.1 Key findings
Between 2006 and 2011 Census data show greater reductions in the rate of overcrowding in the RSD communities than for Indigenous households across remote and very remote areas. Across the RSD communities the average level of Indigenous overcrowding dropped to 53.3 per cent in 2011, a fall of 4.6 percentage points. This was a much larger fall than for Indigenous households in very remote Australia which fell by 1.6 percentage points. Falls in the average level of overcrowding occurred in 17 of the RSD communities. This data reflects progress up to the time of the Census in August 2011. It therefore only shows a part of the contribution made by new housing work undertaken under the 2008 National Partnership Agreement on Remote Indigenous Housing (NPARIH) which committed $5.48 billion over 10 years for the construction and refurbishment of homes in remote Indigenous communities.
7.5.2 Introduction
Change in overcrowding is examined using Census data based on an internationally accepted measure of overcrowding which is related to household structure. Overcrowding is calculated by the ABS using the Canadian National Occupancy Standard (CNOS) and factors in number of bedrooms and household demography, including the age, gender and relationships of usual residents.
7.5.3 Overcrowding and housing investment
In 2011, 12.9 per cent of all Indigenous households in Australia experienced overcrowding (needing one or more extra bedrooms), declining from 13.6 per cent in 2006. Households with Indigenous persons were far more frequently overcrowded in the NT (37.5%) compared with other states (in Qld it was 13.6% and NSW 9.9%) (See Table 7.16 at the end of this section).
In the major cities and in regional areas the vast bulk of Indigenous households are not subject to overcrowding. However, in remote and very remote areas a sizable proportion of Indigenous households are subject to overcrowding. Several of the RSD communities are subject to substantial overcrowding.[333]
The RSD communities were provided with targeted housing investment through NPARIH. Much of the additional investment occurred after the 2011 Census and the impact is not fully captured. Despite this the Census data show greater reductions in the rate of overcrowding in the RSD communities than for Indigenous households across remote and very remote areas. Table 7.13 shows the NPARIH works across the RSD communities. Most of the new houses were completed after 2010–11 and would therefore not be reflected in the 2011 Census data.
Table 7.13 NPARIH works at RSD communities, 2010‑11 to 2013‑2014
|
New Houses to 2010-11 (cumulative) |
Refurbishments to 2010-11 (cumulative) |
New Houses to 2013-14* (cumulative) |
Refurbishments to 2013-14* (cumulative) |
||
|---|---|---|---|---|---|
|
Amata |
30 |
34 |
33 |
42 |
|
|
Angurugu |
18 |
10 |
60 |
35 |
|
|
Ardyaloon |
1 |
3 |
48 |
64 |
|
|
Aurukun |
10 |
37 |
63 |
68 |
|
|
Beagle Bay |
15 |
50 |
15 |
67 |
|
|
Coen |
0 |
0 |
3 |
0 |
|
|
Doomadgee |
22 |
54 |
46 |
108 |
|
|
Fitzroy Crossing |
30 |
52 |
73 |
77 |
|
|
Galiwinku |
11 |
24 |
90 |
74 |
|
|
Gapuwiyak |
0 |
0 |
51 |
51 |
|
|
Gunbalanya |
23 |
45 |
62 |
70 |
|
|
Halls Creek |
24 |
48 |
29 |
48 |
|
|
Hermannsburg (Ntaria) |
0 |
0 |
32 |
66 |
|
|
Hope Vale |
10 |
69 |
21 |
119 |
|
|
Lajamanu |
0 |
0 |
17 |
82 |
|
|
Maningrida |
47 |
32 |
125 |
117 |
|
|
Milingimbi |
0 |
0 |
69 |
47 |
|
|
Mimili |
26 |
26 |
31 |
26 |
|
|
Mornington Island |
0 |
44 |
16 |
90 |
|
|
Mossman Gorge |
0 |
0 |
0 |
0 |
|
|
Nguiu |
51 |
91 |
90 |
160 |
|
|
Ngukurr |
0 |
57 |
59 |
60 |
|
|
Numbulwar |
0 |
0 |
65 |
53 |
|
|
Umbakumba |
12 |
34 |
18 |
42 |
|
|
Wadeye |
100 |
104 |
105 |
117 |
|
|
Walgett |
7 |
81 |
23 |
81 |
|
|
Wilcannia |
2 |
50 |
11 |
65 |
|
|
Yirrkala |
0 |
0 |
6 |
8 |
|
|
Yuendumu |
0 |
0 |
0 |
10 |
|
|
All RSDs |
439 |
945 |
1,261 |
1,847 |
* Cumulative total completed to 31 December 2013
Source: NAPRIH Administrative data
Change 2006 to 2011
Across the RSD communities the average level of Indigenous overcrowding fell from 57.9 per cent in 2006 to 53.3 per cent in 2011 (Table 7.14). This is a fall of 4.6 percentage points. Falls in the average level of overcrowding occurred in 17 of the RSD communities with some of the falls being quite large. While these falls are welcome the level of overcrowding in many of the RSD communities remains very high.
Table 7.14 Indigenous households experiencing overcrowding a b 2006 and 2011
|
RSD communities |
2006 |
2011 |
Difference 2006-2011 |
|---|---|---|---|
|
|
% |
% |
% points |
|
Amata |
62.2 |
70.3 |
8.1 |
|
Angurugu |
63.1 |
68.7 |
5.6 |
|
Ardyaloon |
23.1 |
25.4 |
2.3 |
|
Aurukun |
61.1 |
61.5 |
0.5 |
|
Beagle Bay |
56.7 |
37.0 |
-19.6 |
|
Coen |
38.1 |
47.1 |
9.0 |
|
Doomadgee |
62.1 |
59.5 |
-2.6 |
|
Fitzroy Crossing |
29.1 |
36.2 |
7.1 |
|
Galiwinku |
82.4 |
84.6 |
2.2 |
|
Gapuwiyak |
89.4 |
85.4 |
-4.0 |
|
Gunbalanya |
74.6 |
74.0 |
-0.5 |
|
Halls Creek |
49.6 |
45.4 |
-4.2 |
|
Hermannsburg (Ntaria) |
64.0 |
55.1 |
-8.9 |
|
Hope Vale |
29.5 |
32.2 |
2.7 |
|
Lajamanu |
72.0 |
56.8 |
-15.2 |
|
Maningrida |
80.3 |
84.2 |
3.9 |
|
Milingimbi |
77.7 |
78.0 |
0.3 |
|
Mimili |
65.6 |
41.7 |
-24.0 |
|
Mornington Island |
43.4 |
40.7 |
-2.6 |
|
Mossman Gorge |
46.9 |
24.1 |
-22.7 |
|
Nguiu |
42.5 |
46.1 |
3.7 |
|
Ngukurr |
68.1 |
75.3 |
7.2 |
|
Numbulwar |
73.1 |
65.1 |
-8.0 |
|
Umbakumba |
66.0 |
60.3 |
-5.7 |
|
Wadeye |
89.6 |
64.9 |
-24.7 |
|
Walgett |
20.5 |
15.0 |
-5.5 |
|
Wilcannia |
25.6 |
25.4 |
-0.1 |
|
Yirrkala |
79.9 |
50.7 |
-29.2 |
|
Yuendumu |
68.2 |
51.2 |
-17.0 |
|
All RSDs |
57.9 |
53.3 |
-4.6 |
a Households requiring one or more extra bedrooms.
b Applicable to occupied private dwellings, excluding 'Visitors only' and 'Other non-classifiable' households. It is a comparison of the number of bedrooms in a dwelling with a series of household demographics, such as the number of usual residents, their relationship to each other, age and sex. It is based on the Canadian National Occupancy Standard.
Source: Census 2006 and 2011, unpublished data.
7.5.4 Severe overcrowding
The standard overcrowding data does not provide information on the severity of overcrowding as a household that requires several additional bedrooms is counted in the same way as a household that requires one or more bedrooms. For this reason it is also worth looking at the proportion of households that require three or more additional bedrooms as a measure of severe overcrowding. The level of severe overcrowding fell in 21 of the 29 RSD communities from 2006 to 2011 (Table 7.15). Across the RSD communities as a whole the severe overcrowding rate fell from 31.3 per cent in 2006 to 24.8 per cent in 2011, a fall of 6.4 percentage points.
Table 7.15 Indigenous households experiencing severe overcrowding a b 2006 and 2011
|
RSD communities |
2006 |
2011 |
Difference 2006-2011 |
|---|---|---|---|
|
|
% |
% |
% points |
|
Amata |
33.3 |
32.8 |
-0.5 |
|
Angurugu |
36.9 |
26.7 |
-10.2 |
|
Ardyaloon |
7.7 |
0.0 |
-7.7 |
|
Aurukun |
38.2 |
28.0 |
-10.1 |
|
Beagle Bay |
16.7 |
11.1 |
-5.6 |
|
Coen |
9.5 |
11.8 |
2.2 |
|
Doomadgee |
30.1 |
22.5 |
-7.6 |
|
Fitzroy Crossing |
6.7 |
8.1 |
1.3 |
|
Galiwinku |
56.3 |
67.3 |
11.1 |
|
Gapuwiyak |
63.5 |
58.3 |
-5.2 |
|
Gunbalanya |
45.6 |
45.8 |
0.2 |
|
Halls Creek |
14.3 |
16.9 |
2.6 |
|
Hermannsburg (Ntaria) |
33.0 |
32.7 |
-0.3 |
|
Hope Vale |
6.6 |
5.7 |
-0.9 |
|
Lajamanu |
33.3 |
24.7 |
-8.6 |
|
Maningrida |
62.1 |
60.3 |
-1.8 |
|
Milingimbi |
62.8 |
53.0 |
-9.8 |
|
Mimili |
34.4 |
12.5 |
-21.9 |
|
Mornington Island |
15.9 |
16.4 |
0.5 |
|
Mossman Gorge |
9.4 |
0.0 |
-9.4 |
|
Nguiu |
14.7 |
10.9 |
-3.8 |
|
Ngukurr |
35.3 |
40.9 |
5.6 |
|
Numbulwar |
42.3 |
24.1 |
-18.2 |
|
Umbakumba |
24.5 |
14.7 |
-9.8 |
|
Wadeye |
66.9 |
30.6 |
-36.3 |
|
Walgett |
2.1 |
1.7 |
-0.4 |
|
Wilcannia |
4.4 |
7.9 |
3.5 |
|
Yirrkala |
50.3 |
24.7 |
-25.7 |
|
Yuendumu |
28.4 |
20.7 |
-7.7 |
|
All RSDs |
31.3 |
24.8 |
-6.5 |
a Households requiring one or more extra bedrooms.
b Applicable to occupied private dwellings, excluding 'Visitors only' and 'Other non-classifiable' households. It is a comparison of the number of bedrooms in a dwelling with a series of household demographics, such as the number of usual residents, their relationship to each other, age and sex. It is based on the Canadian National Occupancy Standard.
Source: Census 2006 and 2011, unpublished data.
7.5.5 Comparison by remoteness
The level of overcrowding and severe overcrowding is substantially higher in remote and very remote parts of the NT than in any of the other RSD jurisdictions, as shown in Table 7.16. For example in 2011, 60.4 per cent of all Indigenous households in very remote areas of the NT were subject to overcrowding and 30.2 per cent subject to severe overcrowding. These are much higher than in any of the other RSD jurisdictions.
The reduction in overcrowding and severe overcrowding that has occurred in the RSD communities is substantially larger than the change across remote and very remote areas in general (comparing Table 6.10 with Tables 6.9 and 6.8). For example the rate of severe overcrowding among Indigenous households fell by 6.4 percentage points from 2006 to 2011 across the RSD communities. The average reduction in Indigenous severe overcrowding across very remote Australia from 2006 to 2011 was 1.4 percentage points.
Table 7.16 Indigenous households experiencing overcrowding and severe overcrowding a for 2006 and 2011
|
Dwellings needing one or more extra bedrooms |
Dwellings needing three or more extra bedrooms |
|||||
|---|---|---|---|---|---|---|
|
2006 |
2011 |
Change 2006-2011 |
2006 |
2011 |
Change 2006-2011 |
|
|
% |
% |
% points |
% |
% |
% points |
|
|
New South Wales |
||||||
|
Remote Australia |
14.3 |
10.0 |
-4.3 |
1.6 |
0.9 |
-0.7 |
|
Very Remote Australia |
16.4 |
14.5 |
-2.0 |
2.9 |
2.4 |
-0.5 |
|
Total |
10.0 |
9.9 |
-0.1 |
0.5 |
0.5 |
0.1 |
|
Queensland |
||||||
|
Remote Australia |
22.6 |
23.6 |
1.1 |
4.4 |
5.0 |
0.6 |
|
Very Remote Australia |
28.5 |
27.1 |
-1.4 |
7.8 |
5.8 |
-2.0 |
|
Total |
14.8 |
13.6 |
-1.2 |
1.8 |
1.5 |
-0.3 |
|
South Australia |
||||||
|
Remote Australia |
10.7 |
13.3 |
2.6 |
0.9 |
0.7 |
-0.1 |
|
Very Remote Australia |
33.3 |
30.5 |
-2.7 |
11.9 |
11.5 |
-0.4 |
|
Total |
11.8 |
10.7 |
-1.0 |
1.4 |
1.4 |
0.0 |
|
Western Australia |
||||||
|
Remote Australia |
19.1 |
18.7 |
-0.3 |
2.8 |
3.1 |
0.3 |
|
Very Remote Australia |
35.5 |
33.4 |
-2.1 |
11.4 |
9.9 |
-1.5 |
|
Total |
16.0 |
15.6 |
-0.4 |
2.9 |
2.7 |
-0.2 |
|
Northern Territory |
||||||
|
Remote Australia |
33.5 |
26.6 |
-6.9 |
11.5 |
6.2 |
-5.2 |
|
Very Remote Australia |
58.2 |
60.4 |
2.2 |
29.4 |
30.2 |
0.8 |
|
Total |
38.5 |
37.5 |
-1.0 |
16.0 |
15.1 |
-0.9 |
|
Australia |
||||||
|
Remote Australia |
22.3 |
20.1 |
-2.2 |
5.1 |
3.9 |
-1.2 |
|
Very Remote Australia |
40.5 |
38.9 |
-1.6 |
16.3 |
15.0 |
-1.4 |
|
Total |
13.6 |
12.9 |
-0.8 |
2.1 |
1.9 |
-0.3 |
a Applicable to occupied private dwellings, excluding 'Visitors only' and 'Other non-classifiable' households. It is a comparison of the number of bedrooms in a dwelling with a series of household demographics, such as the number of usual residents, their relationship to each other, age and sex. It is based on the Canadian National Occupancy Standard.
Source: Census 2006 and 2011, unpublished data.
7.6 Safe communities
7.6.1 Key findings
Overall, no clear patterns of change in reported crime were evident across all RSD communities, and there were no consistent differences in trends when compared with selected non-RSD communities. Recent decreases in recorded crime in some RSD communities[334] are likely to be a downturn after an increase in recorded incidents and/or offences post-implementation of an additional police presence. Further monitoring will indicate whether there is a real change in crime levels.
Separate analysis of trends is examined for each jurisdiction due to differences in data:
- In NSW, the two RSD and two comparison non- RSD communities experienced similar downward trends in rates of recorded offences over the eight year period 2004–05 to 2011–12.
- In Qld, each of the six RSD communities had its own distinct pattern of trends in offence numbers over the eight year period 2004–05 to 2011–12. There were broadly similar trends in key offence categories for both the RSD and non-RSD communities.
- In SA, aside from a marked increase in 2009–10 when police stations were established, both RSD communities had an overall downward trend in the rate of offences over a nine year period 1 July 2004 to 30 April 2013.
- In WA, over an eight year period (from 2004–05 to 2011–12), the three[335] RSD locations had distinct and different trends. When compared to two non-RSD communities, no clear differences emerged.
- In the NT, over five years from 2007–08 to 2011–12, recorded incidents that had at least one offence attached[336] declined since a peak in 2009–2010 in both the 15 RSD and 12 non-RSD communities, however the degree and rate of decrease were greater in RSD communities.
In many RSD and some non-RSD communities there was evidence that the number and proportion of offences or incidents recorded as related to alcohol had declined. In the two SA RSD communities there was a virtual cessation of incidents recorded as related to petrol sniffing after 2006–07.
7.6.2 Introduction
This section looks at police-recorded incidents and/or offences for RSD communities, by jurisdiction. Safe communities is one of the building blocks of Closing the Gap, and levels and trends in police recorded data are indicators of how much crime is occurring, and whether it is changing.
Police data was requested from jurisdictions and analysed by the Australian Institute of Criminology for RSD communities and a selection of comparison communities (or in the case of SA, a regional area) within a jurisdiction. As the size of communities varies, population estimates were used where available to calculate rates of offences per 1,000 persons.
It was important to include a comparison with selected non-RSD communities to identify any trends unique to RSD communities and not part of a broader trend. The number and size of comparison communities or region varied by jurisdiction with detail provided under the results for each jurisdiction.
The analysis focused on police recorded incident data, where an offence was recorded. Where more than one offence may be recorded for an incident, the most serious offence is typically used in the analysis. Particular attention was paid to trends in offences related to violence and social disorder, and to incidents and/or offences recorded as related to alcohol and other forms of substance misuse and to domestic and/or family violence.
The police data provided by each jurisdiction has its own unique characteristics, including the counting of incidents and offences, offence categories and the time period covered. In NSW, Qld and WA data were from 2004–05 to 2011–12, in SA from 1 July 2004 to April 2013 and in NT from 2007‑08 to 2011–12.
Given differences in the data by jurisdiction, data should not be compared across jurisdictions and each is reported separately in this section. This concentrates on trends in the total volume of recorded incidents and/or offences and the offence rate.
7.6.3 Results
New South Wales
New South Wales police data were analysed for the RSD communities of Walgett and Wilcannia and for the non-RSD communities of Collarenebri and Nyngan for the eight years from 2004–05 to 2011‑12.
The rate of police recorded incidents per 1,000 persons, for the two RSD communities is shown in Figure 7.4. Over the eight year period there was an overall downward trend for both communities. From 2004–05 to 2007–08 both communities recorded a decrease in the rate of offence category of acts intended to cause injury, (particularly for Wilcannia, where the decline was sharp). Rates for this offence category then remained steady until 2010–11 when they show a slight decline.
Both Collarenebri and Nyngan experienced downward trends in offence rates across the period, although there was an increase in the offence category of acts intended to cause injury in Collarenebri.
Except for some spikes in the data (e.g. 2006–07 in Wilcannia and Nyngan) there appears to be an overall decline in the annual number of alcohol-related incidents in all four communities over the eight year period. While there are no clear trends in the proportion or annual number of domestic/family violence-related incidents across the four communities; levels of domestic violence seem to be declining in Walgett in recent years.
Figure 7.4 Police recorded incidents, NSW RSD communities, rate per 1,000 persons, 2004‑05 to 2011‑12
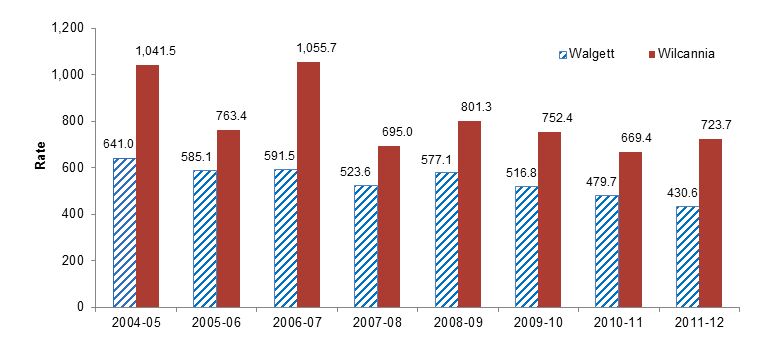
Source: NSW Police data.
Queensland
In Qld, police offence data were analysed for the six RSD communities of Aurukun, Coen, Doomadgee, Hope Vale, Mornington Island and Mossman Gorge and six non-RSD Indigenous communities[337] for the eight year period 2004–05 to 2011–12. During this time the total number of offences in the six RSD communities ranged from 461 in Mossman Gorge to 7,243 for Aurukun.
Across the six RSD communities for the eight year period just over one-half (55%) of all offences were recorded as being alcohol and/or other drug (AOD) related. The number and proportion of offences that were AOD-related dropped by half from 2004–05 to 2011–12 in Aurukun[338] while Doomadgee had a generally downward trend until an increase was recorded in 2011–12. In the non‑RSD communities, there was a decline in offences recorded as AOD-related from 2007–08.
Over the eight year period there was considerable variation between the RSD communities and within RSD communities in the annual number and proportion of offences recorded by police as domestic violence-related.
The annual total of major offence categories were aggregated for the RSD communities and for the six non-RSD communities, and the annual rate calculated based on community population estimates. Table 7.17 shows similar trends in the rate for the offence category of acts intended to cause injury in RSD and non-RSD communities, with a decrease after 2005–06. Public order and traffic offence rates also peaked in both the RSD and other communities in the years 2008–09 and 2009–10.
Table 7.17 Major offence categories by year, Qld RSD and other communities, rate per 1,000 persons, 2004‑05 to 2011‑12
|
Acts intended to cause injury |
2004-05 |
2005-06 |
2006-07 |
2007-08 |
2008-09 |
2009-10 |
2010-11 |
2011-12 |
|---|---|---|---|---|---|---|---|---|
|
RSD * |
95.4 |
78.3 |
70.8 |
72.2 |
68.1 |
62.8 |
61.3 |
67.8 |
|
Other ^ |
63.3 |
82.8 |
72.6 |
66.8 |
48.1 |
67.2 |
41.1 |
50.5 |
|
Public order |
|
|
|
|
|
|
|
|
|
RSD * |
133.4 |
175.6 |
154.6 |
240.1 |
290.2 |
331.2 |
191.4 |
229.2 |
|
Other ^ |
132.2 |
128.5 |
143.1 |
114.3 |
198.7 |
204.9 |
166.8 |
144.3 |
|
Traffic and vehicle |
|
|
|
|
|
|
|
|
|
RSD * |
54.0 |
54.5 |
48.3 |
40.4 |
101.9 |
108.7 |
78.7 |
62.6 |
|
Other ^ |
48.0 |
33.1 |
31.6 |
34.9 |
65.0 |
65.9 |
51.2 |
51.0 |
|
Justice procedures |
|
|
|
|
|
|
|
|
|
RSD * |
59.6 |
56.9 |
63.5 |
68.2 |
79.3 |
85.5 |
68.5 |
78.0 |
|
Other ^ |
59.0 |
60.0 |
60.8 |
63.4 |
58.1 |
66.9 |
47.2 |
52.0 |
* Data prior to 2007-08 for Mossman Gorge was not available because the location was not recorded separately in Qld Police Service data as a geographic area.
^ Other - the communities of Kowanyama, Lockhart River, Mapoon, Napranum, Pormpuraaw and Wujal Wujal.
Source: Qld Police data.
South Australia
Police recorded offences for the two RSD communities of Amata and Mimili were analysed for the nine year period 1 July 2004 to 30 April 2013. Figure 7.5 shows, during this period, the offence rate was consistently lower in Mimili compared with Amata. There was a downward trend in the annual rate of offences for both communities from 2004–05 to 2008–09. There was a substantial increase in 2009–10 with high levels maintained in 2010–11, before dropping in the next two years.[339] The decline in the annual rate was more marked in Amata.
There was a decrease in the number and proportion of recorded alcohol-related incidents in both communities in 2008–09, and then the annual number and proportion stayed at similar levels for the next two years. For nearly every year since 2006–07, no incidents have been recorded in the two communities as related to petrol sniffing.[340]
Rates of most major offence types are much higher in the Anangu Pitjantjatjara Yankunytjatjara (APY Lands) local government area (where the two RSD communities are located) than in regional SA or in SA overall. Rates of minor assault and in break and enters have tended to increase in the APY Lands area in recent years, while tending to decrease in regional and total SA.
Figure 7.5 Police recorded offences, SA RSD communities, rate per 1,000 persons, 1 July 2004 to 30 April 2013 *
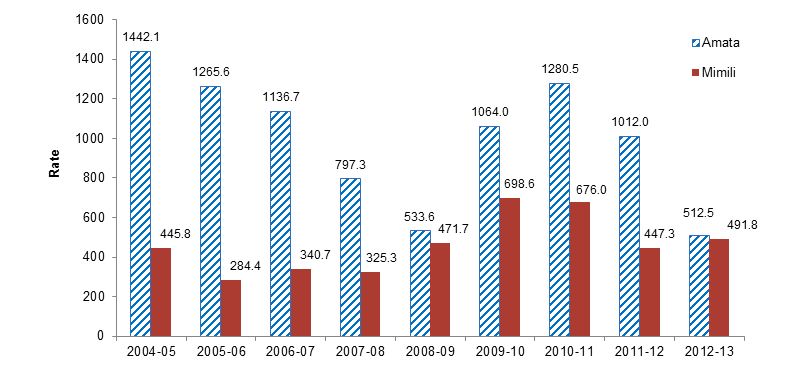
* Only partial data was available for 2012-13 to 30 April 2013.
Source: SA Police data.
Western Australia
Police recorded incidents in the three RSD locations of Fitzroy Crossing, Halls Creek and Dampier Peninsula[341], and the two non-RSD communities of Marble Bar and Wyndham were analysed for the eight year period 2004–05 to 2011–12.
From 2004–05 to 2011–12, the three RSD locations had distinct and different trends. Figure 7.6 shows the number of incidents in Fitzroy Crossing gradually increased from 2005–06 to 2011–12, while the annual number recorded in Hall’s Creek fell sharply in 2008–09, and remained at this lower level in 2010–11 and 2011–12. There were no incidents recorded in Dampier Peninsula in 2004–05, only three in 2005–06 and 39 in 2006–07, compared with between 65 and 85 in the subsequent years. This is likely to reflect the lack of a full-time police presence in the area prior to the establishment of a multi-function police centre at Djarindjin early in 2007.
In the RSD locations the proportion and number of incidents considered by police to be domestic/family violence-related followed the same general pattern as assault offences and alcohol-related incidents. There was an increase in the number and proportion in 2008–09 and to 2011–12 in Fitzroy Crossing, while in Hall’s Creek, the number and proportion increased from 2004–05 to 2008‑09 and then declined in the next two years.
When the RSD locations were compared with non–RSD communities there was no clear overall pattern of change across the communities.[342]
Figure 7.6 Police recorded incidents, WA RSD communities, 2004‑05 to 2011‑12
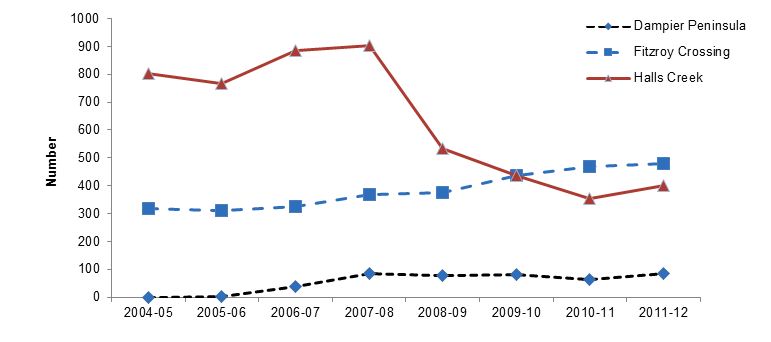
Source: WA Police data.
Northern Territory
Northern Territory police data were analysed for 15 RSD communities[343] for the five year period 2007‑08 to 2011–12. Aggregated police data for remote comparison communities were also examined, focusing on the 12 non-RSD communities[344] with the highest volume of recorded incidents that had at least one offence attached.[345]
From 2007–08 to 2011–12, of the 15 RSD communities, overall recorded incident rates were highest in the communities of Hermannsburg (Ntaria) and Yuendumu. Both communities have shown a marked decline in the most recent two to three years, to levels similar to some other RSD communities.
Fourteen of the 15 RSD communities show decreases in the rates of recorded incidents in 2011–12 compared with the previous year, and nine of the fifteen show decreases in 2010–11 compared with 2008–09. Having reached peak levels for the five year period in 2009–10, the rate of recorded incidents in the RSD communities seem to be generally decreasing. These decreases have been most apparent in those recorded incidents with offence categories most likely to be detected and recorded through proactive policing, that is, public order, traffic and drink driving offences.[346]
The number and proportion of recorded incidents flagged as ‘alcohol-related’ fell steadily across all the RSD communities from 2008–09 to 2011–12, although there may be some variation by community. While the proportion of recorded incidents flagged as ‘domestic violence related’ remained at similar levels, there was an increase in the number for the NT RSD communities.
Within the 12 non-RSD remote communities, there was considerable fluctuation in the annual totals of recorded incidents in several communities, while two showed consistent increases for each of the five years, and one showed a consistent decline. Based on the data, there have been overall reductions in recent years in both the 15 RSD and 12 non-RSD communities. The degree and rate of decrease have been greater in RSD communities (see Figure 7.7).
Figure 7.7 Police recorded incidents with at least one offence attached, occurring in NT RSD communities and selected non-RSD communities *, percentage change compared with previous year, 2007‑08 to 2011‑12
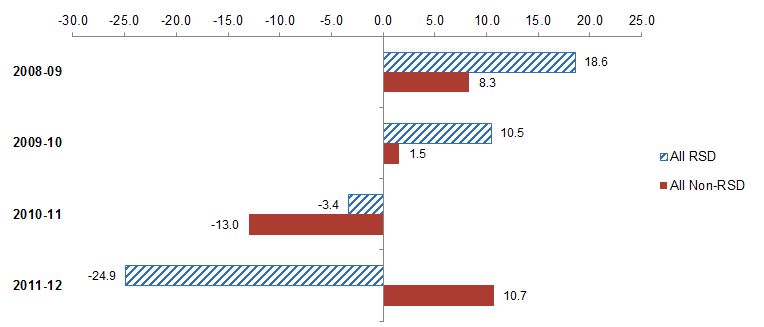
* Selected non-RSD communities were the 12 non-RSD communities with the highest volume of recorded incidents with one or more offence attached.
Source: NT Police data.
7.7 Economic participation
Progress in Closing the Gap in economic participation for residents of RSD communities is measured by examining Census data on employment outcomes. Progress can also be understood further by examining government administrative data about changes in the number of people who are dependent on welfare payments and trends in job seekers registered as looking for work and using employment assistance provided by Job Services Australia. All three indicators are covered below.
7.7.1 Labour market outcomes
Key findings
Change in the employment situation of Indigenous Australians is best measured using the ‘employment rate’, using Census data on the proportion of people aged 15-64 who are employed. As the Census conducted in August 2011 took place after less than a year of implementation of LIPs in most RSD communities, it is too soon to expect to reflect any improvements in employment associated with activities in the LIPs.
Census employment data are affected by reforms to Community Development Employment Projects (CDEP) since 2009. Reductions to CDEP have led to a fall in the total Indigenous employment rate across Australia between 2006 and 2011, as CDEP has been counted as employment in official figures. About a third of RSD communities saw falls in the employment rate of 20 per cent from 2006 to 2011, with transition of CDEP participants who were previously considered ‘in employment’ to income support payments.
Given these changes, the best measure of increased economic participation in the RSD communities is growth in non-CDEP employment. The Census figures indicate that non-CDEP employment rose between 2006 and 2011 in all but two of the 29 RSD communities. Most communities saw increases of over 10 per cent. These increases in non-CDEP employment are not unique to RSD communities, as there was a similar rise of 10.5 per cent in non-CDEP employment in very remote areas. This is partly a result of conversion of CDEP positions into government-funded paid positions.
Introduction
Employment outcomes can be measured in several ways. Two measures of labour market outcomes are the ‘labour force participation rate’ and the ‘employment rate’. The labour force participation rate represents the proportion of all people aged 15 and above who are either employed or unemployed (that is they are in the labour force). The Closing the Gap target is to halve the gap between Indigenous and non-Indigenous Australians in employment within a decade. This target is measured using data on the proportion of people aged 15-64 only, who are employed.
The most accurate measure of change is the ‘employment rate’, rather than the ‘labour force participation rate’ or the often used ‘unemployment rate’. While is an often-quoted statistic, the unemployment rate can be highly misleading for remote Indigenous communities. This is due to the way the ABS generally classifies people who are not actively looking for work as being outside the labour force.[347]
In analysing data on Indigenous employment it is important to understand that the ABS treats CDEP participants in 2006 and 2011 Censuses as being employed. The fall in the number of CDEP participants from 2006 to 2011 has had an important impact on the employment rate for Indigenous people.
National reforms to CDEP took place from 1 July 2009. These reforms involved the closure of CDEP activities in all non-remote locations. Receipt of CDEP wages began to be phased out, with all new participants in CDEP receiving an income support payment (typically Newstart), as opposed to a CDEP wage. Existing participants at 30 June 2009 (known as ‘grandfathered participants’) have been able to continue accessing wages. Most CDEP participants are now in receipt of income support payments rather than CDEP wages. This means that the historical justification for treating CDEP participants as being employed no longer has substantive merit. Even the historical treatment was questionable as many people do not consider CDEP to be equivalent to mainstream employment because, among other things, the wages that CDEP participants were paid were very similar to income support payments.
Employment rate
A key policy goal over recent years has been to increase mainstream, non-CDEP employment, rather than increase the number of CDEP participants. From a policy perspective, changes in non-CDEP employment are more relevant than changes in total employment including CDEP participants.
According to the Census, the non-Indigenous employment rate was 71.7 per cent in 2006 considerably higher than the Indigenous employment rate of 48 per cent. While the non-Indigenous employment rose to 72.2 per cent in 2011, the Indigenous employment rate fell to 46.2 per cent at that time. However, the decline in the Indigenous employment rate was entirely explained by a fall in the number of CDEP participants.
The Census collects some data on CDEP participants through the Interviewer Household Form which is primarily used in discrete Indigenous communities. The Census does not provide a full count of CDEP participants and does not fully reflect declines in the number of CDEP participants in recent years.[348] However, even the partial adjustment that is possible with Census data show that the mainstream, non-CDEP Indigenous employment rate rose from 2006 to 2011. The Census data show that 44.7 per cent of Indigenous people aged from 15 and 64 years were employed in mainstream jobs in 2011, which is up from 42.4 per cent in 2006. Using administrative data on CDEP participants with estimates of total employment from the Census, the proportion of all Indigenous Australians aged 15–64 who were employed in a non-CDEP job increased from 37 per cent in 2006 to 44 per cent in 2011.
Given the impact of CDEP on measured Indigenous employment it is important to assess the employment data for the RSD communities both with and without CDEP participants. As the Interviewer Household Form was used in all of the RSD communities, the Census data can be used to estimate non-CDEP employment rates. However, it should be noted that in the two NSW RSD communities of Walgett and Wilcannia and in two of the four WA RSD locations, Halls Creek and Fitzroy Crossing, both the Interviewer Household Form and the mainstream forms were used. This means that data on CDEP participation for these four communities may not be complete.
Across all RSD locations at 2011, the standard employment rate for Indigenous working men and women at 31.6 per cent, was lower than the comparative rate for all Indigenous Australians of the same age (46.2%). In only three communities was the employment rate above the comparative national Indigenous rate (Figure 7.8).
Figure 7.8 Employment rate, Indigenous persons 15-64 years, 2011
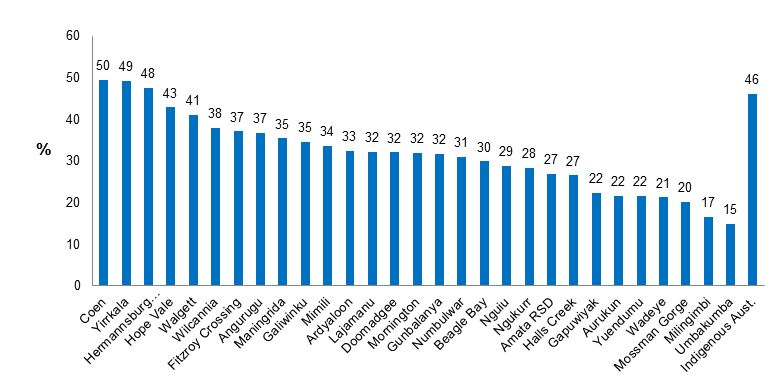
Source: Census 2011, unpublished data.
When CDEP participants are not counted as being employed, the non-CDEP employment rate falls by varying degrees across the communities in 2011. In Walgett, the rate remains the same as there are no CDEP participants reported in 2011. By contrast, the non-CDEP employment rate in Maningrida falls from 35.5 per cent to 16.3 per cent (Figure 7.9)
Figure 7.9 Non-CDEP employment rate, Indigenous persons 15-64 years, 2011
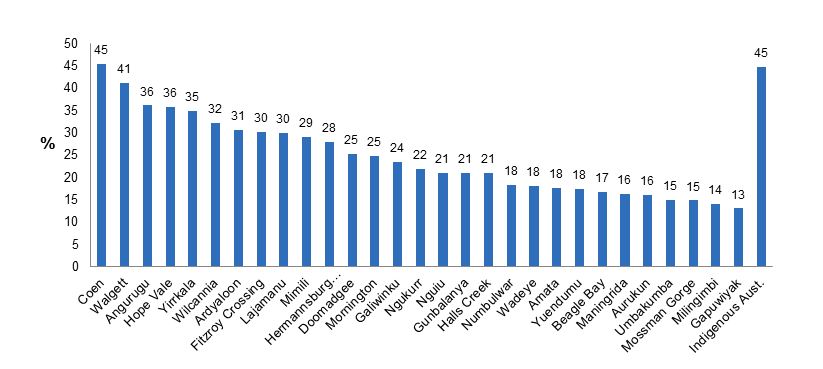
Source: Census 2011, unpublished data.
Growth in non-CDEP jobs is evident when the non-CDEP employment rate is examined for each RSD location for both 2006 and 2011. The standard employment rate declined for more than two-thirds of all RSD communities between 2006 and 2011, but when CDEP participants are excluded, all but two communities experienced growth in the non-CDEP employment rate. As an example, the standard employment rate at Gunbalanya fell by 10 percentage points from 2006 to 2011 while the non-CDEP employment actually rose by 12 percentage points (Figures 7.10 and 7.11).
While the increases in non-CDEP employment rates are welcome the proportion of all Indigenous adults in the RSD communities who are employed remains very low. In all RSD communities most Indigenous adults of workforce age are not employed.
Figure 7.10 Change in employment rate between 2006 and 2011,
Indigenous persons 15-64 years
.JPG)
Source: Census 2006 and 2011, unpublished data.
Seven communities had increases in non-CDEP employment of more than 20 per cent, ten communities had increases between 10 and 20 per cent, and nine communities had increases under 10 per cent (Figure 7.6). Note that 2006 Census data for Milingimbi are not available. The result for Beagle Bay should be treated with caution as the number of people is very small. The fall in the non-CDEP employment rate in Halls Creek was also small. The key conclusion from Figure 7.6 is that non-CDEP employment rates have risen across the RSD communities.
Figure 7.11 Change in non-CDEP employment rate between 2006 and 2011, Indigenous persons 15-64 years
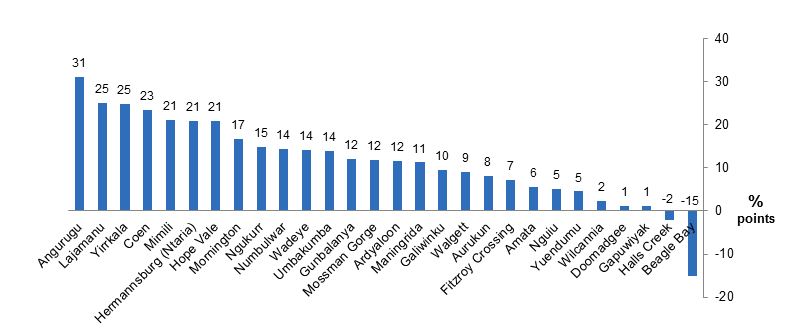
Source: Census 2006 and 2011, unpublished data.
While the improvements in non-CDEP employment rates across the RSD communities are positive it is important to provide some comparative perspective as the changes may be part of a broader trend.
All of the 29 RSD communities are in remote or very remote areas, with the exception of Mossman Gorge (which is in outer regional Australia). Most of the RSD communities (with the exception of Walgett, Wilcannia, Wadeye and Hope Vale) are in very remote Australia rather than remote Australia.
Table 7.18 shows Indigenous employment rates for each of the RSD jurisdictions for remote and very remote areas. The table shows a distinct pattern – total Indigenous employment rates fell in remote and very remote areas from 2006 to 2011. However, this reflects the impact of changes to CDEP as non-CDEP employment rates improved from 2006 to 2011 particularly in very remote areas. The largest improvement was in very remote parts of the NT where the non-CDEP employment rate increased by 12.1 percentage points from 2006 to 2011.
While the improvement in the non-CDEP employment rates in the RSD communities is positive the data in Table 7.18 suggests that it is part of a broader trend in remote and very remote areas. This trend reflects changes such as the CDEP conversion process through which jobs that were previously filled by CDEP participants were converted into regular jobs with standard pay and conditions.
Table 7.18 Indigenous employment rates in the RSD communities, 15-64 years
|
Employment rate |
Non-CDEP employment rate |
|||||
|---|---|---|---|---|---|---|
|
2006 |
2011 |
Change |
2006 |
2011 |
Change |
|
|
|
% |
% |
% points |
% |
% |
% points |
|
New South Wales |
|
|
|
|
|
|
|
Remote |
41.4 |
42.9 |
1.5 |
39.0 |
42.3 |
3.4 |
|
Very Remote |
42.2 |
39.8 |
-2.4 |
34.4 |
36.7 |
2.3 |
|
Total |
45.6 |
46.8 |
1.2 |
44.9 |
46.7 |
1.7 |
|
Queensland |
||||||
|
Remote |
51.8 |
44.9 |
-6.9 |
38.9 |
41.2 |
2.3 |
|
Very Remote |
61.1 |
49.8 |
-11.2 |
32.2 |
42.5 |
10.3 |
|
Total |
53.6 |
48.8 |
-4.7 |
47.1 |
47.6 |
0.5 |
|
South Australia |
||||||
|
Remote |
46.4 |
43.8 |
-2.6 |
46.4 |
43.8 |
-2.6 |
|
Very Remote |
49.8 |
39.5 |
-10.4 |
24.4 |
31.9 |
7.5 |
|
Total |
44.7 |
42.2 |
-2.5 |
40.4 |
41.1 |
0.7 |
|
Western Australia |
||||||
|
Remote |
48.3 |
44.8 |
-3.5 |
45.0 |
44.2 |
-0.8 |
|
Very Remote |
54.0 |
40.5 |
-13.6 |
20.2 |
29.1 |
9.0 |
|
Total |
47.2 |
42.4 |
-4.8 |
37.6 |
39.6 |
2.0 |
|
Northern Territory |
||||||
|
Remote |
40.2 |
36.6 |
-3.6 |
26.8 |
33.2 |
6.4 |
|
Very Remote |
35.4 |
33.0 |
-2.4 |
10.5 |
22.6 |
12.1 |
|
Total |
38.9 |
37.2 |
-1.8 |
21.3 |
30.3 |
9.0 |
|
Australia |
||||||
|
Remote |
45.7 |
42.4 |
-3.4 |
36.9 |
40.1 |
3.2 |
|
Very Remote |
47.3 |
39.5 |
-7.7 |
19.7 |
30.1 |
10.5 |
|
Total |
48.0 |
46.3 |
-1.7 |
42.4 |
44.7 |
2.3 |
Source: Census 2006 and 2011, unpublished data.
Limitations of using the unemployment rate
While the unemployment rate is an often-quoted statistic, it can be highly misleading for remote Indigenous communities. At the time of the 2006 Census, recipients of Newstart in remote communities were generally not required to actively look for work because of remote area exemptions. This has important implications for the unemployment rate. If a Newstart recipient is not actively looking for work, they will not be classified as being unemployed by the ABS in Census or other data, by definition. Many of these people will be classified by the ABS as being outside the labour force.
All remote area exemptions across Australia had been removed by late 2008. In summary, remote area exemptions were in place in remote Indigenous communities at the time of the 2006 Census but had been removed by the time the 2011 Census was conducted. This explains why the measured Indigenous unemployment rate rose from 2006 to 2011 in all but two RSD communities.
It would obviously not be valid to infer from Table 7.19 that labour market conditions have worsened in the RSD communities. In reality, the proportion of people who are employed in a properly paid job (as opposed to being outside the labour force or unemployed) has risen across all but two of these communities. Table 7.19 also clearly shows that the unemployment rate can be a misleading statistic in remote Indigenous communities. In 2006 the Indigenous unemployment rate in Amata was zero despite the fact that the Indigenous employment rate in Amata was very low.
Table 7.19 Indigenous unemployment rate *, 15-64 years, change from 2006 to 2011
|
2006 |
2011 |
Change 2006 - 2011 |
|
|---|---|---|---|
|
% |
% |
% points |
|
|
New South Wales |
|||
|
Walgett RSD |
23.0 |
16.7 |
-6.3 |
|
Wilcannia RSD |
19.0 |
25.9 |
6.9 |
|
Queensland |
|||
|
Aurukun RSD |
10.0 |
29.8 |
19.8 |
|
Coen RSD |
5.0 |
10.6 |
5.6 |
|
Doomadgee RSD |
7.0 |
24.3 |
17.3 |
|
Hope Vale RSD |
5.0 |
33.0 |
28.0 |
|
Mornington RSD |
6.0 |
20.6 |
14.6 |
|
Mossman Gorge RSD |
0.0 |
40.0 |
40.0 |
|
South Australia |
|||
|
Amata RSD |
0.0 |
8.2 |
8.2 |
|
Mimili RSD |
10.0 |
15.7 |
5.7 |
|
Western Australia |
|||
|
Ardyaloon RSD |
10.0 |
31.2 |
21.2 |
|
Beagle Bay RSD |
7.0 |
24.1 |
17.1 |
|
Fitzroy Crossing RSD |
2.0 |
10.6 |
8.6 |
|
Halls Creek RSD |
21.0 |
31.8 |
10.8 |
|
Northern Territory |
|
|
|
|
Angurugu RSD |
7.0 |
15.5 |
8.5 |
|
Galiwinku RSD |
22.0 |
15.2 |
-6.8 |
|
Gapuwiyak RSD |
30.0 |
18.1 |
-11.9 |
|
Gunbalanya RSD |
4.0 |
20.1 |
16.1 |
|
Hermannsburg RSD |
10.0 |
7.8 |
-2.2 |
|
Lajamanu RSD |
7.0 |
24.8 |
17.8 |
|
Maningrida RSD |
14.0 |
24.4 |
10.4 |
|
Milingimbi RSD |
np |
48.6 |
|
|
Nguiu RSD |
12.0 |
9.3 |
-2.7 |
|
Ngukurr RSD |
9.0 |
40.6 |
31.6 |
|
Numbulwar RSD |
10.0 |
48.4 |
38.4 |
|
Umbakumba RSD |
0.0 |
47.5 |
47.5 |
|
Wadeye RSD |
6.0 |
32.2 |
26.2 |
|
Yirrkala RSD |
10.0 |
5.9 |
-4.1 |
|
Yuendumu RSD |
19.0 |
39.5 |
20.5 |
* unemployment rate = unemployed/labour force – Indigenous Persons 15-64 years (%).
Source: Census 2006 and 2011, unpublished data.
The rise in the unemployment rate in the RSD communities is not unique – it is part of a broader trend that reflects changes to CDEP and the lifting of the remote area exemptions. As Figure 7.12 shows the Indigenous unemployment rate rose in outer regional, remote and very remote areas from 2006 to 2011. In contrast the Indigenous unemployment rate fell in the major cities and in inner regional areas from 2006 to 2011.
Figure 7.12 Indigenous unemployment rate 15-64 years by remoteness, 2006 and 2011
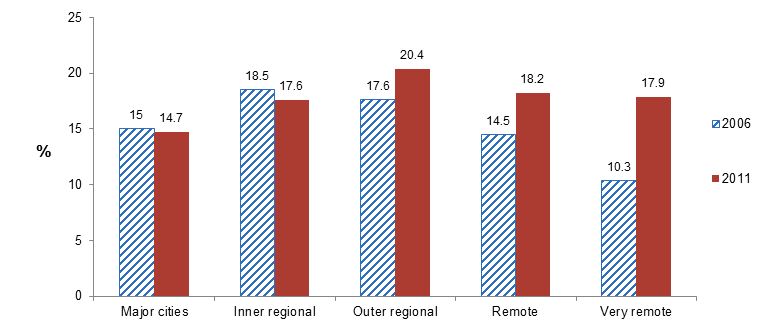
Source: Census 2006 and 2011.
7.7.2 Welfare dependence – Income Support and CDEP Wages
Key findings
The combined number of people on income support payments and CDEP Wages is the best measure to assess if welfare dependency has been reduced in the RSD communities. Changes to CDEP in 2009 meant that residents who became ineligible for CDEP transitioned to other income support payments such as NewStart or Disability Support Pension.
Between 2009 and 2012, the actual number of working age people (aged 15 to 64) in RSD communities on welfare, including income support payments or CDEP wages, has remained fairly stable at around 10,700. However, increases in population levels in RSD communities mean that this represents a reduction in real terms of the proportion of working age residents on welfare payments. In several of the jurisdictions with RSD communities the increase in Centrelink income support recipients has not been as large as the decrease in CDEP Wages participants, so the combined total has tended to decrease.
Introduction
Any changes in economic participation can also be assessed by looking at welfare dependency. This section analyses changes in the number of people receiving any Centrelink income support benefits or CDEP Wages in the 29 RSD communities. The trend is only shown from 2009 to 2012 because of changes to CDEP in 2009.
From July 2009 new participants in CDEP were placed on Centrelink income support benefits (such as NewStart or Parenting Payment). It is therefore necessary to look at changes in the combined count of people on Centrelink income support payments and CDEP Wages rather than each separate payment type. Increases in one type of payment (such as NewStart) could be caused by increases in people no longer eligible for CDEP Wages moving onto Centrelink benefits. Only those people who have remained on CDEP Wages continuously since before July 2009 are not classified as Centrelink income support recipients. Hence, the combined number of people on all income support payments and on CDEP Wages represents an aggregate total count of welfare dependency that is not affected by the changes to CDEP over time.
The section analyses the trend in the number of people on income support payments and CDEP Wages only for those living in the 29 ‘parent’ RSD communities. Most parent communities have some outstations and other smaller communities associated to them. There may be regular patterns of people moving between the parent and the associated communities. However, limiting this analysis to changes in the parent community still gives an accurate picture as the main parent community contains the overwhelming majority of the total population.[349]
Trend in welfare recipients
Administrative data on people receiving Centrelink income support payments or CDEP Wages show that the pattern of welfare dependence has remained stable. Table 7.20 shows the number of individuals living in the RSD communities who receive various income support payments or are CDEP Wages participants in June of each year between 2009 and 2012. The total count of recipients of income support payments and CDEP Wages is presented in two ways – the sum of the two, and an adjusted sum, which removes the few cases of double counting when the same person with a unique customer reference number is found on both the Centrelink records and in CDEP Wages administrative data.[350]
In the RSD communities the total count of people on Centrelink benefits or on CDEP Wages is stable between 2009 and 2012. This applies for both all people living in the RSD parent communities as well as only those in the working age groups of 15 to 64 (see Table 7.20).
This stability comprises two opposite trends. While the number of people on all income support payments has increased slightly between June 2009 and June 2012, at the same time there has been a greater decline in the number of CDEP Wages participants (Table 7.20). This leads to an aggregate fall in the number of people across all 29 parent RSD communities on income support payments and CDEP Wages from 12,264 in 2009 to 11,702 in 2012. When this aggregate total is adjusted for potential double counting of people being listed on both payment types, the adjusted count of people on income support payments and CDEP Wages is very stable over these years. It stays constant around 11,700 in both June 2009 and June 2012.
Table 7.20 Number of people on income support payment by type and CDEP Wages – RSD parent communities only, 2009 to 2012
|
Type of income support payment |
Year |
|||
|---|---|---|---|---|
|
2009 |
2010 |
2011 |
2012 |
|
|
Abstudy |
280 |
268 |
269 |
237 |
|
Age pension |
823 |
844 |
843 |
825 |
|
Assistance for isolated children |
193 |
142 |
129 |
122 |
|
Austudy student |
- |
- |
- |
- |
|
Bereavement allowance |
- |
- |
- |
- |
|
Carer pension |
227 |
257 |
314 |
365 |
|
Disability support pension |
1,678 |
2,159 |
2,538 |
2,567 |
|
Exceptional Circumstance relief pay |
- |
- |
- |
- |
|
Newstart allowance |
2,593 |
3,260 |
3,413 |
3,705 |
|
Parenting partnered |
1,279 |
1,315 |
1,276 |
1,266 |
|
Parenting single |
1,251 |
1,154 |
1,153 |
1,204 |
|
Partner allowance |
- |
- |
- |
- |
|
Sickness allowance |
- |
- |
- |
- |
|
Special benefit |
- |
- |
- |
- |
|
Widow allowance |
34 |
34 |
28 |
23 |
|
Wife pension (age) |
- |
- |
- |
- |
|
Wife pension (DSP) |
- |
- |
- |
- |
|
Youth allowance |
- |
- |
- |
- |
|
Youth allowance other |
674 |
797 |
766 |
675 |
|
Youth allowance student |
- |
- |
23 |
- |
|
Total income support payments |
9,068 |
10,269 |
10,772 |
11,013 |
|
Total CDEP wages |
3,196 |
1,610 |
1,048 |
689 |
|
Grand total (CDEP + income support payments) |
12,264 |
11,879 |
11,820 |
11,702 |
|
Adjusted total (excluding overlap between income support payments and CDEP) |
11,696 |
11,140 |
11,820 |
11,702 |
|
Adjusted total (aged 15 to 64) |
10,714 |
10,188 |
10,889 |
10,763 |
Figures are counts of individuals on each income support benefit type or CDEP Wages as of June for each year listed.
Cell counts less than 20 have not been reported individually but are included in the totals.
Source: Tabulations of DEEWR Bluebook and CDEP administrative data by FaHCSIA.
Welfare dependency relative to population trends
The extent of welfare dependency should be considered in relation to trends in the total population of the RSD communities. Estimated resident population (ERPs) in the RSD communities and outstations are shown in Chapter 2.3.1. While annual ERPs at the geographical level of each RSD community are not reported by the ABS, we have derived population estimates for each RSD community by assuming that over time the resident population growth within each RSD community and its outstations has been at the same rate as the growth in the larger or equivalent ABS geographical region that contains that RSD community.
Based on this approach, we estimated that the total population of the 29 RSD communities increased by around 13 per cent between 2001 and 2012. When broken down over shorter time periods, this increase consisted of around nine per cent increase between 2006 and 2012, and a further around four per cent increase between 2009 and 2012.[351] This increase in population size has occurred while the adjusted total number of people on Centrelink benefits or on CDEP Wages has stayed constant between 2009 and 2012. This indicates that welfare dependency has declined in the parent RSD communities.
Table 7.18 also provides a count of the total number of working age people (aged 15 to 64) who are on any income support payments or CDEP Wages. This shows a fairly stable count of around 10,700 people in 2009 and 2012. Estimates of the resident population aged 15 to 64 are not available for the RSD communities, but this population will have increased since the total population has increased.[352] Hence if the number of working age people on Centrelink benefits or CDEP Wages were to be expressed as a ratio of the total working age population, this would also show a declining trend in welfare dependence among working age people in the RSD parent communities.
Three types of income support payments show increases in recipients over time – NewStart, Disability Support Pension and Carer Pension. The numbers on Parenting Payments (Single or Partnered) and Age Pension remained more or less the same. The offsetting decrease is observed in CDEP Wages participants, which fell from 3,196 in June 2009 to only 689 in June 2012. Since the adjusted total counts on income support payments and CDEP Wages between 2009 and 2012 are almost identical, this means that the decline of approximately 2,500 fewer people on CDEP Wages was matched by a similar increase in income support payments recipients over this period.[353]
Given that the total population of the RSD communities has increased over this time period, the stable number of people on Centrelink benefits or on CDEP Wages in the 29 RSD parent communities reflects a decrease in the extent of welfare dependency relative to the total population of the RSD communities. A decrease in the total number of people on Centrelink benefits or CDEP Wages was also found in the Cape York Welfare Reform Evaluation Report focused on the four Cape communities that are part of the RSD.
Trends by State and Territory for RSD communities
Table 7.19 presents a summary of the total number of people on income support payments and CDEP Wages where the RSD parent communities have been grouped by the state or territory where they are located. For three states (NSW, Qld and WA) the trend is similar to that of Table 7.18 in aggregate. There are larger declines in CDEP Wages participants than the increase in income support numbers, so that the adjusted total incorporating both CDEP Wages and income support payments decreases. Only small decreases are observed in NSW and Qld, but the WA based RSD communities record a 40 per cent decline in the number of people on income support payments and CDEP Wages between 2009 and 2012. The NT shows the opposite trend where in spite of the decrease in CDEP Wages participants, this decrease is not large enough to offset the increase in income support recipients, so that the adjusted total on both payments goes up by around 13 per cent between 2009 and 2012.
The RSD communities in SA (Amata and Mimili) record a substantially larger percentage increase of almost 60 per cent in the number of people on CDEP Wages and income support payments between 2009 and 2012. However, this is calculated from a relatively small base of a total of 246 people in 2009 increasing to 391 in 2012. Unlike in other communities, the number of people on CDEP Wages has increased in this period in these two SA RSD communities.
When related to the growing population size of the RSD communities in each state or territory the results in Table 7.21 show that as a proportion of the total population the number of people who are welfare reliant has decreased the most in the WA RSD communities. There have been decreases in welfare dependency in the Qld and NSW RSD communities as well, because the total number of people on income support payments or CDEP Wages has fallen between 2009 and 2012 in spite of an increase in the population in these RSD communities.
Table 7.21 Payment recipient totals by jurisdiction – RSD parent communities, 2009 to 2012
|
Jurisdiction |
Payment |
2009 |
2010 |
2011 |
2012 |
|---|---|---|---|---|---|
|
New South Wales |
CDEP Wages only |
101 |
53 |
25 |
<20 |
|
Income support payments |
1,036 |
1,057 |
1,010 |
1,017 |
|
|
Double Counted |
20 |
32 |
0 |
0 |
|
|
Adjusted Total (income support payments + CDEP Wages) |
1,117 |
1,078 |
1,035 |
1,034 |
|
|
Adjusted total (aged 15 to 64) |
856 |
814 |
790 |
804 |
|
|
Northern Territory |
CDEP Wages only |
1,346 |
823 |
705 |
478 |
|
Income support payments |
5,565 |
6,250 |
6,598 |
6,838 |
|
|
Double Counted |
415 |
470 |
0 |
0 |
|
|
Adjusted Total (income support payments + CDEP Wages) |
6,496 |
6,603 |
7,303 |
7,316 |
|
|
Adjusted total (aged 15 to 64) |
6,095 |
6,235 |
6,942 |
6,938 |
|
|
Queensland |
CDEP Wages only |
624 |
205 |
139 |
55 |
|
Income support payments |
1,351 |
1,742 |
1,753 |
1,730 |
|
|
Double Counted |
61 |
152 |
0 |
0 |
|
|
Adjusted Total (income support payments + CDEP Wages) |
1,914 |
1,795 |
1,892 |
1,785 |
|
|
Adjusted total (aged 15 to 64) |
1,752 |
1,623 |
1,728 |
1,613 |
|
|
South Australia |
CDEP Wages only |
<20 |
<20 |
63 |
34 |
|
Income support payments |
259 |
277 |
320 |
357 |
|
|
Double Counted |
<20 |
<20 |
0 |
0 |
|
|
Adjusted Total (income support payments + CDEP Wages) |
246 |
278 |
383 |
391 |
|
|
Adjusted total (aged 15 to 64) |
227 |
256 |
356 |
368 |
|
|
Western Australia |
CDEP Wages only |
1,124 |
520 |
116 |
105 |
|
Income support payments |
857 |
943 |
1,091 |
1,071 |
|
|
Double Counted |
58 |
77 |
0 |
0 |
|
|
Adjusted Total (income support payments + CDEP Wages) |
1,923 |
1,386 |
1,207 |
1,176 |
|
|
Adjusted total (aged 15 to 64) |
1,784 |
1,260 |
1,073 |
1,040 |
Figures are counts of individuals on income support benefits or CDEP Wages as of June for each year listed
Source: Tabulations of DEEWR Bluebook and CDEP administrative data by FaHCSIA
Finally, community data for each of the RSD parent communities is shown in Appendix N Tables N.5 and N.6 which present the underlying count of people on income support payments and CDEP Wages. Appendix N Table N.5 presents the counts for the total population in each RSD community, while Appendix N Table N.6 is only for people aged 15 to 64.
In ten of the RSD communities (Umbakumba, Coen, Doomadgee, Fitzroy Crossing, Halls Creek, Hope Vale, Milingimbi, Mossman Gorge, Walgett and Wilcannia) the total number of people on payments has fallen, based on comparing the adjusted total counts of person on CDEP Wages and income support payments between June 2009 and June 2012 (Appendix N Table N. 5) In two more communities the numbers are more or less the same over this period (Galiwinku and Mornington Island). The decline in Fitzroy Crossing is the most pronounced.
7.7.3 Employment assistance – Job Services Australia
Key findings
This section provides data on the trend in the caseload of job seekers registered as looking for work and other performance indicators of outcomes for Job Services Australia (JSA) in the RSD communities. The JSA data reflect labour market conditions in these communities. There is no significant difference in the trend in job seekers registered as looking for work with JSA providers in RSD communities, based on comparison of RSD and non-RSD remote communities in the relevant jurisdictions. There is also no discernable trend in the numbers of job seekers registered or commencing with JSAs or being placed into jobs from 2010 to 2013. JSA caseloads across remote areas declined over this period, indicating that the small decline in RSD communities was part of a broader trend. Commencements with JSA did not change markedly, with only a slight increase in RSD communities. The number of job placements fell slightly from 2012 to 2013 after rising the previous year in the RSD communities and the same pattern was seen in the non-RSD remote areas.
Introduction
Job Services Australia (JSA) is the Australian Government employment services system that supports job seekers and employers. A picture of trends in employment outcomes for people seeking jobs is provided by data from 2010 to 2013 on the size of the JSA caseload, job seeker commencement with services, placement in jobs and outcomes after 13 or 26 weeks. This complements other data on economic participation.
The JSA data reflect the labour market conditions in these communities through both the number of job seekers who register with JSA for different time periods and in the efficacy of the JSA network in achieving successful outcomes for the job seekers. JSA indicators for the RSD communities are compared with the corresponding indicators for other remote non-RSD communities in the relevant jurisdictions.
Trends in numbers of job seekers registered, commencing or placed in jobs
One indicator of labour market conditions and the effectiveness of the JSA network in providing employment services in RSD communities is the active caseload of the JSA providers. As at 31 March 2013, there were 8,376 job seekers in the RSD communities and their surrounding areas on the JSA caseload. This means they are registered with Centrelink as looking for work. This comprised 26.5 per cent of the JSA caseload for 2013 in remote areas in those jurisdictions that are part of RSD (NT, Qld, SA, WA and NSW). Job seekers in RSD communities have made up around one quarter of job seekers registered with JSA in remote areas in these jurisdictions from 2010 to 2013.
Yearly snapshots are available for the four years from 2010 to 2013, covering the period of implementation of RSD. Between 1 April 2010 and 31 March 2013, the overall JSA active caseload in the RSD communities decreased by about 7.4 per cent. This is in line with a general decline in JSA caseloads in non-RSD remote areas (which declined by around 11 per cent) during the period 2010 to 2013.
However, in the most recent period from 2012 to 2013 the JSA caseload increased in both the RSD communities and in the non-RSD remote areas in the same jurisdictions (see Table 7.22). When looking at the individual RSD communities, only six out of the 29 had an increase in caseload from 2010 to 2013.
Table 7.22 JSA caseload for RSD and non-RSD remote areas, 2010 to 2013 *
|
Total JSA caseload |
2010 |
2011 |
2012 |
2013 |
Per cent change 2010 to 2013 (%) |
|---|---|---|---|---|---|
|
RSD Total |
9042 |
8218 |
8178 |
8376 |
-7.4 |
|
Non-RSD Remote Total |
26,496 |
24,139 |
22,568 |
23,555 |
-11.1 |
* This table only includes totals for non-RSD community remote job seekers in states and territories that have RSD communities. Also comparison between RSD communities and all remote areas is not precise because two RSD communities, Mossman Gorge and Walgett, fall outside of DEEWR remote areas. However, the effect of these two communities on data comparison is small and they have followed similar trends.
Data as at 31 March.
Source: Administrative data provided by DEEWR.
The JSA caseload in RSD communities as a proportion of the total remote caseload increased slightly from 2010 to 2013 (shown in Figure 7.13).
Figure 7.13 Share of the RSD communities in the total JSA caseload in remote areas, 2010 to 2013
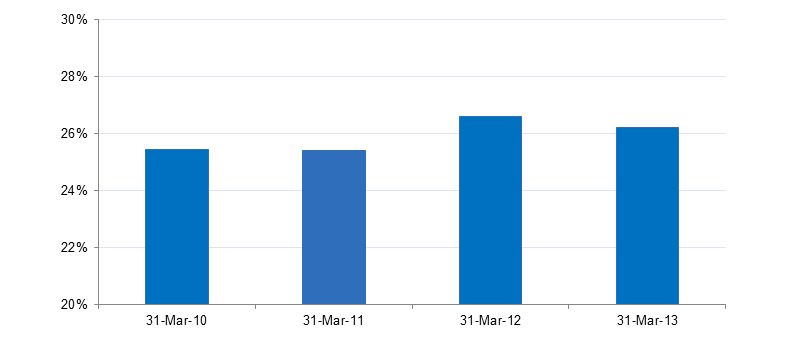
Source: Administrative data provided by DEEWR.
The number of job seekers commencing with JSA has not changed markedly over time from 2010 to 2013 (see Table 7.23). There was a slight increase in JSA commencements between 2010 and 2013 in the RSD communities across Australia and a slight decrease in JSA commencements in the non-RSD remote areas in the same jurisdictions as the RSD communities. An increase in JSA commencements may reflect the shift from CDEP to mainstream Centrelink income support payments, such Newstart, noted in Section 7.8.2. However three years may be too short to draw any conclusions about the trend.
There was an overall decrease in the number of job placements between 2010 and 2013 in the RSD communities across Australia. There was also a decrease in job placements in the non-RSD remote areas in the same jurisdictions over the same period. The number of job placements fell slightly from 2012 to 2013 after rising the previous year, and the same pattern was seen in RSD communities and non-RSD remote areas.
This suggests that the trend in JSA outcomes observed in the RSD communities mirrors a broad trend observed across other remote communities.
Table 7.23 JSA commencements, placements, and 13 and 26 week outcomes in RSD communities and non-RSD remote areas, 2010 to 2013 * ^
|
1 April 2010 – 31 March 2011 |
1 April 2011 – 31 March 2012 |
1 April 2012 – 31 March 2013 |
Per cent change 2011 to 2013 (%) |
|
|---|---|---|---|---|
|
RSD communities |
|
|
|
|
|
JSA Commencements |
5850 |
6349 |
6209 |
6.1 |
|
Job Placements |
1774 |
1885 |
1514 |
-14.7 |
|
13 Week Outcomes |
745 |
837 |
873 |
17.2 |
|
26 Week Outcomes |
417 |
464 |
506 |
21.3 |
|
Non-RSD remote areas |
|
|
|
|
|
JSA Commencements |
32450 |
31478 |
30419 |
-6.3 |
|
Job Placements |
7410 |
8767 |
6900 |
-6.9 |
|
13 Week outcomes |
3360 |
3908 |
3417 |
1.7 |
|
26 Week outcomes |
1980 |
2436 |
2102 |
6.2 |
* This table only shows figures for job seekers in states and territories that have RSD communities. Also comparison between RSD communities and all remote areas is not precise because two RSD communities, Mossman Gorge and Walgett, fall outside of DEEWR remote areas. However, these communities’ overall impact on data comparison is small, and they have followed similar trends.
^ A proportion of Job Placements and 13 and 26 week outcomes reported in any one year will be achieved by job seekers who joined the JSA caseload in previous years. In addition, a proportion of 13 and 26 week outcomes in any one year relate to jobs commenced in the previous year (i.e. right-censoring).
Data span 1 April to 31 March of the next year
Source: Administrative data provided by DEEWR
Table 7.24 JSA job placements and outcomes as a proportion of commencements in RSD communities and non-RSD remote areas, 2010 to 2013 *
|
1 April 2010 – 31 March 2011 |
1 April 2011 – 31 March 2012 |
1 April 2012 – 31 March 2013 |
||
|---|---|---|---|---|
|
|
|
% |
% |
% |
|
RSD |
Job placements |
30.3 |
29.7 |
24.4 |
|
13 week outcomes |
12.7 |
13.2 |
14.1 |
|
|
26 week outcomes |
7.1 |
7.3 |
8.1 |
|
|
Non-RSD |
Job placements |
22.8 |
27.9 |
22.7 |
|
13 week outcomes |
10.4 |
12.4 |
11.2 |
|
|
26 week outcomes |
6.1 |
7.7 |
6.9 |
* Data span 1 April to 31 March of the next year.
Source: Administrative data provided by DEEWR.
Detailed JSA data for individual RSD communities, including active caseload, commencements, job placements and outcomes are at Attachment N.4.
[1] Excluding ‘don’t know’ responses.
[2] Excluding ‘don’t know’ responses.
[3] Excluding ‘don’t know’ responses.
[5] Excluding ‘don’t know’ responses.
[10] See Chapter 2, Section 2.5.
[13] Ibid, Performance Measurement Framework, Appendix B.
[17] Qld Department of the Premier and Cabinet, Cape York Justice Study, Brisbane, 2001.
[19] See Chapter 2 Section 2.2 for further information.
[23] COAG Communiqué, 5 April 2002. See further information in Chapter 2.2.
[28] Includes both Australian and state government funding.
[42] No comparison communities were used in the NT for the MES audit.
[44] Remote Service Delivery Baseline Mapping Reports 2010.
[55] See for example, NPA RSD, Paragraphs 16(e), 17(a), 17(d) and C10(c)(iii).
[57] …resulting from the adoption of ‘New Public Management’ approaches since the late 1990s.
[86] CGRIS, 3rd report, pp.4-5. See also CGRIS, 4th report, p.1, CGRIS, 6th report, p.6.
[87] O’Flynn et al, op cit, pp.244-254.
[88] Morgan Disney & Associates, op cit, pp.6-7.
[95] For example, CGRIS, 2nd report, pp.26-27; CGRIS, 6th report, p.54.
[100] Morgan Disney & Associates, op cit, p.6.
[101] CGRIS, 1st report, p.98.
[102] CGRIS, 2nd report, p.36.
[104] See Chapter 3 Interpreting services.
[107] Morgan Disney & Associates, op cit, p.7.
[111] Includes both Australian and state government funding.
[115] Australian and state government funding.
[118] ANAO, Audit Report No.43 2011–12, p.92.
[125] See Chapter 6, Future priorities.
[126] 61% of respondents were aware of their LRG.
[129] CGRIS, 3rd report, pp.90-95.
[132] See Chapter 2 for further information.
[135] Australian Government, Closing the Gap Prime Minister’s Report, 2014, p.9.
[141] CGRIS, 6th report, p.15.
[145] Data are combined for the period 2008–09 to 2010–11, due to low numbers.
[146] Compared with Indigenous national or jurisdictional rates where a community is located.
[148] FaHCSIA, National Partnership on Remote Indigenous Housing Review of Progress 2008–2013, p.24.
[154] CGRIS, 6th report, p.37.
[158] Australian Institute of Criminology unpublished material.
[160] CYWR Evaluation Report, op cit, p.43.
[163] From 48% in 2006 to 46.2% in 2011.
[170] NPA RSD, Paragraph 16(f).
[175] Morgan Disney & Associates, op cit, p.8.
[176] O’Flynn et al, op cit, p.250.
[179] http://www.cgris.gov.au/site/reports.asp.
[181] O’Flynn et al, op cit, p.249.
[182] Northern Territory Coordinator General, op cit, p.42.
[184] Even when not well developed or implemented in some locations.
[192] NPA RSD, Paragraphs 15(c) and 15(e).
[193] CGRIS, 3rd report, p.90.
[194] CGRIS, 6th report, p.54.
[201] See, for example, the Indigenous Governance Awards at Reconciliation Australia.
[202] For example, the Palm Island Community Company.
[204] NPA RSD, Paragraph 15(b).
[208] CYWR Evaluation Report op cit, p.6
[212] Morgan Disney & Associates, Synopsis review of the COAG trials, 2006, p.11.
[215] Morgan Disney & Associates, Synopsis Review of the COAG trials, 2006, p.29.
[216] www.federal financial relations - national agreements.
[217] See Section 2.6.1 for more information on Indigenous specific NPAs.
[219] http://www.formerministers.dss.gov.au/14654/john-curtin-institute-of-public-policy/
[221] Now referred to as Fitzroy Valley.
[223] Population is based on the 2006 Estimated Resident Population.
[224] Refer to Section 2.5 Governance of the RSD for a description of the BOM.
[227] Coordinator General for Remote Indigenous Services Third Six Monthly Report, p.92-93.
[228] In a number of communities pre-existing bodies acted as the LRG.
[232] Bilateral plans for each jurisdiction can be found at Federal Financial Relations.gov.au.
[233] See CGRIS.gov.au/reports
[234] Five Northern Territory Coordinator General for Remote Service reports were published from 2009 to 2012. The last report was for the period of June 2011 to August 2012. www.territorystories.nt.gov.au.
[235] The Groote Eylandt and Bickerton Island RPA (Stage 2) can be found at http://www.atns.net.au/agreement.
[236] The implementation review can be found at www.dss.gov.au/Progress towards a new way of working with remote Indigenous-communities.
[238] See Section 2.2.2 for a list of the building blocks.
[240] www.formerministers.dss.gov.au.
[241] See Chapter 2.3 for the specific objectives of the NPA RSD.
[244] In the four Cape York communities priority was given to existing CYWR priorities.
[245] These 13 workshops are counted as individual projects.
[249] www.coag.gov.au, p.17.
[250] Annual Report to COAG 2010–11, p.17.
[251] See also Table J.7 in Appendix J for the status of tenure reforms by community.
[252] See Chapter 2.3 for the specific objectives of the NPA RSD, and Paragraph 15 of the NPA RSD.
[259] All questions offered ‘yes’ ‘no’ ‘don’t know’ ‘prefer not to say’ as the response categories.
[261] Northern Territory Emergency Response: Evaluation Report 2011, p.3.
[263] Northern Territory Emergency Response: Evaluation Report 2011, p.18.
[267] Northern Territory Emergency Response: Evaluation Report 2011, p.148.
[269] Northern Territory Emergency Response: Evaluation Report 2011, p.152.
[278] Putt 2012, Putt et al 2011
[280] Excluding the ‘don’t know’ responses
[283] See Chapter 2 for further information.
[285] Ibid, Performance Measurement Framework Appendix B.
[286] www.abs.gov.au/AUSSTATS/Census+Data.
[291] National partnership agreement universal access early childhood education.
[292] Australia Government, Closing the Gap Prime Ministers Report 2014, p.9.
[294] Unpublished data from the former Department of Education, Employment and Workplace Relations.
[307] Australian Government, Cape York Welfare Reform Evaluation 2012 Report, Feb. 2013.
[308] Enrolment and average attendance by school are contained in Appendix N in Table N.1.
[310] Based on Term 1 attendance data
[318] Detailed statistical testing is described in Appendix N. pages 2-4
[319] National Assessment Program – Literacy and Numeracy.
[326] A Certificate II qualification is considered to be equivalent to Year 12 attainment.
[333] As shown in Tables 7.14 and 7.15.
[337] The communities were Kowanyama, Lockhart River, Mapoon, Napranum, Pormpuraaw and Wujal Wujal.
[341] Includes the communities of Bardi Jawi (Ardyaloon, Lombadina and Djarindjin) and Beagle Bay.