5. Measuring change
5.1 Measurement approach
Modelling the quantity of young people that will experience change
At the commencement of this project, there had been little quantitative data collected over time to indicate the changes experienced by stakeholders and the quantities of stakeholders experiencing those changes. Section 9.1 of the report provides recommendations on how this approach can be adopted to improve the measurement approach through ongoing and consistent data collection in the future. The recommended approach involves collecting quantitative data that indicates how many participants have experienced outcomes as a result of the program, and the extent of the change they experienced.
The logic of Drum Atweme is that it prevents young people from offending by engaging them early in an alternative activity (drumming) that provides them with positive outcomes (described in Section 4.4). As they grow up, they progress from one stage of development to the next (see Section 4.3). They require the sustained intervention of the program to continue to experience positive outcomes. As no historic data was available to understand the extent of the change experienced by the different young people from when they entered the program to the current day, and as it was not possible to collect this information from the large number of young people (of which many are children or young teenagers), it was necessary to assume that all young people in the program for at least a year experience each outcome each year. Therefore, young people in the performance group experience change based on the number of years they are in the program.
Modelling the quantity of young people in the performance group that will experience change
To quantify and project the change that are forecast to be experienced by the performance group members, information on the past and current performance group members was collected. The information contained the starting year of current members and their current age range, and the current situation of all past members.
As the age range of members is so wide and the number of members so large, it was not possible to model the stage of development that each member started at and reached during their time with the program. Instead, the information available was used to model the age profile of the current performance group, and model the number of members expected to enter the group each year and the number of years members would be expected to stay.
| Assumptions | Number | Rationale |
|---|---|---|
Number of original members (from 2014) |
50 |
Based on the current number of members, rounded down |
Original members (from 2014) that leave each year |
2 |
Based on assumption that most long-term members continue in the group, but some attrition for young people losing interest or leaving Alice Springs temporarily |
New members each year |
5 |
Based on assumption that there will be new members that enter each year (from school group, or siblings of members) |
Of those that join in a year, number that leave during the year |
2 |
Based on assumption that some new members will decide to not continue in the same year they join |
Of those that join in a year, number that stay after a year |
3 |
Based on assumption that some new members will decide to continue |
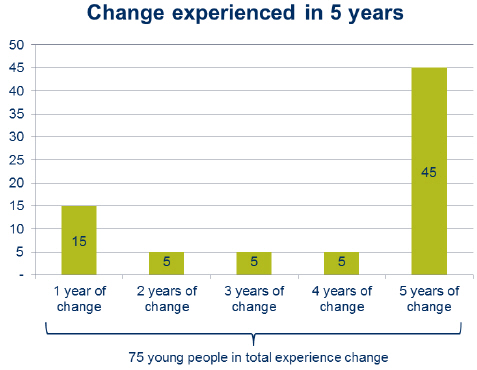
Over the five years, the size of the performance group is expected to stay fairly constant (given that the level of investment is constant). The group is currently around 50 members, with a net gain of one member a year expected. This information was used to predict how many members would be expected to experience years of change. Young people that were members of the performance group for less than one year were not included in the quantity of young people experiencing change for one year, as it was not anticipated they would experience change with limited exposure to the program. The modelling also allows for natural attrition of performance group members who leave each year. This information was also used to model the expected ages of young people who experienced the full five years of change over the five year investment period.
Based on current and past program participation levels, if investment continues at the current level, it is forecast that 75 young people will participate in the program for at least a year or more over FY2015-19, and will therefore experience the material outcomes.
Figure 5.1 - Projected number of young people expected to experience years of change
The ages of the number of young people experiencing five years of change were modelled based on their current age categories.
Figure 5.2 - Projected number of young people expected to experience years of change Modelling the quantity of other stakeholders that will experience change
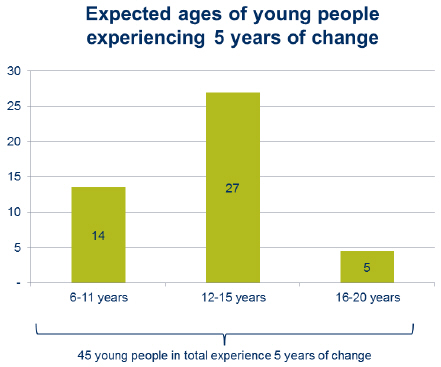
Modelling the quantity of other stakeholders that will experience change
To understand if the changes outlined in Section 4 will occur for other stakeholders, we used information collected through stakeholder consultation and the Drum Atweme Coordinator.
Young people in the school group
The number of young people in the school group was determined by taking the mean of different estimates from stakeholders of the number of students currently taught at the two schools. The mean of these estimates was around 140 students per annum. This is likely to underestimate the total number of students experiencing outcomes, as there is insufficient data to estimate how many students may drop out of, and join, classes during the year.
The number of young people in drumming classes in a year was then multiplied by the duration of the investment period to measure the total number of young people experiencing changes, meaning 700 students are forecast to experience the outcome.
Schools
Both schools that have drumming classes are forecast to experience the outcomes for schools.
Families
Based on the consultations with the Drum Atweme Coordinator and interviews with the family members, it was estimated that there were 35 families that were involved with Drum Atweme through their children being part of the performance group. This includes a number of families that have multiple children in the group. All of these family groups are expected to experience Outcome 4.1 and 4.2.
The number of families that experience Outcome 4.3 is smaller, as this relates to the family members that attend the performance trips each year. It is estimated that the performance group has two trips on average per annum, with 4 community members attending the trips as support. Some of the same family members are expected to attend multiple trips. It is assumed that 16 family members attend over the five year investment period (as some family members will attend trips over multiple years).
Alice Springs community
Based on the consultations with the Drum Atweme Coordinator, it was determined that the performance group does around 12 community performances and 25 tour group and convention performances each year. These form the indicators for how many opportunities the community members and local businesses have to experience the outcomes. The number of performances is expected to stay constant each year. For Outcome 5.3, no indicator was available and therefore it was not possible to measure or value the outcome.
Justice system
The amount of change experienced by the justice system is related to the number of young people that change and how they change. The number of young people that are expected to experience the changes related to the justice system have been estimated based on data collected through the risk profile survey on 30 members of the performance group on contact with police, courts or family services, and on the design of the program which requires young people to be engaged in school (not in detention) to participate. This information was used to estimate the total number of young people expected to avoid anti-social behaviour, offending and detention.
- Outcome 6.1 Decrease in number of young people with anti-social behaviour: Around 30 per cent of the performance group surveyed as part of the risk profile process has had contact with police, courts or family services. It is assumed that the inverse (70 per cent) of this will avoid contact with the police during the program.
- 6.2 Decrease in number of young people offending: Around 30 per cent of the performance group surveyed as part of the risk profile process has had contact with police, courts or family services, it is assumed that a third (33 per cent) of these contacts involved young people offending. This means that 10 per cent of the total group are assumed to offend, and that the inverse (90 per cent) of group will avoid offending during the program.
- 6.3 Decrease in number of young people in detention: As the program is based on members attending school, all members of the performance group aged 12 years or more (100 per cent) must avoid detention while part of the performance group.
To determine the amount of change that is forecast to be experienced by the justice system, the assumptions above were applied to the number of young people that are likely to experience "years of change" in the program.
Outcome 6.1 ("Decrease in number of young people with anti-social behaviour") relates to first point of contact between a young person and the justice system. This contact results from the young person engaging in anti-social behaviour that the police respond to. Outcome 6.2 relates to the second stage in this process, when the young person is deemed to have offended and the justice system responds through investigating the offending behaviour, engaging the young person in a youth restorative process and allocating a youth justice worker to supervise the young person (carried out by police), finalising the matter in court (carried out by the court system) and supervising the young person (carried out by Juvenile Justice NSW). Finally, Outcome 6.3 relates to the point where the young person is in juvenile detention, and is therefore no longer being supervised in the community. Therefore there is no double counting between these outcomes.
Indicators of change
Both objective and subjective outcome indicators were identified during stakeholder consultation. An indicator is credible if it can demonstrate that the outcome will be achieved. A mixture of subjective and objective indicators allows the creation of a more robust measurement. This information was used to develop a tool for Drum Atweme to collect data to prove that the outcomes are happening.
Table 5.2 summarises the indicators used to forecast the outcomes experienced by young people in the performance group for this SROI analysis. All indicators are included in the calculation of the headline SROI ratio.
| Change in stage of development | Indicator Outcome 1.1 Increased self-esteem |
Indicator 1.2 Increased engagement in meaningful activity |
Indicator 1.3 More positive connections to others |
Indicator 1.4 Avoidance of anti-social behaviour |
Quantity |
|---|---|---|---|---|---|
# young people that will experience outcomes in the program for 1 year |
# young people whose self-esteem will increase from extremely low to low during the investment period |
# young people whose engagement in a meaningful activity will increase from not being engaged at all to being engaged to a moderate extent during the investment period |
# young people whose connections increase from extremely weak to average during the investment period |
# young people whose likelihood of detention/incarceration will reduce from a high likelihood to a moderate likelihood during the investment period |
15 |
# young people that will experience outcomes in the program for 2 years |
# young people whose self-esteem will increase from extremely low to average (and are in the program for 2 years) during the investment period |
# young people whose engagement in a meaningful activity will increase from not being engaged at all to being engaged to a large extent (and are in the program for 2 years) during the investment period |
# young people whose connections increase from extremely weak to strong (and are in the program for 2 years) during the investment period |
# young people whose likelihood of detention/incarceration will reduce from a high likelihood to a low likelihood (and are in the program for 2 years) during the investment period |
5 |
# young people that will experience outcomes in the program for 3 years |
# young people whose self-esteem will increase from extremely low to being average (and are in the program for 3 years) during the investment period |
# young people whose engagement in a meaningful activity will increase from not being engaged at all to being engaged to a large extent (and are in the program for 3 years) during the investment period |
# young people whose connections increase from extremely weak to strong (and are in the program for 3 years) during the investment period |
# young people whose likelihood of detention/incarceration will reduce from a high likelihood to a low likelihood (and are in the program for 3 years) during the investment period |
5 |
# young people that will experience outcomes in the program for 4 years |
# young people whose self-esteem will increase from extremely low to being average (and are in the program for 4 years) during the investment period |
# young people whose engagement in a meaningful activity will increase from not being engaged at all to being engaged to a large extent (and are in the program for 4 years) during the investment period |
# young people whose connections increase from extremely weak to strong (and are in the program for 4 years) during the investment period |
# young people whose likelihood of detention/incarceration will reduce from a high likelihood to a low likelihood (and are in the program for 4 years) during the investment period |
5 |
# young people that will experience outcomes in the program for 5 years |
# young people whose self-esteem will increase from extremely low to being average (and are in the program for 5 years) during the investment period |
# young people whose engagement in a meaningful activity will increase from not being engaged at all to being engaged to a large extent (and are in the program for 5 years) during the investment period |
# young people whose connections increase from extremely weak to strong (and are in the program for 5 years) during the investment period |
# young people whose likelihood of detention/incarceration will reduce from a high likelihood to a low likelihood (and are in the program for 5 years) during the investment period |
41 |
# young people that will experience outcomes in the program for 5 years and that are over 16 |
# young people whose self-esteem will increase from extremely low to being average (and are in the program for 5 years) during the investment period (and are aged over 16) |
# young people whose engagement in a meaningful activity will increase from not being engaged at all to being engaged to a large extent (and are in the program for 5 years) during the investment period (and are aged over 16) |
# young people whose connections increase from extremely weak to strong (and are in the program for 5 years) during the investment period (and are aged over 16) |
# young people whose likelihood of detention/incarceration will reduce from a high likelihood to a low likelihood (and are in the program for 5 years) during the investment period (and are aged over 16) |
5 |
Tables 5.3 summarises the indicators used to forecast the outcomes for all other stakeholders for this SROI analysis. All indicators are included in the calculation of the headline SROI ratio.
| Outcomes | Indicator | Quantity |
|---|---|---|
2.1 Increased engagement in meaningful activity |
# young people in drumming classes that increase their engagement in a meaningful activity during the investment period |
700 |
| Outcomes | Indicator | Quantity |
|---|---|---|
3.1 Offer more relevant, engaging curriculum |
# schools offering Drum Atweme to students that are able to offer a more relevant, engaging curriculum |
2 |
| Outcomes | Indicator | Quantity |
|---|---|---|
4.1 Receive material support |
# families with young people in Drum Atweme performance group in investment period that receive material support |
35 |
4.2 More positive perceptions and expectations of their children |
# families with young people in Drum Atweme performance group in investment period that have more positive perceptions and expectations of their children |
35 |
4.3 Pass down knowledge, stories and culture |
# families that provide support for performance group in investment period and therefore pass down knowledge, stories and culture |
16 |
| Outcomes | Indicator | Quantity |
|---|---|---|
5.1 More opportunities to experience Aboriginal culture |
# performances in the community in investment period that provide more opportunities to experience Aboriginal culture |
60 |
5.2 Local businesses earn more income from tourists |
# performances for tour groups and conventions in investment period that allow local businesses to earn more income from tourists |
125 |
5.3 Improved perceptions of Aboriginal young people |
No indicator available |
unknown |
| Outcomes | Indicator | Quantity |
|---|---|---|
6.1 Decrease in number of young people with anti-social behaviour |
# young people that avoid contact with police for 1 year during the investment period |
11 |
6.1 Decrease in number of young people with anti-social behaviour |
# young people that avoid contact with police for 2 years during the investment period |
4 |
6.1 Decrease in number of young people with anti-social behaviour |
# young people that avoid contact with police for 3 years during the investment period |
4 |
6.1 Decrease in number of young people with anti-social behaviour |
# young people that avoid contact with police for 4 years during the investment period |
4 |
6.1 Decrease in number of young people with anti-social behaviour |
# young people that avoid contact with police for 5 years during the investment period |
28 |
6.1 Decrease in number of young people with anti-social behaviour |
# young people that avoid contact with police for 5 years during the investment period (and are aged over 16) |
3 |
6.2 Decrease in number of young people offending |
# young people that avoid offending for 1 year during the investment period |
14 |
6.2 Decrease in number of young people offending |
# young people that avoid offending for 2 years during the investment period |
5 |
6.2 Decrease in number of young people offending |
# young people that avoid offending for 3 years during the investment period |
5 |
6.2 Decrease in number of young people offending |
# young people that avoid offending for 4 years during the investment period |
5 |
6.2 Decrease in number of young people offending |
# young people that avoid offending for 5 years during the investment period |
36 |
6.2 Decrease in number of young people offending |
# young people that avoid offending for 5 years during the investment period (and are aged over 16) |
4 |
6.3 Decrease in number of young people in detention |
# young people that avoid detention for 1 year during the investment period (and are aged 12 and over) |
11 |
6.3 Decrease in number of young people in detention |
# young people that avoid detention for 2 years during the investment period (and are aged 12 and over) |
4 |
6.3 Decrease in number of young people in detention |
# young people that avoid detention for 3 years during the investment period (and are aged 12 and over) |
4 |
6.3 Decrease in number of young people in detention |
# young people that avoid detention for 4 years during the investment period (and are aged 12 and over) |
4 |
6.3 Decrease in number of young people in detention |
# young people that avoid detention for 5 years during the investment period (and are aged 12 and over) |
27 |
6.3 Decrease in number of young people in detention |
# young people that avoid detention for 5 years during the investment period (and are aged over 16) |
5 |
This forecast SROI analysis was used to provide guidance to the Department and the Drum Atweme Coordinator about what outcomes should be measured in the future, and what the indicators of the outcomes experienced by the stakeholder groups should be. A Social Outcomes Measurement and Evaluation Tool has been developed for this purpose. Table 5.1 shows the indicators that will be used as part of the Social Outcomes Measurement and Evaluation Tool. Both subjective and objective indicators are included. This will facilitate more robust evaluation of the program in the future than has been possible in this analysis.