7. Calculating the SROI and testing assumptions
On this page:
7.1 SROI Ratio
Figure 7.1 - SROI ratio
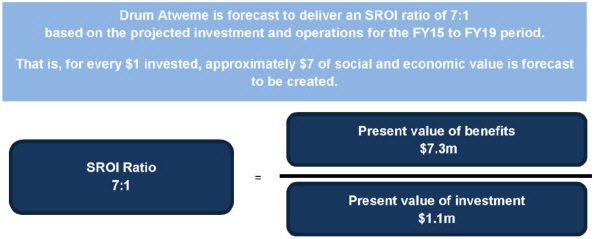
About the SROI Ratio
This analysis has discussed a number of issues that need to be considered when interpreting the SROI ratio. Some of the key issues include:
- The values for the project benefits are estimates and provide an indication of the value that is forecast to be generated through the Drum Atweme program only.
- The SROI ratio represents the additional value created, based on the SROI principles. This is the unique value that is created by the program attributable to the investment for this specific period.
- SROI ratios should not be compared between organisations without having a clear understanding of each organisation's mission, strategy, program or stakeholder logic, geographic location and stage of development. A judgement about investment decisions can only be made when using comparable data.
- No discount rate was used to discount future benefits that are forecast to be realised or the investment that is forecast to be made into the program during FY2015-19. Reason for this is two-fold: application of the discount rate is not material to the analysis as most of the change is expected to occur during the defined investment period; and the outcomes experienced are not linked to the year in which they occur, instead they either occur or not, and when they do occur they are only valued once. One exception is outcomes in for young people over 16 years which are expected to last after the investment period, however, it is only a small share of the total value of the outcomes that are forecast to be created.
7.2 Testing assumptions
It is important that the SROI calculations are tested by understanding how the judgements made throughout the analysis affect the final result.
In this section, SVA Consulting identified the judgements that are most likely to influence the SROI ratio, and consider how sensitive the ratio is to changes in these judgements. To decide which judgements to test, two key questions were considered:
- How much evidence is there to justify our judgement? The less evidence available, the more important it is to test
- How much does it affect the final result? The greater the impact, the more important it is to test.
The assumptions that were tested in the sensitivity analysis for this report are in Table 7.1 below.
| Variable | Baseline judgement | New Assumption | SROI Ratio |
|---|---|---|---|
― |
Baseline |
― |
7:1 |
1. Investment period |
5 year forecast |
2 year forecast |
6:1 |
2. Quantity: Projected number of performers per annum |
50 performers at start of investment period |
25 performers at start of investment period |
4:1 |
3. Financial proxy: Justice system Outcome 6.3 |
$35k - Average resource reallocation to the justice system per young person being detained each year |
Halve the resource reallocation |
5:1 |
3. Financial proxy: Justice system Outcome 6.3 |
$35k - Average resource reallocation to the justice system per young person being detained each year |
Double the resource reallocation |
10:1 |
4. Deadweight: Justice system outcomes and Young people in performance group Outcome 1.4 |
35%. Based on 65% of the young people in the performance group surveyed in the August 2013 risk profile were considered medium or high risk of engaging in offending behaviour. Stakeholder interviews confirmed that young people were likely to exhibit anti-social behaviour without the program. |
86%. The offending rate for indigenous young people aged 15-19 in the Northern Territory is around 14%. The inverse of 86% is the deadweight. Source: ABS, Recorded Crime -Offenders, 2012-13, Table 19; ABS, 2011 Census Community Profiles, Northern Territory, Table 103 Age by Indigenous Status by Sex |
3:1 |
5. Quantity: Justice system Outcome 4.3 |
All young people in the performance group aged 12 years or over avoid detention |
All young people in the performance group aged 16 years or over avoid detention detention |
4:1 |
6. Attribution: Young people and Justice System |
25%. Other organisations and people have some minor role to play in generating the outcome. |
50% - Assume other organisations and people have a greater influence |
5:1 |
7. Duration: Young people and Justice System |
For young people aged 16 and over who experience five years of change, the outcomes experienced would continue for another two years after the end of the program. |
Outcome lasts only while young people are in the program |
6:1 |
8. Stakeholder groups |
Young people in the school group, Schools, Families and Alice Springs Community included as stakeholder groups |
Young people in the school group, Schools, Families and Alice Springs Community not included as stakeholder groups |
7:1 |
As with any financial modelling, it is expected that any changes in the variables would result in changes to the SROI ratio. This sensitivity analysis is a useful indicator of which variable/s have the most significant impact on the ratio. The most sensitive is the fourth variable, the deadweight assumption for the Outcome 1.4 for young people in the performance group and Outcomes 6.1 - 6.3 for the justice system.
In all scenarios tested the SROI ratio remains above 1:1, indicating that social value that is forecast to be created is likely to be greater than the investment that is forecast to be made in the program. It will be important to collect data related to the most sensitive variables to ensure that these assumptions are robust and monitor any departures from the baseline judgements to ensure that the program is creating the expected level of social return on investment.