5. Measuring change
5.1 Measurement approach
Modelling the quantity of young people that will experience change
At the commencement of this project, there had been little quantitative data collected over time to indicate the changes experienced by stakeholders and the quantities of stakeholders experiencing those changes. Section 9.1 of the report provides recommendations on how this approach can be adopted to improve the measurement approach through ongoing and consistent data collection in the future. The recommended approach involves collecting quantitative data that indicates how many participants have experienced outcomes as a result of the program.
For the current analysis we developed an understanding of the changes experienced by stakeholders through stakeholder consultations, which was confirmed and refined through regular conversations with CHAC staff. We identified that young people progress through up to five stages of development as a result of their involvement in the program. Each stage lays the foundation for the next stage of the journey. The five stages of development for the young people are (Figure 5.1):
A. Build trust and meet immediate needs
B. Increase engagement and acceptance of boundaries
C. Increase hope and motivation
D. Exercise own agency
IMPACT. Develop a strong identity*
Figure 5.1: Five stages of development of young people
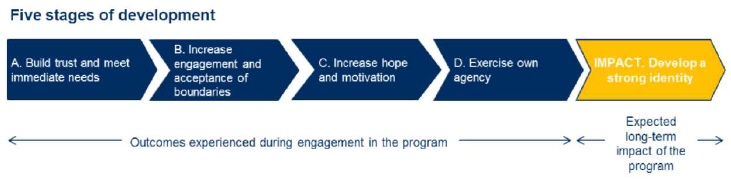
Given the interconnected nature of change experienced by these young people, it is inevitable that the young people continue to experience change from earlier stages when they move on to later stages.
Existing program participants
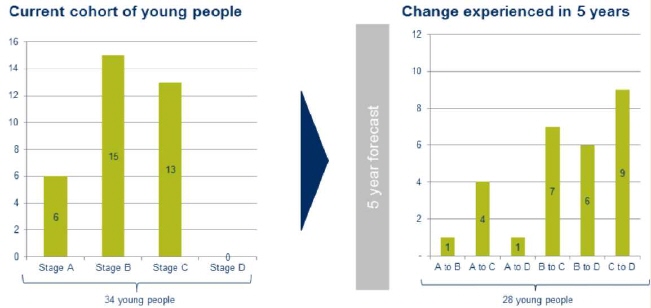
To quantify and project the change that is forecast to be experienced by the program participants, information on the past and current program participants was collected. The information contained the names of the program participants, date when they started the program and date when they discontinued / graduated from the program, if applicable. This information helped to identify the stage of development that the young people reached during the time with the program and if they continue their involvement with the program, where they are likely to be in five years' time.
It is expected that some service users will not make any progress during the forecast period. This assumption was based on conversations with the young people and the program manager. For these young people, it is expected that they will continue to be engaged in the program for some time but will eventually disengage. The impact of the program on young people is neutral, and they are not counted in the analysis as stakeholders who experience change.
Information collected is summarised in the Figure 5.2 below.
Figure 5.2: Projected change in stage of development for the current cohort of young people
Future program participants
Over the forecast period new young people will join the program. Today it is impossible to know exactly what the characteristics of these young people will be and what their experience will be during the program. Therefore, to project the changes experienced by this group of young people, we used the information from the past and the current cohort to estimate the length of time these young people will be in the program, how quickly they move through the stages of development, and how much change they will experience as a result. This information was obtained through extensive discussion with the case manager about each client's experience of the program.
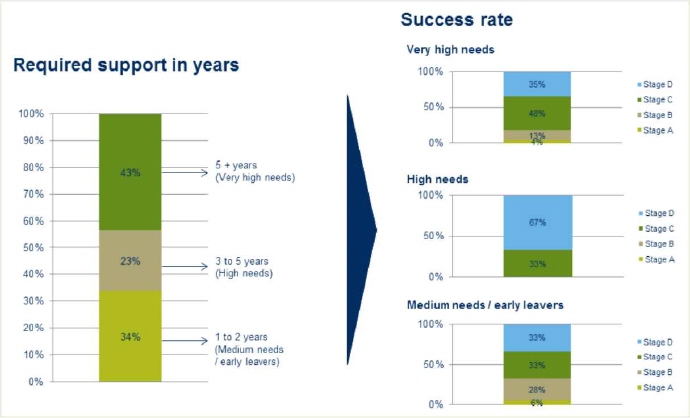
Analysis of the available data revealed that the young people that the program works with fall roughly into three levels of need: medium needs, high needs and very high needs. These levels correspond with the time they spent in the program (i.e. young people with higher needs stay in the program longer than young people with lower needs). The level of need also determines how much change the young people are likely to experience. Figure 5.3 depicts classification and the final stage of development that the young people will reach with the program (defined as program "success rate" in the graph below) based on the experience of the past and the existing cohort of the young people engaged in the program.
Figure 5.3: Classification and the success rate of the past and the current cohort of young people
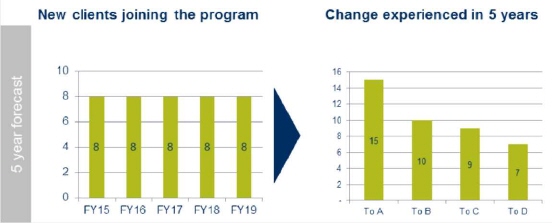
Over the forecast period it was assumed that eight new young people will join the program each year. This is based on four assumptions:
- The previous attrition rate of approximately five young people per annum;
- Many of the existing cohort no longer requires intensive support freeing up the case worker to support more young people intensively;
- The level of need and their success rate (based on the analysis described above);
- Young people that join the program are expected to be at a stage of development prior to stage A.
Figure 5.4 shows the change that is forecast to be experienced by the future intake of young people over the next five years.
Figure 5.4: Projected changes experienced by the new young people who will join the program over the forecast period
At June 2014 there were 34 participants in the program. Based on current and past program participation levels, if investment continues at the current level, it is forecast that 75 young people will participate in the program over FY2015-19.
We modelled where each of the young people in the program would be along the stages of development at the beginning of the investment period (the beginning of FY15) and the end of the investment period (the end of FY19) based on their length of time in the program and our understanding of how the young people progress through the program. We then grouped the young people according to how far they had progressed through the stages, and therefore the changes they had experienced. Each of the young people in the program falls into only one of these groups, which means that no double counting occurs.
The indicators for each outcome have been mapped onto the stages of development (see Table 5.1).Young people's movement through the stages of development has been used to estimate the extent of change they are expected to experience within the forecast period. Indicators were identified for each of the outcomes experienced by the young people to capture both where the program participants will start at the beginning of the investment period and where they are forecast to end up at the end of the investment period (or when they leave the program). For example, a young person that is forecast to move from Stage A to Stage C in the forecast period will be counted as having increased their level of self-esteem from very low to below average. These indicators will be used in the future measurement and evaluation approach for the program (see recommendation in section 9.1).
Modelling the quantity of other stakeholders that will experience change
To understand if the change will occur for other stakeholders we used both the information collected through the stakeholder engagement, as well as the data collected by the organisation as part of their reporting requirements to the Department.
Family and significant others
Based on the consultations with the case worker and interviews with the family members, it was identified that approximately 50 per cent of the families and significant others of young people in the program experience the changes. These changes are likely to happen to the families (and others) where the young person has successfully reached Stages C and D of the development journey.
Community mentors
Based on the consultations with the case worker and interviews with the community mentors, it was identified that all community mentors that directly engage with the young people during the program experience the outcome for this stakeholder group.
It is assumed that the number of the community mentors who are engaged with the young people will increase in line with the growth in the number of the young people in the program.
Justice system
The amount of change forecast to be experienced by the justice system is related to the number of young people that change and how they change. Outcome 4.1 ("Reduction in anti-social behaviour") relates to first point of contact between a young person and the justice system. This contact results from the young person engaging in anti-social behaviour that the police respond to. Outcome 4.2 relates to the second stage in this process, when the young person is deemed to have offended and the justice system responds through investigating the offending behaviour, engaging the young person in a youth restorative process and allocating a youth justice worker to supervise the young person (carried out by police), finalising the matter in court (carried out by the court system) and supervising the young person (carried out by Juvenile Justice NSW). Finally, Outcome 4.3 relates to the point where the young person is in juvenile detention, and is therefore no longer being supervised in the community. Therefore there is no double counting between these outcomes.
In addition, we also capture the direct benefit to the justice system of CHAC staff supporting the young person to avoid detention immediately as they join the program. For example, when the young people join the program they are usually already facing charges for an offence. The case worker supports them in court and in most cases these young people avoid going to detention. Each of these episodes provides a direct benefit to the justice system and therefore is counted separately.
When estimating the likelihood of young people not offending as a result of the program, data collected by the agency and anecdotal evidence from the program staff on the offence rates of their clients has been used to inform our quantity estimates.
Indicators of change
Both objective and subjective outcome indicators were identified during stakeholder consultation. An indicator is credible if it can demonstrate that the outcome will be achieved. A mixture of subjective and objective indicators allows the creation of a more robust measurement. This information was used to develop a tool for CHAC to collect data to prove that the outcomes are happening.
Tables 5.1 and 5.2 summarise the indicators used to forecast the outcomes for this SROI analysis.
| Change in stage of development | Indicator Outcome 1.1 Increased self-esteem |
Indicator 1.2 Increased engagement in meaningful activity |
Indicator 1.3 More positive connections to others |
Indicator 1.4 Reduced likelihood of re-offending |
Quantity 5Y Forecast |
|---|---|---|---|---|---|
# young people that joined the program during the investment period and will reach Stage A |
# young people whose self-esteem will increase from extremely low to very low during the investment period |
# young people whose engagement in a meaningful activity will increase from not being engaged at all to being engaged to a very small extent during the investment period |
# young people whose connections increase from extremely weak to very weak during the investment period |
# young people whose likelihood of detention/incarceration will reduce from an extremely large likelihood to a large likelihood during the investment period |
15 |
# young people that joined the program during the investment period and will reach Stage B |
# young people whose self-esteem will increase from extremely low to low during the investment period |
# of young people whose engagement in a meaningful activity will increase from not being engaged at all to being engaged to a small extent during the investment period |
# young people whose connections increase from extremely weak to weak during the investment period |
# young people whose likelihood of detention/incarceration will reduce from an extremely large likelihood to a moderate likelihood during the investment period |
10 |
# young people that joined the program during the investment period and will reach Stage C |
# young people whose self-esteem will increase from extremely low to below average during the investment period |
# of young people whose engagement in a meaningful activity will increase from not being engaged at all to being engaged to a moderate extent during the investment period |
# young people whose connections increase from extremely weak to fairly weak during the investment period |
# young people whose likelihood of detention/incarceration will reduce from an extremely large likelihood to a small likelihood during the investment period |
9 |
# young people that joined the program during the investment period and will reach Stage D |
# young people whose self-esteem will increase from extremely low to average during the investment period |
# of young people whose engagement in a meaningful activity will increase from not being engaged at all to being engaged to a large extent during the investment period |
# young people whose connections increase from extremely weak to average during the investment period |
# young people whose likelihood of detention/incarceration will reduce from an extremely large likelihood to a very small 1 likelihood during the investment period |
7 |
# young people that will move from Stage A to Stage B during the investment period |
# young people whose self-esteem will increase from very low to low during the investment period |
# of young people whose engagement in a meaningful activity will increase from being engaged to a very small extent to being engaged to a small extent during the investment period |
# young people whose connections will increase from very weak to weak during the investment period |
# young people whose likelihood of detention/incarceration will reduce from a large likelihood to a moderate likelihood during the investment period |
1 |
# young people that will move from Stage A to Stage C during the investment period |
# young people whose self-esteem will increase from very low to below average during the investment period |
# of young people whose engagement in a meaningful activity will increase from being engaged to a very small extent to being engaged to a moderate extent during the investment period |
# young people whose connections will increase from very weak to fairly weak during the investment period |
# young people whose likelihood of detention/incarceration will reduce from a large likelihood to a small likelihood during the investment period |
4 |
# young people that will move from Stage A to Stage D during the investment period |
# young people whose self-esteem will increase very low to average during the investment period |
# of young people whose engagement in a meaningful activity will increase from being engaged to a very small extent to being engaged to a large extent during the investment period |
# young people whose connections will increase from very weak to average during the investment period |
# young people whose likelihood of detention/incarceration will reduce from a large likelihood to a very small likelihood during the investment period |
1 |
# young people that will move from Stage B to Stage C during the investment period |
# young people whose self-esteem will increase from low to below average during the investment period |
# of young people whose engagement in a meaningful activity will increase from being engaged to a small extent to being engaged to a moderate extent during the investment period |
# young people whose connections will increase from weak to fairly weak during the investment period |
# young people whose likelihood of detention/incarceration will reduce from a moderate likelihood to a small likelihood during the investment period |
7 |
# young people that will move from Stage B to Stage D during the investment period |
# young people whose self-esteem will increase from low to average during the investment period |
# of young people whose engagement in a meaningful activity will increase from being engaged to a small extent to being engaged to a large extent during the investment period |
# young people whose connections will increase from weak to average during the investment period |
# young people whose likelihood of detention/incarceration will reduce from a moderate likelihood to a very small likelihood during the investment period |
6 |
# young people that will move from Stage C to Stage D during the investment period |
# young people whose self-esteem will increase from below average to average during the investment period |
# of young people whose engagement in a meaningful activity will increase from being engaged to a moderate extent to being engaged to a large extent during the investment period |
# young people whose connections will increase from fairly weak to average during the investment period |
# young people whose likelihood of detention/incarceration will reduce from a small likelihood to a very small likelihood during the investment period |
9 |
| Outcomes | Indicator | Quantity 5Y Forecast |
|---|---|---|
2.1 Improve communication between family members |
# of families and significant others which program managers report as having improved communication |
22 |
2.2 Increase engagement in lives of the young people in their care |
# of families and significant others where program managers report as having increase engagement in lives of young people in their care |
22 |
| Outcomes | Indicator | Quantity 5Y Forecast |
|---|---|---|
3.1 Increased sense of pride from contribution to community |
# of community Elders and other members of the community that directly engage with the young people and who report improved perception of them |
43 |
| Outcomes | Indicator | Quantity 5Y Forecast |
|---|---|---|
4.1 Reduction in anti-social behaviour |
# young people that will reduce the frequency of anti-social behaviours they engage in |
25 |
4.1 Reduction in anti-social behaviour |
# young people that will exit the program who are not engaging in anti-social behaviours after the program |
22 |
4.2 Decreased number of young people offending |
# of young people not offending during the program |
14 |
4.2 Decreased number of young people offending |
# of young people not offending after the program |
18 |
4.3 Decreased number of young people in detention |
# of young people avoiding detention immediately after joining program |
37 |
4.3 Decreased number of young people in detention |
# of young people not in detention during the program |
13 |
4.3 Decreased number of young people in detention |
# of young people not in detention after the program |
16 |
This forecast SROI analysis was used to provide guidance to the Department and CHAC program staff about what outcomes should be measured in the future, and what the indicators of the outcomes experienced by the stakeholder groups should be. A Social Outcomes Measurement and Evaluation Tool has been developed for this purpose. Table 5.1 and 5.2 show the indicators that will be used as part of the Social Outcomes Measurement and Evaluation Tool. Both subjective and objective indicators are included. This will facilitate more robust evaluation of the program in the future than has been possible in this analysis.