6. Valuing change
On this page:
6.1 Financial proxies
Financial proxies are used to value an outcome where there is no market value. The use of proxies in this SROI forms a critical component of the valuation exercise as most of the outcomes identified have no market values. There are a number of techniques used to identify financial proxies and value outcomes. Importantly, within an SROI, the financial proxy reflects the value that the stakeholder experiencing the change places on the outcome. This could be obtained directly through stakeholder consultation, or indirectly through research. Techniques for valuing outcomes are included in Appendix 4.
Financial proxies in this SROI analysis have been identified using the revealed preferences technique for the young people, and families and significant others stakeholder groups. The resource reallocation technique was used to develop financial proxies for the justice system. Where relevant, for consistency the same financial proxy values have been used across the different IJP programs analysed in the project.
The financial proxies approximate the value of the outcome from the stakeholder's point of view.
The main challenge faced when determining the most appropriate proxy for the outcomes experienced by the young people was being able to capture the full value of the outcome they will achieve when they experience the full benefit of the outcomes from the program. During the consultation stage we were only able to engage with the young people that were only at the beginning of their journey with the program and therefore only starting to experience changes. We therefore had to rely on the anecdotal evidence provided by the case worker about how the young people would potentially value the material outcomes.
For the outcomes experienced by the justice system, the financial proxies cover the unique costs associated with young people avoiding involvement with each stage of the justice system. For example, the financial proxy value for outcome 4.3 Decrease in number of young people in detention includes the costs of detention but not those costs associated with young people's journey to detention, such as police costs and court costs, as these are allocated to the other justice system outcomes.
It was also not feasible to test the financial proxies directly with the stakeholders, in part due to a limited cognitive ability of clients and difficulty in accessing family / significant others\. However, the proxies were sense tested with the Department of the Prime Minister and Cabinet, as well as the CHAC case worker to make sure they are relevant and are not over or under-valuing the change that is created as a result of the program. Other financial proxies considered include group personal development workshops for Outcome 1.1 Increased self-esteem. This financial proxy was replaced with individual counselling sessions as young people in the Smithton community have more ready access to, and are more likely to participate in, individual counselling sessions than group workshops to increase their self-esteem.
For the other stakeholders, a different financial proxy was identified for each of the material outcomes they experience.
In future SROI analyses it will be critical for stakeholders to be more fully involved in the development and testing of financial proxies. Investigation of the cost savings and resource reallocation that result from young people's participation in the program will provide a more sound basis on which to assess the impact of the program in the future. In particular, these could relate to the value of young people's participation in the workforce as a result of the program. The proposed approach to future measurement and evaluation of the program is discussed in Section 9.1.
Table 6.1 shows the full value of the proxies for each of the outcomes, description and the rationale for selecting the proxy.
| Outcomes | Financial proxy description | Full proxy value | Rationale |
|---|---|---|---|
1.1 Increased self-esteem |
Cost of counselling sessions required to achieve the same outcome (assumes need 367 sessions to achieve a full outcome) |
$27,660 |
The work case worker conducts with the young people is of similar impact as counselling sessions. Some case workers are trained counsellors. |
1.2 Increased engagement in meaningful activity |
Independence test for Youth Allowance |
$26,201 |
Young people qualify for the independence test once they have participated in full-time paid employment for at least 18 months within any two year period. This approximates the market value of engagement in a meaningful activity. |
1.3. More positive connections to others |
Cost of running an afterschool activity centre |
$12,840 |
Through a group activity the young people access a support network. |
1.4 Reduced likelihood of detention or incarceration in the future |
Difference between annual Newstart allowance and minimum wage |
$19,081 |
Being in detention or jail has a negative impact on employment prospects, increasing the likelihood that the young person will be receiving income support (Newstart allowance) rather than being employed (receiving minimum wage). The difference between the minimum wage and the Newstart allowance amount approximates the value of avoiding unlawful behaviour. |
| Outcomes | Financial proxy description | Full proxy value | Rationale |
|---|---|---|---|
2.1 Improve communication between family members |
Cost of family group therapy for one year (10 sessions) |
$7,388 |
Replacement valuation: Cost of treatment addressing family communication issues. |
2.2 Increase engagement in lives of the young people in their care |
Average weekly expenditure on recreation by the lowest gross household income quintile in Tasmania |
$3,014 |
A family's weekly recreational spend is indicative of the cost of families doing activities together, which involves parents engaging with the lives of their children. |
| Outcomes | Financial proxy description | Full proxy value | Rationale |
|---|---|---|---|
3.1 Increased sense of pride from contribution to community |
Cost of volunteer time contributed by a community mentors to the program, reduced by a percentage to reflect the assumption that the community mentors who engage with the young people in the program started with some positive perception of the young people |
$8,512 |
The community mentors who volunteer their time for the young people in the program improve their perception of the young people as a result of interacting with them. |
| Outcomes | Financial proxy description | Full proxy value | Rationale |
|---|---|---|---|
4.1 Reduction in anti-social behaviour |
Additional cost of policing to monitor anti-social behaviours of young people in the community |
$3,324 |
Time reallocated towards other activities, as a result of decreased need in the community to patrol at night and maintain safety. |
4.2 Decreased number of young people offending |
Average costs to the justice system per young person offending (excluding costs associated with policing anti-social behaviour) |
$5,180 |
Aggregate of police costs, court costs and juvenile justice costs which are all costs incurred when a young person offends. |
4.3 Decreased number of young people in detention |
Difference between average detention cost and average cost of community based supervision |
$33,096 |
Resource reallocation: Government can reallocate funding for juvenile justice as a result of participants in the program being supported by the case worker |
4.3 Decreased number of young people in detention |
Average cost of juvenile justice stay |
$35,028 |
Resource reallocation: Government can reallocate funding for juvenile justice as a result of participants in the program avoiding contact with juvenile justice |
The significance of the change depends on the number of stages that the young person moves through during the investment period. Most of the young people will only experience some stages of development, and therefore some part of the outcome, during the investment period. This is because some clients started the program before the investment period, and others will not progress through all stages during the investment period.
Therefore, a proportion of the value of each financial proxy has been applied that corresponds to the specific change that different young people experience during the investment period. It was assumed that each stage of development is equally valuable to the young people, i.e. each stage of development is equal to the 25 per cent of the total value of the outcome (and therefore the financial proxy value). The number of stages each young person is able to experience during the investment period determines the value he or she derives from the program. Table 6.2 shows the proportion of value that is assigned to the change based on the indicator used to measure that change.
| Change in stage of development | Extent of change | % of value |
|---|---|---|
# young people that joined the program during the investment period and will reach Stage A |
One stage |
25% |
# young people that joined the program during the investment period and will reach Stage B |
Two stages |
50% |
# young people that joined the program during the investment period and will reach Stage C |
Three stages |
75% |
# young people that joined the program during the investment period and will reach Stage D |
Four stages |
100% |
# young people that will move from Stage A to Stage B during the investment period |
One stage |
25% |
# young people that will move from Stage A to Stage C during the investment period |
Two stages |
50% |
# young people that will move from Stage A to Stage D during the investment period |
Three stages |
75% |
# young people that will move from Stage B to Stage C during the investment period |
One stage |
25% |
# young people that will move from Stage B to Stage D during the investment period |
Two stages |
50% |
# young people that will move from Stage C to Stage D during the investment period |
One stage |
25% |
For a detailed description of the valuation of each of the outcomes including the calculations and the source of the financial proxy, please refer to Appendix 7.
6.2 SROI Filters
To present an accurate view of the value created through the Youth Prevention and Diversion program, valuation filters (SROI filters) are applied to the financial proxies. This is in accordance with the SROI principle of not over-claiming. The SROI filters adopted for this project are discussed in Appendix 5 and Appendix 6.
Different techniques were used to identify the most appropriate filter for each of the outcomes.
Deadweight
To estimate how much of the change will happen anyway (i.e. without the intervention of the program), where possible comparable population data was used. In other cases, stakeholders were asked to estimate the degree to which they believe the change will occur anyway. The deadweight differs across different stakeholders and for different outcomes for stakeholders.
Attribution
Estimates of how much of the change will be as a result of other stakeholders or activities which are not included in the investment were determined through stakeholder engagement. The attribution assumption for young people is the same across all four outcomes as the input from other stakeholders did not contribute towards one specific outcome, instead their input contributed to all of the outcomes.
However, attribution of these other stakeholders differs for different stages of development the young person is on. At early stages of the development, project activities are core to the changes experienced by the young people. At later stages attribution increases as young people become more connected into other support networks.
Displacement
Stakeholder engagement was used to identify if any of the outcomes will displace other activities. No activities were identified which will be displaced as a result of the activities of the program.
Duration and Drop-off
Duration refers to how long an outcome lasts for. Through stakeholder consultation, it was projected that outcomes experienced during the Stages A, B and C would only last for the duration of the program, however, outcomes experienced during Stage D of development would continue for another 2 years after.
Drop-off recognises that outcomes may continue to last for many years but in the future may be less, or if the same, will be influenced by other factors. Through stakeholder consultation, it was determined that the influence of the program would diminish at a rate of 50% per annum after the program.
The specific SROI filters applied to each outcome in this analysis are included in Appendix 6.
The application of the SROI filters calculates an adjusted annual value for each financial proxy identified for the analysis. This adjusted value represents the value of the outcome that can be solely attributed to the investment described in this analysis.
A worked example of the adjusted value for the 2.1 Improve communication between family members, a change experienced by family and significant others, is included in Figure 6.1 below.
Figure 6.1 - Worked example for adjusted value of the outcome
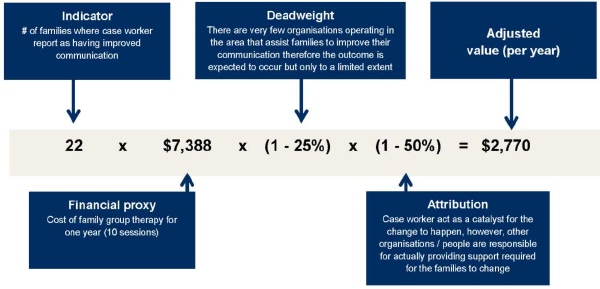
Please note that this outcome lasts for two years after interacting with the program. Also the drop-off per cent has not been applied, so the Adjusted Value reflects the value created in one year.
6.3 Value of outcomes
The total adjusted value is the value calculated for each outcome, which takes into account the following components:
- Financial proxy: value of the outcome
- SROI filters: accounting for whether the outcome would have happened anyway (deadweight), who else will contribute to the change (attribution), whether the outcome will displace other activities or outcomes (displacement) and the how long the outcome will last for (duration and drop off)
- Quantity: the number of stakeholders that will experience an outcome
The total adjusted value for outcomes sums the value created for each group of stakeholders experiencing change and also incorporates duration and drop-off. The following table is a summary of the total adjusted for all of the outcomes experienced by each stakeholder group.
| Outcomes | Total value for outcome |
|---|---|
1. Young people |
― |
1.1 Increased self-esteem |
$665,251 |
1.2 Increased engagement in meaningful activity |
$613,356 |
1.3. More positive connections to others |
$308,809 |
1.4 Reduced likelihood of detention or incarceration in the future |
$520,108 |
2. Family and significant others |
― |
2.1 Improve communication between family members |
$106,657 |
2.2 Increase engagement in lives of the young people in their care |
$43,521 |
3. Community mentors |
― |
3.1 Increased sense of pride from contribution to community |
$354,595 |
4. Justice system |
― |
4.1 Reduction in anti-social behaviour |
$116,705 |
4.2 Decreased number of young people offending |
$115,581 |
4.3 Decreased number of young people in detention |
$1,915,668 |
All of the outcomes identified as material (relevant) to the stakeholders are also material (significant) based on the total value they create for each of the stakeholder groups and their comparison to other stakeholder groups. Therefore, no outcomes were excluded after completion of the valuation stage of the analysis.
For a detailed description of the valuation of each of the outcomes, please refer to the impact map.