7. Calculating the SROI and testing assumptions
On this page:
7.1 SROI Ratio
Figure 7.1 - SROI ratio
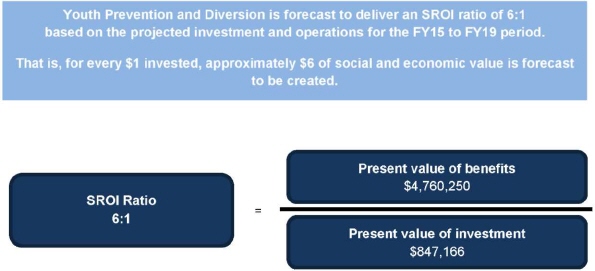
About the SROI Ratio
This analysis has discussed a number of issues that need to be considered when interpreting the SROI ratio. Some of the key issues include:
- The values for the project benefits are estimates and provide an indication of the value that is forecast to be generated through the Youth Prevention and Diversion program only.
- The SROI ratio represents the additional value created, based on the SROI principles. This is the unique value that is created by the program attributable to the investment for this specific period
- SROI ratios should not be compared between organisations without having a clear understanding of each organisation's mission, strategy, program or stakeholder logic, geographic location and stage of development. A judgement about investment decisions can only be made when using comparable data.
- No discount rate was used to discount future benefits that are forecast to be realised or the investment that is forecast to be made into the program during FY15 to FY19. The reason for this is two-fold: application of the discount rate is not material to the analysis as most of the change is expected to occur during the defined investment period; and the outcomes experienced are not linked to the year in which they occur, instead they either occur or not and when they do occur they are only valued once. One exception is outcomes in the Stage D which are expected to last after the investment period; however, it is only a small share of the total value of the outcomes that are forecast to be created.
7.2 Testing assumptions
It is important that the SROI calculations are tested by understanding how the judgements made throughout the analysis affect the final result.
In this section, SVA Consulting identified the judgements that are most likely to influence the SROI ratio, and consider how sensitive the ratio is to changes in these judgements. To decide which judgements to test, two key questions were considered:
- How much evidence is there to justify our judgement? The less evidence available, the more important it is to test
- How much does it affect the final result? The greater the impact, the more important it is to test. The assumptions that were tested in the sensitivity analysis for this report are in Table 7.1 below.
| Variable | Baseline judgement | New Assumption | SROI Ratio |
|---|---|---|---|
― |
Baseline |
― |
6:1 |
1. Investment period |
5 year forecast |
2 year forecast |
6:1 |
2. Quantity: Projected case load |
8 new young people per annum |
4 new young people p.a. |
4:1 |
2. Quantity: Projected case load |
8 new young people per annum |
16 new young people p.a. |
9:1 |
3. Quantity: Mix of young people in the new intake by level of need |
Mix based on historic participation and success and case workers view on success of the current cohort. Mix of the young people based on support needs assumed to be: Medium need: 34% High need: 23% Very high needs: 43% |
Assume mix of new young people is skewed towards medium and high need: Medium need: 60% High need: 30% Very high needs: 10% |
6:1 |
4. Financial proxy: Value of detention outcomes for the justice system |
Saving between $33k and $35k per young person who are unlikely to end up in detention |
Halve the financial proxy value ($17k to $18k per young person) |
5:1 |
4. Financial proxy: Value of detention outcomes for the justice system |
Saving between $33k and $35k per young person who are unlikely to end up in detention |
Double the financial proxy value ($66k and $70k per young person) |
8:1 |
5. Financial proxy: Outcome 1.1 |
Financial proxy calculated using Medicare schedule fee for consultation with a counsellor at $98 per session |
Apply higher rate of $228 per session based on a rate recommended for the practitioners by Australian Psychological Society |
7:1 |
6. Attribution |
Attribution for young people outcomes matched to stage of development: Stage A = 0% Stage B = 25% Stage C = 25% Stage D = 50% Attribution for the justice system outcomes is in line with the assumptions for the young people (i.e. indicators of change are linked to the stages of young people's development) |
Assume equal attribution of 50% for young people outcomes across all stages of development 50% attribution for the justice outcomes |
4:1 |
7. Duration |
When young people reach Stage D, outcomes last for 2 years beyond the investment period In all previous stages of development, outcomes last only for the duration of the investment period |
Assume all outcomes last for the duration of the investment period |
5:1 |
8. Multiple variables |
Mix based on historic participation and success and case workers expectation of likelihood of the current cohort progressing through the stages of development. Mix of the young people based on support needs assumed to be:
|
Assume: 1) mix of new young people is skewed towards med need:
2) equal attribution of 50% across all stages of development 3) all outcomes last for the duration of the investment period |
3:1 |
As with any financial modelling, it is expected that any changes in the variables would result in changes to the SROI ratio. This sensitivity analysis is a useful indicator of which variable/s have the most significant impact on the ratio.
In all scenarios tested the SROI ratio remains above 1:1, indicating that social value that is forecast to be created is likely to be greater than the investment that is forecast to be made in the program. The scenarios that produce the SROI ratios furthest from the baseline of 6:1 are those considered to be less likely to occur than the scenarios that produce ratios the same as or closest to the baseline.
It will be important to collect data related to the most sensitive variables to ensure that these assumptions are robust and monitor any departures from the baseline judgements to ensure that the program is creating the expected level of social return on investment.