


“There is no place in any education jurisdiction for educators with stifled perceptions of who Indigenous students are, or what they can achieve.” - Dr Chris Sarra
Literacy for Life in Brewarrina
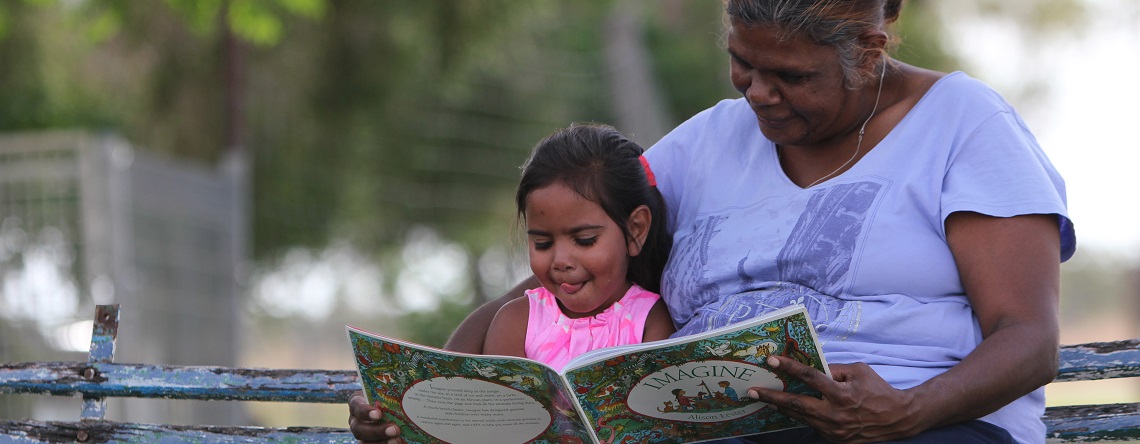
"I want to step up and have confidence and be empowered. With these new skills I can." - Neranellis Coffey, Literacy for Life participant.
Find out more on the Literacy for Life local solution
There is no doubt that a good education unlocks opportunities later in life. Children ready to learn when they first walk through the school gates are more likely to thrive throughout their school years. Education is fundamental to unlocking the potential of future generations – whether through higher education, employment or starting a business.
National policy to drive improvement in education outcomes
While the responsibility for schooling sits with state and territory governments, the Australian Government has an overarching role in national education policy and programs. We work with key stakeholders, supporting early intervention and engaging with parents to encourage school attendance; promoting evidence based school teaching methods; supporting high quality teachers and leaders in school; and increasing education completion rates, in high school and beyond.
Well trained, skilled and knowledgeable teachers provide the foundation for a high quality education system and quality teaching is essential to lifting student outcomes.
The National Aboriginal and Torres Strait Islander Education Strategy and the Framework for Aboriginal Languages and Torres Islander Languages commit and support all governments to ensure teachers, schools and communities build a culturally inclusive school environment for Aboriginal and Torres Strait Islander students.
Across the education continuum, young people are also supported to complete secondary school. Year 12 attainment or the equivalent provides a pathway into further education and employment, opening up economic and social opportunities.
target
Close the gap between Indigenous and non-Indigenous
school attendance within five years (by 2018).
- Recognising the critical importance of school attendance, both government and non-government education authorities will continue to work with communities and families to encourage and support children going to school regularly.
- In 2016, the overall attendance rate for Indigenous students nationally was 83.4 per cent, compared with 93.1 per cent for non-Indigenous students.
- There has been no meaningful change in the national Indigenous school attendance rate from 2014 (83.5 per cent) to 2016 (83.4 per cent). Progress will need to accelerate across most jurisdictions for this target to be met.
- School attendance for Indigenous students decreases with remoteness. In 2016, Indigenous attendance rates ranged from 86.9 per cent in inner regional areas to 66.4 per cent in very remote areas.
- Schools selected for the Remote School Attendance Strategy (RSAS) generally had a history of low and declining attendance rates over a number of years. RSAS is addressing these declining rates of school attendance and the majority of RSAS schools had a higher attendance rate in Semester 1 2016 compared to Semester 1 2013.
National analysis
In Semester 1 2016, the attendance rate for Indigenous students was 83.4 per cent, almost 10 percentage points lower than the comparable rate for non-Indigenous students (93.1 per cent). While this is a sizeable gap, the data tell us that on a given school day the majority of Aboriginal and Torres Strait Islander students are attending school. There has been negligible change in the rate of school attendance for Aboriginal and Torres Strait Islander children from 2014 (83.5 per cent) to 2016 (83.4 per cent).
State and Territory Progress
There was also little change in the rate of attendance for Aboriginal and Torres Strait Islander students from 2014 to 2016 by state and territory (see Figure). All of the changes were less than one percentage point, apart from the Northern Territory (1.6 percentage point fall). No jurisdictions were on track for this target in 2016.1
Figure 6: Indigenous student attendance rates (per cent) Year 1 to 10 combined, by state/territory, Semester 1, 2014 and 2016
.png)
View the text alternative for Figure 6.
More information is available in the full Closing the Gap Prime Minister's Report 2017.
Local solutions
Community drives school attendance in Fregon, SA
In Fregon, a remote community in the Anangu Pitjantjatjara Yankunytjatjara (APY) Lands of South Australia, positive school habits are being formed early, and families are now getting involved in their children’s education.
Find out more on the Fregon school attendance local solution
target
Halve the gap for Indigenous children in reading,
writing and numeracy within a decade (by 2018).
Literacy and numeracy skills are vital for students to succeed at school and move into employment.
- Across the eight areas (reading and numeracy for Years 3, 5, 7 and 9), the proportion of Indigenous students achieving national minimum standards in NAPLAN2 is on track in only one area (Year 9 numeracy).
- NAPLAN results for Indigenous students are worse in more remote areas.
- Indigenous 15 year-olds are on average about two-and-a-third years behind non-Indigenous 15 year-olds in reading literacy and mathematical literacy and Indigenous boys are trailing their female peers in performance at school.
- Although the literacy and numeracy gap remains, the numbers required to halve the gap are within reach: in 2016, if an additional 440 Indigenous Year 3 children throughout Australia had achieved national minimum standards in reading, that target would have been met.
National analysis
Progress against this target is assessed using data on the proportion of students at or above the National Minimum Standards (NMS) as measured through NAPLAN. Progress is tracked each year for eight areas – reading and numeracy for Years 3, 5, 7 and 9 against agreed trajectory points.3 4
In 2016, the result in only one of the eight areas (Year 9 numeracy) was consistent with the required trajectory point at the national level. In the other seven areas, 2016 results were below the required trajectory points, meaning that progress will need to accelerate for this target to be met. This year’s results are less positive than the results for 2015, where four of the eight areas were on track. However, caution is required in interpreting these results, as they vary a lot from one year to the next.
Another way to assess progress is to see whether the latest results for Aboriginal and Torres Strait Islander students have improved. This year at the national level, half of the eight areas showed statistically significant improvements in the proportion of Aboriginal and Torres Strait Islander students at or above the NMS in reading and numeracy results from 2008 to 2016. The four areas with significant improvement were Years 3 and 5 reading, and Years 5 and 9 numeracy. There was no significant change from 2008 to 2016 for Years 7 and 9 reading and Years 3 and Year 7 numeracy.
Although the literacy and numeracy gap remains, the good news is that in terms of actual student numbers the gap is not large. If an additional 440 Indigenous Year 3 students achieved NMS in reading and 800 in numeracy, the target would have been met for Year 3 in 2016.5
State and Territory Progress
Results also vary by state and territory. The Northern Territory had the lowest proportion of Indigenous students at or above the NMS for each area measured. This result partly reflects the pattern by remoteness area, as the Northern Territory has a much higher proportion of Indigenous students in remote or very remote areas than any other jurisdiction.
Queensland has shown the largest improvements, with significant Indigenous improvement in six of the eight measures from 2008 to 2016 (the two exceptions are Year 9 reading and Year 7 numeracy).
Overall there has been significant improvement in Indigenous results for 14 of the 64 state-level measures (numeracy and reading across four year levels in eight jurisdictions.6
Please note, the following correction has been made following the release of the report: The above sentence (found on page 39 of the full report) incorrectly stated 15 of the 64 state-level measures had significant improvement in numeracy and reading. The correct number of significant improvements is 14.
Across the eight jurisdictions and the eight result areas, 29 of the 64 measures were on track (i.e. consistent with or above, the required trajectory points) in 2016 (see Table). The Northern Territory was not on track for all eight areas, while the Australian Capital Territory was on track for all eight.7
View the text alternative for Table 1.
More information is available in the full Closing the Gap Prime Minister's Report 2017.
Local solutions
Cathy Freeman Foundation, Horizons project

“The Horizons Camp has helped with my dreams, culture, being brave, having a good education and being proud of myself.” - Horizons participant
Find out more on the Horizons local solution.
target
Halve the gap for Indigenous Australians aged 20-24
in Year 12 attainment or equivalent attainment rates (by 2020)
Having literacy and numeracy skills opens doors in life and is an essential precursor to success in school, university and employment. Indigenous and non-Indigenous children with the same level of academic achievement at the age of 15 go on to complete Year 12 and higher education at the same rates.
- The target to halve the gap in Year 12 attainment by 2020 is on track.
- Nationally the proportion of Indigenous 20-24 year-olds who had achieved Year 12 or equivalent increased from 45.4 per cent in 2008 to 61.5 per cent in 2014-15. Over the same period, the rates for non-Indigenous attainment did not change significantly.
- The greatest increases occurred in Outer Regional areas (43.2 per cent to 66.3 per cent) and Very Remote areas (24.1 per cent to 41.7 per cent).
National analysis
The main data source used to assess progress against this target is the ABS Census. New data will be available from the 2016 Census in October 2017. Data from the 2011 Census showed that this target is on track, with 53.9 per cent of Indigenous Australians aged between 20 and 24 having attained a Year 12 or equivalent qualification, up from 47.4 per cent in 2006.
While not directly comparable with Census data, the ABS National Aboriginal and Torres Strait Islander Social Survey (NATSISS) provides a secondary source of data for this target. New data for 2014-15 was released in April 2016. According to the NATSISS, between 2008 and 2014-15 rates of Year 12 or equivalent attainment for Indigenous 20 to 24 year olds increased from 45.4 per cent to 61.5 per cent, while rates for non-Indigenous Australians1 of the same age did not change significantly (from 85.0 per cent to 86.4 per cent). This has resulted in the gap in Year 12 or equivalent attainment rates narrowing by 14.7 percentage points (from 39.6 percentage points to 24.9 percentage points) over this period.
State and Territory progress
All states and territories have had increases in Indigenous Year 12 or equivalent attainment. The Census data show that between 2006 and 2011 Indigenous results for Western Australia, South Australia, the Australian Capital Territory and the Northern Territory were on track for this target. The more recent survey data also show statistically significant increases for Indigenous Year 12 attainment in the Australian Capital Territory, South Australia, New South Wales and Tasmania between 2008 and 2014-15 (see Figure).2
Figure 12: Proportion of Indigenous 20-24 year olds with Year 12 or equivalent attainment, by state/territory, 2008 and 2014-15
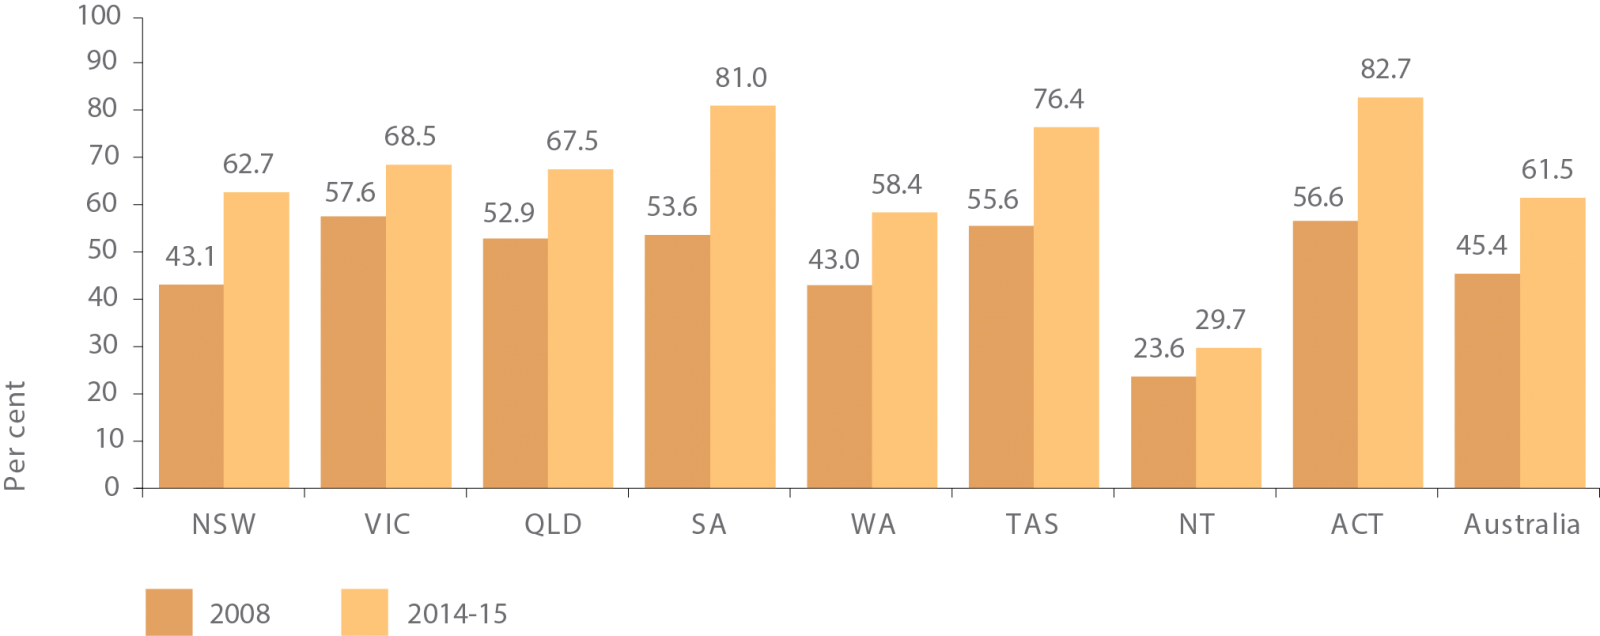
View the text alternative for Figure 12.
More information is available in the full Closing the Gap Prime Minister's Report 2017.
Local solutions
Developing tomorrow's Indigenous marine leaders
“I think this program is important to Aboriginal and Torres Strait Islanders as we can bring two different knowledges and sciences together to accomplish more, and to make sure that we are doing everything we can to protect the ocean,” - Mary Dingley-Paiwan from Pimlico State High School.
Find out more on the Indigenous marine leaders local solution
Higher education
National analysis
We know Indigenous university graduates find work more quickly than their non-Indigenous counterparts and have, on average, higher commencing salaries. Indigenous graduates have very high levels of employment. In 2016 over 74 per cent of Aboriginal and Torres Strait Islander graduates were in full-time employment compared with 70.9 per cent of non-Indigenous graduates (Quality Indicators for Learning and Teaching, 2016).
From 2005 to 2015 there was a 93 per cent increase (from 8,330 in 2005 to 16,062 in 2015) in the number of Aboriginal and Torres Strait Islander students in higher education award courses compared with 47 per cent growth for all domestic students.
Indigenous enrolments in an award course continue to grow more quickly than enrolment rates for all domestic award course students: in 2015 Indigenous students represented 1.5 per cent of domestic students in higher education, up from 1.4 per cent in 2013 and 1.2 per cent in 2005. Females make up 66 per cent of the Indigenous cohort (compared with 56 per cent of all female higher education award course students) (Department of Education and Training, 2016).
Data from the 2011 census shows that Indigenous Australians with bachelor or higher qualifications have very high levels of employment (similar to non-Indigenous graduates), compared to those with Certificate II and below qualifications and those who have no post-school qualifications.
More information and data is available in the full Closing the Gap Prime Minister's Report 2017.
Local solutions
Supporting youth pathways
"I now want to begin my studies at Flinders University and study a bachelor of social work to become a social worker." - Kelli Gunter, Indigenous Youth Mobility Pathways participant.
Find out more on the IYMP local solution
More local solutions are available on the resources page
[1] The Indigenous attendance rate was counted as being on track if the attendance rate (rounded to a whole number) was equal or greater than the agreed trajectory point.
[2] National Assessment Program – Literacy and Numeracy (NAPLAN)
[3] These trajectory points allow us to assess whether progress is occurring at a sufficient rate to halve the gap by 2018.
[4] Writing results from 2011 onwards cannot be directly compared to the writing results from previous years, and so have been excluded.
[5] This only counts students who participated in the test in 2016, excluding those who were absent or withdrawn. Since these numbers are not projected to the target year (2018), they do not have to be adjusted for population growth or potential changes in non-Indigenous rates.
[6] There was only one significant decline –Victoria in Year 3 numeracy.
[7] Note that as the smallest jurisdiction, the ACT has the most uncertainty around its results. In 2016, the results for all eight areas were under the trajectory points, but were still consistent with the trajectories due to large confidence intervals around those results.
[8] Comparisons with non-Indigenous Australians for this target are sourced from the ABS Survey of Education and Work 2008 and 2014.
[9] Due to the small numbers of 20-24 year olds in the survey samples, it is difficult to detect change over time at the jurisdictional level.