Education is a foundation for hope and success and can help people overcome other disadvantages. At higher levels of education, there is virtually no employment gap between Indigenous and non-Indigenous Australians (Karmel, Misko, Blomberg, Bednarz, & Atkinson, 2014). In contrast, those with low educational attainment tend to have poorer health outcomes, lower incomes and reduced employment prospects (AHMAC, 2015).
The management and delivery of schooling is the responsibility of state and territory governments. The Australian Government’s efforts are focused on early intervention, engaging with parents, encouraging school attendance, adaptive teaching methods and training and supporting high quality school leaders and teachers.
School Attendance
School attendance – going to preschool, attending school regularly, engaging actively in learning and continuing at school through to Year 12 – is critical for children to achieve their full potential.
An analysis of the gap in school performance between Indigenous and non-Indigenous 15-year-olds concluded that, all things being equal, approximately 20 per cent of the gap in performance between Indigenous and non- Indigenous 15-year-olds is explained by relatively poor school attendance among Indigenous students (Biddle, 2014).
The report Student Attendance and Educational Outcomes: Every Day Counts found that average academic achievement on the National Assessment Program – Literacy and Numeracy (NAPLAN) tests declined with any absence from school, and continued to decline as absence rates increased (Hancock, Shepherd, Lawrence, & Zubrick, 2013).
Although Aboriginal and Torres Strait Islander people comprise three per cent of the population, the younger demographic of the Indigenous population means they comprise 6.7 per cent of school enrolments in government schools (ABS, 2015b).
In May 2014, COAG agreed to a new target to close the gap between Indigenous and non-Indigenous school attendance by the end of 2018. Agreement to this target reflects the strong link between school attendance and student performance.
target
Close the gap between Indigenous and non-Indigenous school attendance within five years (by 2018).- Recognising the critical importance of school attendance, all governments are working with communities and families to encourage and support children going to school regularly.
- In 2015, the overall attendance rate for Indigenous students nationally was 83.7 per cent, compared with 93.1 per cent for non-Indigenous students.
- There has been little change in the Indigenous school attendance rate from 2014 (83.5 per cent) to 2015 (83.7 per cent). Progress will need to accelerate from now on for this target to be met.
- In some remote communities, where attendance rates can be low, a new, community-led approach through the Remote School Attendance Strategy has seen improvements.
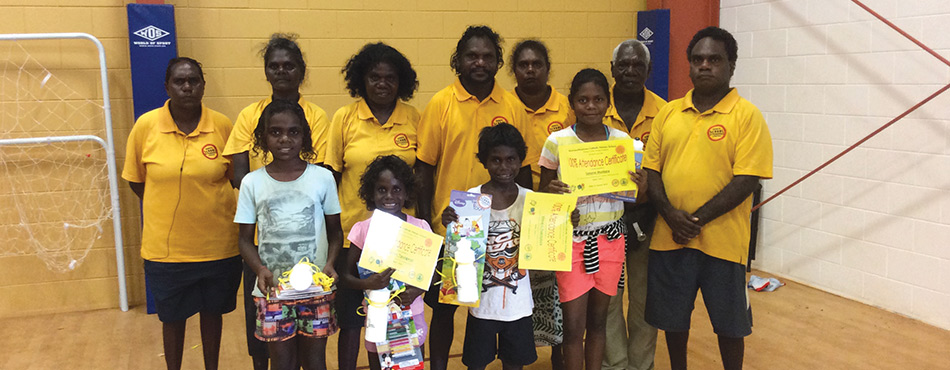
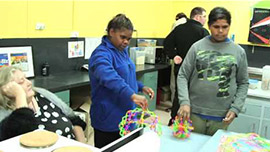
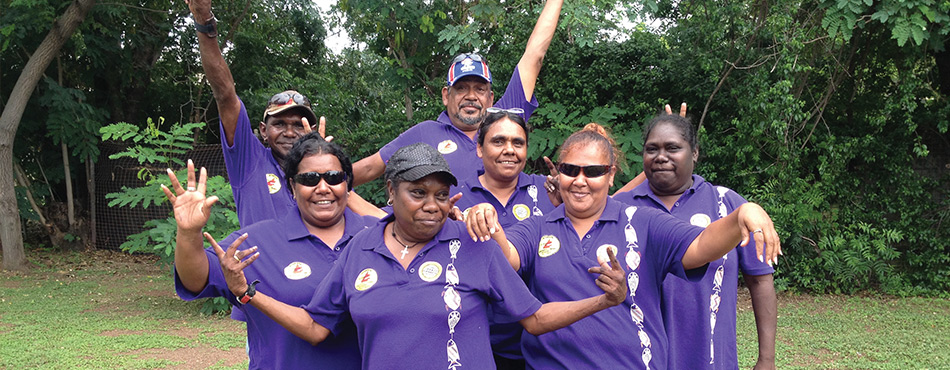
Tiwi students (left to right) Hailey, Roshani, Kane & Simone receive their Excellent Attendance Awards from the Arrikininga Shirts.
What progress is being made?
In Semester 1, 2015, the national school attendance rate (Year 1 to 10) was 92.6 per cent, however, there is a sizeable gap between Indigenous and non-Indigenous students. In 2015, the attendance rate for Indigenous students was 83.7 per cent, over 9 percentage points lower than the comparable rate for non-Indigenous students (93.1 per cent). While this is a sizeable gap, the data tells us that on a given school day the vast majority of Aboriginal and Torres Strait Islander students are attending school.
There has been little change in the rate of school attendance for Aboriginal and Torres Strait Islander children from 2014 (83.5 per cent) to 2015 (83.7 per cent). As the Indigenous attendance rate was below the agreed trajectory point in 2015, progress will need to accelerate from now on if this target is to be met.7
There was also little change in the rate of attendance for Aboriginal and Torres Strait Islander students from 2014 to 2015 by state and territory. All of the changes were less than one percentage point, apart from the ACT (1.3 percentage point rise) and Victoria (1.0 percentage point rise).
Three jurisdictions (Victoria, Tasmania and the ACT) were on track with this target in 2015.8 Progress will need to accelerate in the other jurisdictions from now on if the target is to be met.
This year, there has been a significant improvement in data collection. For the first time we now have national estimates of school attendance. Prior to this year, national data were not available due to differences in the way in which school attendance was reported across jurisdictions. Progress against the new target will be assessed with Semester 1 attendance data (Year 1 to 10) each year. As the agreed end point for the target is the end of 2018, the closest semester point is Semester 1, 2019.9
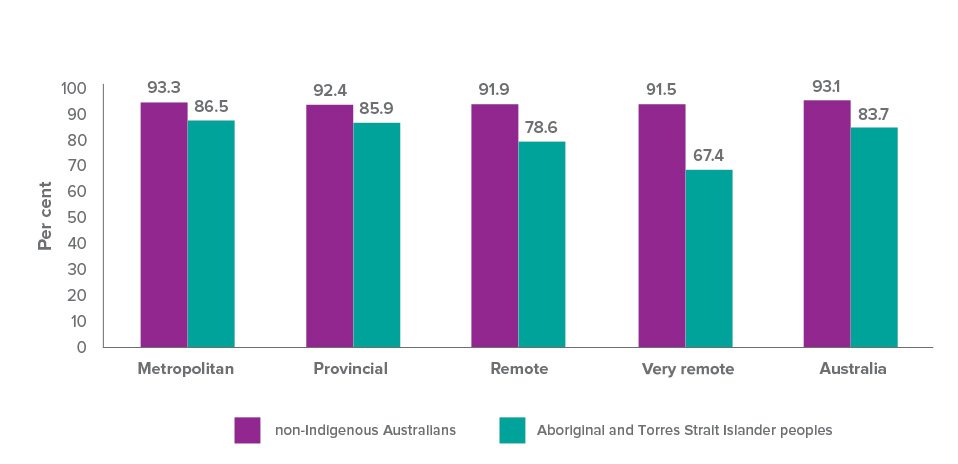
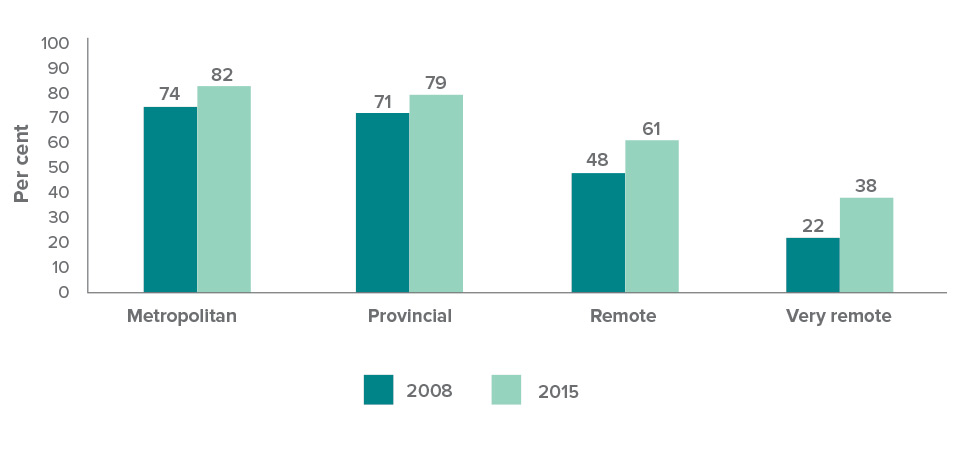
Data are now also available for the first time on Indigenous and non-Indigenous attendance rates by remoteness area:
- The Indigenous attendance rate in very remote areas (67.4 per cent) is much lower than in metropolitan areas (86.5 per cent), as illustrated in Figure 2
- As there is little variation in attendance rates for non-Indigenous students by remoteness area, the gap is much larger in very remote areas (24.1 percentage points) than it is in metropolitan areas (6.8 percentage points) or provincial areas (6.5 percentage points).
 Source: Australian Curriculum, Assessment and Reporting Authority
Aboriginal and Torres Strait Islander student attendance rates for 2015 were lower than for non-Indigenous students for all year levels. Indigenous and non-Indigenous attendance rates both fall at higher year levels, however the decline for Indigenous students is more rapid. As a result the attendance gap increases at higher year levels.
Improving transparency around school attendance
In December 2013, COAG agreed to increase the level of transparency around school attendance. Attendance data will be published twice a year by schools for all students, split by Indigeneity (subject to privacy thresholds). Previously, attendance figures for schools were only published without a split by Indigeneity once a year on the MySchool website.10
COAG also agreed to the publication of the proportion of Indigenous and non-Indigenous students attending school more than 90 per cent of the time for each school from 2015.
Data on the proportion of students attending school 90 per cent or more of the time (in Semester 1) was published on 19 November 2015 and attendance data for Term 3 was published on MySchool on 18 December 2015.11
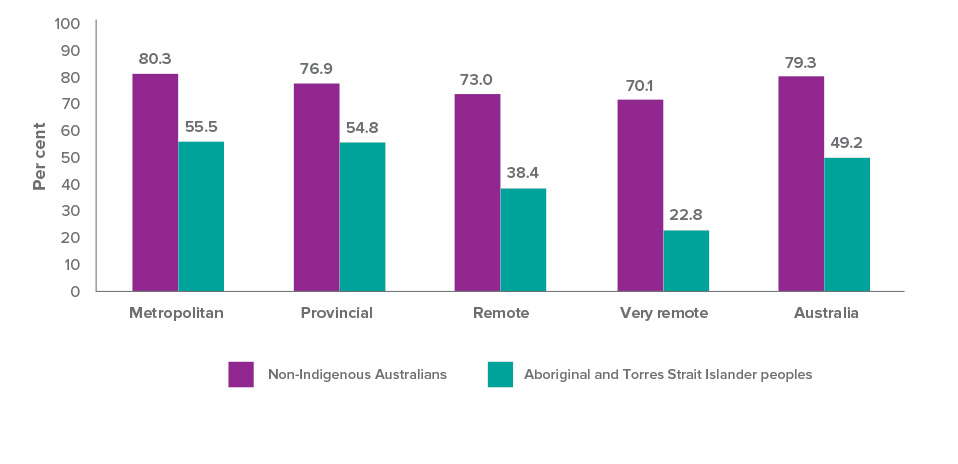
The new data show a significant gap between Indigenous and non-Indigenous students. In Semester 1, 2015, 79.3 per cent of non-Indigenous students attended school 90 per cent or more of the time compared to only 49.2 per cent of Indigenous students. While this is a large gap it is worth noting that around 20 per cent of non-Indigenous students are not attending school 90 per cent or more of the time. Clearly attendance is not just an issue for Aboriginal and Torres Strait Islander students.
There is a strong pattern by remoteness area with 55.5 per cent of Indigenous students in metropolitan areas attending school 90 per cent or more of the time compared with 22.8 per cent of Indigenous students in very remote areas (see Figure 3).
 Note: Excludes NSW government schools
Source: Australian Curriculum, Assessment and Reporting Authority
Note: Excludes NSW government schools
Source: Australian Curriculum, Assessment and Reporting Authority
A recent study has also shown that Indigenous boys have a lower level of school attendance than Indigenous girls and this difference between boys and girls is larger for Indigenous students than for non-Indigenous students (Meehl and Biddle 2016).
Accelerating progress
Achieving and sustaining improved school attendance rates demands concerted effort from governments, communities and families. School attendance and engagement is one of the priorities for collaborative action under the National Aboriginal and Torres Strait Islander Education Strategy. This includes work to better understand the complex factors influencing school attendance, and to better assist and support student engagement.
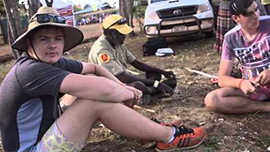
Remote School Attendance team from Normanton State School in Far North Queensland celebrating the start of the school year with a fun day themed: School is Cool!
The Remote School Attendance Strategy (RSAS) was developed in partnership with communities to lift school attendance levels in remote communities, where attendance rates are often very low. RSAS employs local people to work with parents and carers, the community and schools to support children to go to school every day they possibly can. In 2014 and 2015, it operated in 73 schools across 69 communities. From Term 2, 2013 to Term 2, 2015:
- The attendance rate (Year 1-10) rose in 10 Queensland Government RSAS schools and fell in one school. Overall there was a 3 percentage point increase in the attendance rate in these schools. Schools where there were large rises in attendance included Camooweal State School (up 17.3 percentage points) and Doomadgee State School (up 8.8 percentage points).
- Twenty one (70 per cent) of the NorthernTerritory Government RSAS schools recorded an increase in their attendance rate (Year 1-10). The average attendance rate in Northern Territory Government RSAS schools rose by 3.2 percentage points. Schools where there were large rises in the attendance rate over this period included Ngukurr School (up by 15 percentage points) and Alekarenge School (up by 14.8 percentage points).
Attendance data published on MySchool shows that out of the 73 RSAS schools, 49 schools saw their attendance rate rise, 21 schools experienced a fall and three schools had no change in their attendance rate from Semester 1, 2013 to Semester 1, 2015. RSAS has been extended for a further three years from 2016 to 2018 with an additional $80 million in funding.
LITERACY AND NUMERACY
Literacy and numeracy skills are vital for students to succeed at school and move into employment. A recent study found that if Indigenous and non-Indigenous students reach the same level of academic achievement by the time they are 15, there is no significant difference in subsequent educational outcomes such as completing Year 12 and participating in university or vocational training (Mahuteau, Karmel, Mayromaras, & Zhu, 2015).
A child’s ability to acquire good literacy and numeracy is associated with a positive start to life. Guthridge et al. (2015) investigated the association between early life risk factors and NAPLAN results in a large cohort study of children in the Northern Territory. They found that, controlling for other factors, low-birth weight is associated with poorer numeracy results for Aboriginal and Torres Strait Islander children.
target
Halve the gap for Indigenous children in reading, writing and numeracy achievements within a decade (by 2018).- Across the eight areas (reading and numeracy for Years 3, 5, 7 and 9), the proportion of Indigenous students achieving national minimum standards is on track in four areas.
- NAPLAN results for Indigenous students vary sharply by remoteness area and were better for female students than males.
- Although the literacy and numeracy gap remains, the numbers required to halve the gap are within reach.
- Improving literacy and numeracy requires a twofold approach: addressing early childhood education, and accelerating learning for students currently at school.
What Progress is being made?
Progress against this target is assessed using data on the proportion of students at or above the National Minimum Standards (NMS) as measured through the NAPLAN. Progress is tracked each year for reading and numeracy for Years 3, 5, 7 and 9.12
This year’s results are considerably more positive than the results for 2014. However caution is required as results vary from one year to the next. Last year at the national level, no statistically significant improvements were evident in the proportion of Aboriginal and Torres Strait Islander students at or above the NMS in reading and numeracy results in any year level from 2008 to 2014. This year, there were statistically significant improvements in five of the eight areas. Improvements from 2008 to 2015 were evident for Year 3, 5 and 7 reading and for Year 5 and 9 numeracy. However, there has been no significant change from 2008 to 2015 for Year 9 reading and Year 3 and Year 7 numeracy.
Another way to assess progress is to see whether the latest results are consistent with the agreed trajectory points. These points allow us to assess whether progress is occurring at a sufficient rate to halve the gap by 2018. In 2015, results in four of the eight areas (Year 7 reading and Year 5, 7 and 9 numeracy) were consistent with, or above, the required trajectory points at the national level. In the other four areas, 2015 results were below the required trajectory points, which mean that progress will need to accelerate for this target to be met.
Although the numeracy and literacy gap remains, the good news is that in terms of actual student numbers the gap is not large. If an additional 640 Indigenous children had achieved national minimum standards in reading and 1,270 in numeracy, the target would have been met for Year 3 in 2015.13
NAPLAN results for Aboriginal and Torres Strait Islander students vary sharply by remoteness area. For example, in 2015, 82 per cent of all Indigenous students in metropolitan areas met or exceeded the NMS for Year 5 reading compared to only 38 per cent of students in very remote areas. As results for non-Indigenous students show less variation by remoteness area, the gap is much wider in very remote areas than it is in metropolitan areas.
In the instances where Indigenous results improved significantly from 2008 to 2015 (Year 3, 5 and 7 reading and Year 5 and 9 numeracy), significant improvements are evident in metropolitan, provincial, remote and very remote areas. The three instances with no significant change from 2008 to 2015 showed no significant improvements across the four geographic areas. Figure 4 illustrates the (significant) changes in Year 5 reading.
 Source: Australian Curriculum, Assessment and Reporting Authority
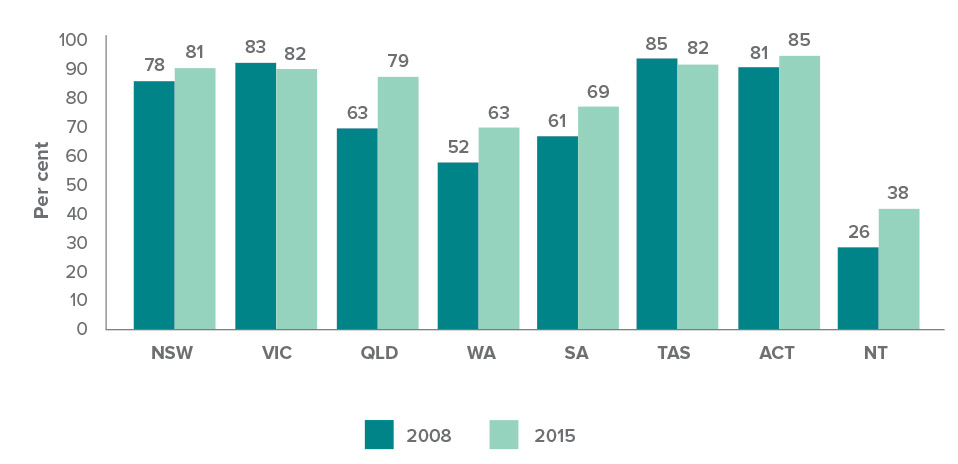
Results also vary by state and territory. The Northern Territory has the lowest proportion of Indigenous students at or above the NMS for each year level (of reading and numeracy). This result partly reflects the pattern by remoteness area as the Northern Territory has a much higher proportion of Indigenous students in remote or very remote areas than any other jurisdiction.
Queensland has shown the largest improvements, with significant improvement in seven of the eight tests (all but Year 9 reading) from 2008 to 2015. Figure 5 illustrates this using Year 5 reading results. Overall there has been significant improvement in Indigenous results for 21 of the 64 state-level measures (numeracy and reading across four year levels in eight jurisdictions).14
 Source: Australian Curriculum, Assessment and Reporting Authority.
There is a significant gap in performance at school between Indigenous boys and girls. For reading literacy on average, 15-year-old Indigenous males are performing about one-and-a-third years of schooling below their female peers (Thomson, De Bortoli, & Buckley, 2013). A recent study by Meehl and Biddle (2016) shows that for both the Indigenous and non-Indigenous population, females outperform their male counterparts when maths, reading and science test scores are averaged. The gap between females and males is considerably larger for the Indigenous population.15
The NAPLAN data also suggests that Indigenous girls are performing better than Indigenous boys. Indigenous girls outperform Indigenous boys in reading across all year levels and across all remoteness areas.16 As an example, in very remote areas 53 per cent of all Indigenous girls met the NMS for Year 3 reading in 2015 compared to 41 per cent of Indigenous boys.
ACCELERATING PROGRESS
Addressing the disparity in literacy and numeracy outcomes requires a twofold approach: preventative strategies such as better early childhood education services as well as strategies to accelerate learning for students currently at school.
National collaborative action to improve outcomes for Aboriginal and Torres Strait Islander students has been endorsed by COAG’s Education Council in the National Aboriginal and Torres Strait Islander Education Strategy. It guides jurisdictions in developing and implementing localised policies and actions with a focus on school and child readiness, attendance, literacy and numeracy, and transition points including pathways to post-school options.
Under the Australian Government’s Students First approach there is a focus on school autonomy, quality teachers, an effective curriculum, and increased parental engagement for all Australian students. This includes:
- An estimated $221.75 million in 2015 for the Aboriginal and Torres Strait Islander student loading to assist schools to provide additional support for students through needs-based school funding arrangements.
- $11.6 million over three years from 2014 to specific non-government schools for the additional costs associated with boarding and educating Indigenous students from remote communities.
- $22 million over four years (2013-14 to 2016-17) under the Flexible Literacy for Remote Primary Schools Programme to address the disparity in literacy outcomes between metropolitan and rural and remote schools.
- $4 million in funding over four years (2014-15 to 2017-18) to the Australian Research Alliance for Children and Youth to undertake research and develop resources to help parents better engage in their child’s education – with a key focus on Aboriginal and Torres Strait Islander specific parent engagement.
The single most important in-school determinant for student outcomes is the quality of teachers. The Government is focusing on improving teacher quality by building on nationally agreed standards. The Australian Professional Standards for Teachers (the Standards) provide a public statement of what constitutes teacher quality and defines what teachers should know and be able to do at different stages across their careers. The Standards require teachers to know about and use strategies for teaching Aboriginal and Torres Strait Islander students grounded in an understanding of, and respect for, Aboriginal and Torres Strait Islander people.
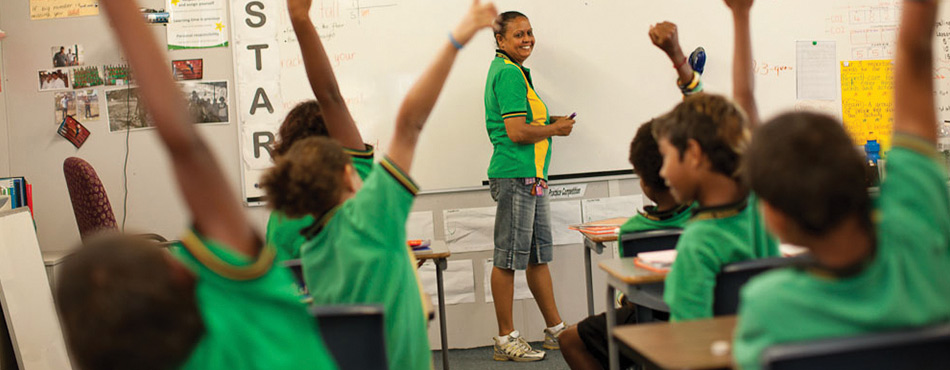
Maureen Liddy teaches a class at the Cape York Academy's Coen campus.
case study IMPROVING LITERACY IN REMOTE PRIMARY SCHOOLS
The Flexible Literacy for Remote Primary Schools Programme aims to lift literacy learning in disadvantaged, low-performing schools through the introduction of Direct Instruction (DI) and Explicit Direct Instruction . It’s being piloted in 33 schools across the Northern Territory, Western Australia and Queensland. Over 75 per cent of students in these schools are Indigenous students.
These teaching methods have a proven record in lifting standards in disadvantaged, low-performing schools. Professor John Hattie found the DI method is one of the most effective teaching interventions for improving student outcomes and delivers approximately 1.5 years of progress in one year of schooling (Hattie, 2009).
Explicit teaching methodologies have shown promising results in the Cape York Academy (CYA) Schools. For example, in 2015 Coen’s entire Year 3 cohort achieved a result above the National Minimum Standard in Numeracy and the Year 5 cohort exceeded the National Minimum Standard in Reading and Numeracy. All CYA schools reported an increase in the number of students with attendance over 90 per cent. Although it’s early days, the Flexible Literacy Programme is showing promise. Students are making progress, their engagement is increasing and the quality of teaching is improving.
“I have been amazed by the improvements I have seen in such a short period of time. The DI programme has had a greater demonstrable effect on student literacy than I have seen in any programme previously.” – Teacher, Northern Territory
YEAR 12 ATTAINMENT
Attainment of a Year 12 or equivalent qualification is a key building block to forge a successful career or move to higher education.
target
Halve the gap for Indigenous Australians aged 20-24 in Year 12 attainment or equivalent attainment rates (by 2020).- The target to halve the gap in Year 12 attainment by 2020 is on track.
- The proportion of Indigenous students attaining Year 12 was higher in major cities and regional areas than remote and very remote areas.
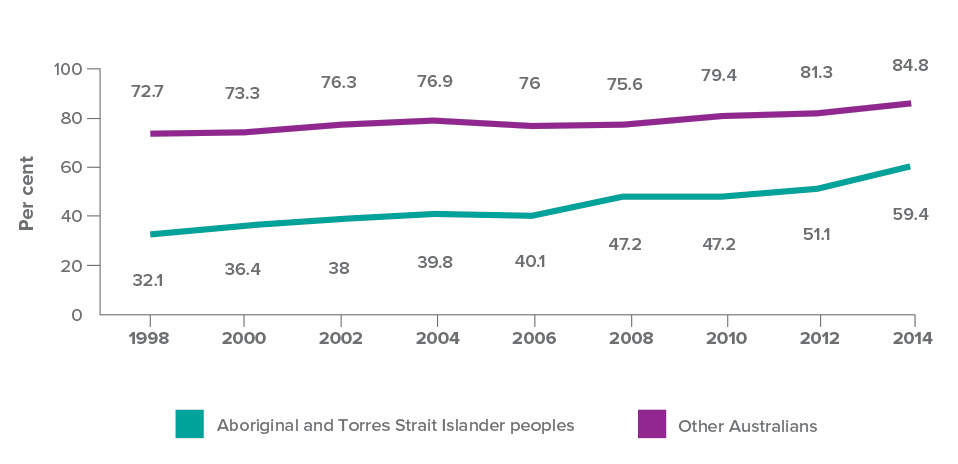
- Over the long-term there have been improvements in apparent retention rates to Year 1217 for Indigenous students, up from 32 per cent in the late 1990s to 60 per cent in 2014.
- Scholarships and mentoring support students from remote areas to move away to complete their secondary studies.
- Different pathways, such as school-based apprenticeships, are offered to support students at risk of leaving school early.
WHAT PROGRESS IS BEING MADE?
 Note: ‘Other’ includes non-Indigenous Australians and those for whom Indigenous status was not stated.
Source: ABS Schools, Australia 2014 (ABS, 2015b)
Note: ‘Other’ includes non-Indigenous Australians and those for whom Indigenous status was not stated.
Source: ABS Schools, Australia 2014 (ABS, 2015b)
There has been no new national data released on Indigenous Year 12 or equivalent attainment rates since last year’s Closing the Gap Report. New data will be available in April 2016 from the ABS National Aboriginal and Torres Strait Islander Social Survey.
This target is on track. Nationally, the proportion of Aboriginal and Torres Strait Islander 20 to 24-year- olds who had achieved a Year 12 or equivalent level of education increased from 45.4 per cent in 2008 to 58.5 per cent in 2012-13. Between 2008 and 2012-13, the gap with non-Indigenous Australians narrowed by 11.6 percentage points (from 39.6 percentage points in 2008 to 28 percentage points in 2012-13).
For non-Indigenous Australians, the proportion of 20 to 24-year-olds who achieved a Year 12 or equivalent level of education rose slightly (85.0 per cent in 2008 to 86.5 per cent in 2012). The Year 12 gap would have been halved by 2012-13 (from the 2008 baseline) if an additional 8,000 Indigenous 20 to 24-year-olds had a Year 12 or equivalent level of education.18
In 2012-13, Year 12 attainment among Aboriginal and Torres Strait Islander young people aged 20-24 years varied considerably by remoteness, ranging from 65.5 per cent in outer regional areas to 36.8 per cent in very remote areas.
Longer term trends demonstrate that significant progress is being made to boost the rate of Year 12 attainment among Aboriginal and Torres Strait Islander people. For example, in 1976 over half of all Indigenous men aged 20-64 had either never attended school or left school at 14 or younger. By 2011, only 14 per cent of all Indigenous men had either never attended school or left school at Year 8 or below.19
While we do not have any new data for the target we do have new data on the apparent retention rate which is an estimate of the proportion of Year 7/8 students who have stayed at school until Year 12.20
In 2014, the apparent retention rate data suggested that three out of five Indigenous students stayed at school until Year 12. This is a vast improvement on the late 1990s when only one in three stayed until Year 12. For the most part this rate has been steadily increasing and the gap with non-Indigenous young people has narrowed. The apparent retention rate also reveals higher rates for Indigenous females than for Indigenous males in 2014 (63.8 per cent compared with 55.1 per cent).
The relationship between Year 12 and disability is explored in Chapter Five.
ACCELERATING PROGRESS
The Indigenous Advancement Strategy (IAS) Children and Schooling Programme is providing $222.3 million in 2015-16 for a number of projects that support Aboriginal and Torres Strait Islander young people to increase engagement and retention in education, training and employment, and diversionary programmes to encourage re-engagement.
Australian Government funding supports:
- Mentoring activities such as those delivered by the Australian Indigenous Mentoring Experience.
- Full-time, intensive school-based academies to improve student engagement such as those delivered by the Clontarf Foundation and Role Models and Leaders Australia.
- Scholarship and mobility projects such as those delivered by the Australian Indigenous Education Foundation, Career Employment Australia and the Smith Family help young Aboriginal and Torres Strait Islander people move from regional and remote communities for education and training, including Year 12 completion or Certificate III qualification or above. Secondary school scholarships, mostly for students from remote locations, enable young people to attend secondary schools – government and non-government, day and boarding schools. The students receive help with accommodation, mentoring, life skills and other practical support to help them finish their studies.
- Australian School-based Apprenticeships (ASBA) which combine paid employment as an apprentice or a trainee, off-the-job vocational training and senior secondary school studies. In 2014, 1,817 Indigenous young people started ASBAs representing 8.7 per cent of the total number of starters. This is an increase on 2010 when 1,190 started, making up 6.9 per cent of the commencing cohort (NCVER, 2015; NCVER, 2011).
- Australian Apprenticeship Support Network which supports employers and apprentices, including Indigenous apprentices, to complete their apprenticeships.
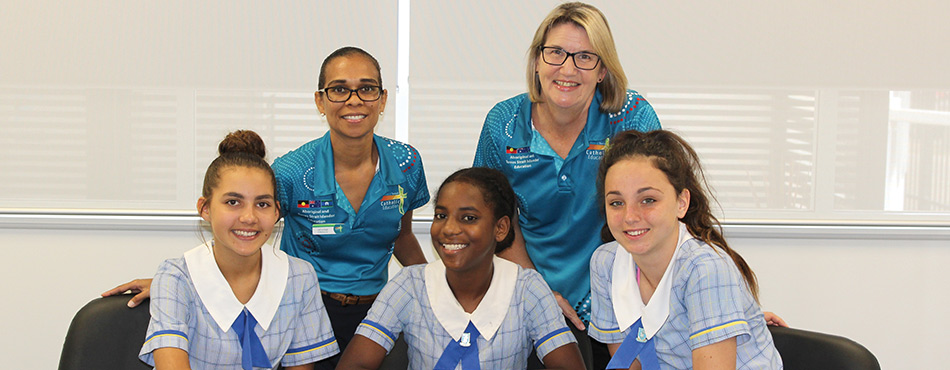
Education officers De’arne French and Janelle Knack (back row) with students from St Margaret Mary’s College in Townsville: (left to right) Tess Baker, Jamaica Lampton and Gabriella Bogdanek.
case study Jump it scholarships
The Townsville Catholic Education Office has created ‘Jump It’ scholarships to assist around 490 Aboriginal and Torres Strait Islander students through Years 10 to 12 to complete their secondary school qualification and then ‘jump the gap’ into university studies, training or apprenticeships and into a job or career. The scholarships are funded under the Indigenous Advancement Strategy.
case study JERICKA MUNGATOPI – WINNER OF THE 2014 NORTHERN TERRITORY BOARD OF STUDIES TELSTRA REMOTE INDIGENOUS STUDENT AWARD
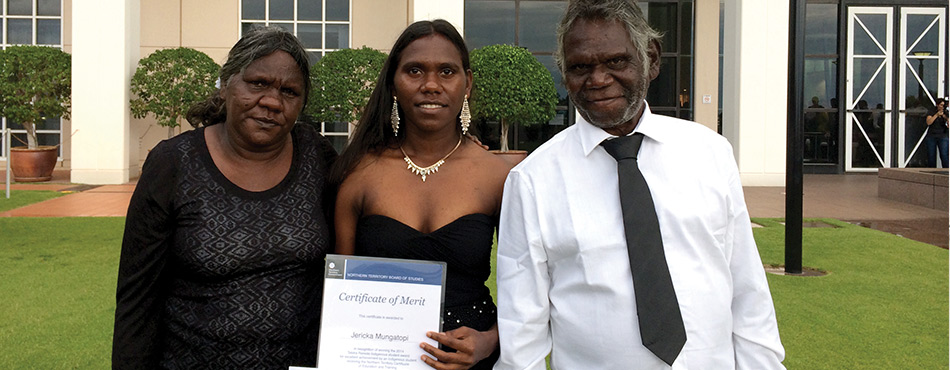
Jericka Mungatopi proudly showing off her award with parents Katrina and Fredrick.
Jericka Mungatopi from Tiwi was the winner of the Northern Territory Board of Studies 2014 Telstra Remote Indigenous Student Award, which recognises the highest achievement by an Indigenous student receiving the Northern Territory Certificate of Education and Training (NTCET) while studying in a remote location.
“When I was in Year 12 I was motivated to come to school because I wanted to finish and get my NTCET to make my family proud and help me get a good job,” Jericka said. She is now working at the school as an assistant teacher while studying to become a qualified teacher.
HIGHER EDUCATION
Over a decade there was a 70 per cent increase (from 8,895 in 2004 to 15,043 in 2014) in the number of Aboriginal and Torres Strait Islander students in higher education award courses compared with 43 per cent growth for all domestic undergraduate students. Indigenous enrolments continue to grow more quickly than enrolment rates for all domestic students: in 2014 Indigenous students represented 1.48 per cent of domestic students in higher education, up from 1.41 per cent in 2013 and 1.25 per cent in 2004.
Indigenous graduates have strong employment outcomes: in 2014, around 77 per cent of Aboriginal and Torres Strait Islander graduates were in full-time employment following completion of their award compared with 68.1 per cent of all graduates (Guthrie, 2015). Data from the 2011 census shows that Indigenous Australians with bachelor or higher qualifications have very high levels of employment, compared to those with Certificate II and below qualifications and those who have no post-school qualifications.
In 2014, 55 per cent of all higher education students in Australia were female. Among Aboriginal and Torres Strait Islander students, 66 per cent were female (Department of Education and Training, 2015). This contrasts with participation in Vocational Education and Training where the majority of Indigenous students were male (55 per cent) (NCVER, 2015).
case study RYAN D'SOUZA AIMING HIGH IN ENGINEERING
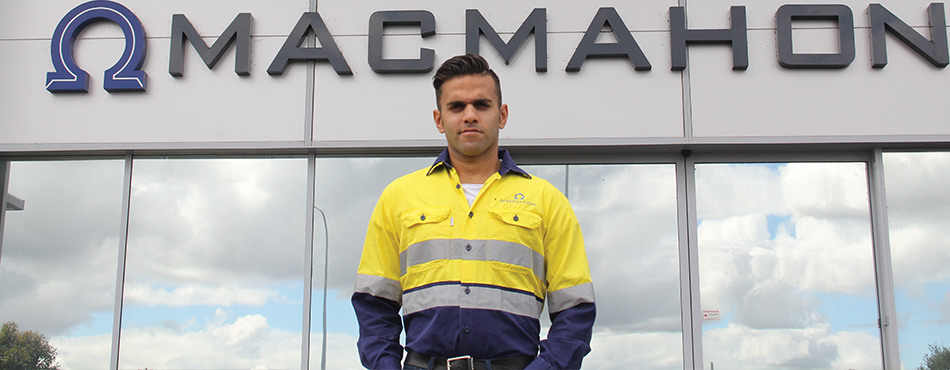
Ryan D’Souza aiming high in engineering.
Twenty-four year old Ryan D’Souza from Western Australia always had an interest in civil and mining opportunities, but it wasn’t until he began a traineeship at Macmahon Holdings that he realised how far it could take him. In 2013, Ryan completed a Certificate III in Civil Construction Plant Operations through Macmahon Holdings, in conjunction with its Indigenous employment centre, Doorn Djll Yoordaning.
He has since been offered an engineering cadetship and he is now working towards a Bachelor of Engineering.
“Before starting with Macmahon, I was drifting, and now I have a real direction – I want to be a civil engineer. I really hope to set a good example and be a mentor and role model for other Aboriginal people to get a great career they enjoy.”