'We believe that capabilities for education start with early childhood education, and then moves onto good primary schooling, successful secondary schooling and further education at university and technical trades, and then the importance of lifelong learning throughout careers.' Cape York Institute.
Introduction
A good quality education lays the foundations for success in later life. While all social indicators are important, education can be the catalyst for improving life outcomes in the long term.
The Australian Government is working with state and territory governments, education authorities, schools and Aboriginal and Torres Strait Islander communities to strive for the best outcomes for Aboriginal and Torres Strait Islander students.
The Australian Government has an important role in the higher education sector, while state and territory governments have constitutional responsibility for schooling and training. In all sectors, the Australian Government plays an important supplementary role in Aboriginal and Torres Strait Islander education including:
- Facilitating partnerships across sectors, across jurisdictions and with families, communities and non-government organisations.
- Enhancing access to education beyond that which would be expected of state and territory governments.
- Improving opportunities for Aboriginal and Torres Strait Islander students to attend and thrive at school, regardless of location.
- Promoting good practice and innovation.
- Ensuring that gender-specific educational needs are identified and addressed.
- Funding complementary activities that support engagement, attainment and completion in school and post-school education.
Over the past ten years, significant investment has provided pathways for young Aboriginal and Torres Strait Islander people to access, engage with and achieve in education from primary and secondary schooling through to tertiary education.
Government investment includes support for:
- Lifting student outcomes. Through the National School Reform Agreement, the Australian Government and state and territory governments are working together to lift student outcomes across Australian schools, with a priority focus on equity for Aboriginal and Torres Strait Islander students. This is supported by additional funding that is expected to benefit around 217,355 students.
- Supporting girls to pursue education and careers in STEM. This year the Commonwealth Scientific and Industrial Research Organisation (CSIRO), in partnership with CareerTrackers, launched an Indigenous Girls’ Science Technology Engineering and Mathematics (STEM) Academy for high-achieving female Aboriginal and Torres Strait Islander students who aspire to pursue education and careers in STEM professions. CSIRO also offers exciting traineeships and cadetships to tertiary students and Aboriginal and Torres Strait Islander peoples to gain real experience in a scientific environment that will kickstart their career.
- Integrating Aboriginal and Torres Strait Islander perspectives. The National Aboriginal and Torres Strait Islander Curricula Project aims to empower all teachers to integrate Aboriginal and Torres Strait Islander perspectives into their classroom practice. The project will provide resources centred around three themes—Astronomy, Fire and Water—showcasing the sophistication of Aboriginal and Torres Strait Islander histories and cultures.
- Supporting attendance, retention and attainment through ABSTUDY. In recognition of the 50th anniversary of ABSTUDY, the Government is investing $38.1 million over five years to better support school attendance, retention and Year 12 attainment for over 5,000 Aboriginal and Torres Strait Islander students and their families.
- Reforming remote delivery to be more flexible and tailored to community needs. From 2019, the Remote School Attendance Strategy (RSAS) will change to have a stronger focus on engagement with communities and increasing local decision making. The strategy will work to build stronger linkages with state and territory governments and schools, broadening its focus from ‘getting kids to school’ to ‘keeping kids in school’. Local employment will remain a key aspect of the new model and RSAS teams will support families to build on their strengths to take an active role in their children’s education.
Hermannsburg Indigenous Engagement Officer, Edward Rontji with Ntaria school kids.
School attendance
Close the gap between Indigenous and non-Indigenous
school attendance within five years (by 2018)
- The target to close the gap between Indigenous and non-Indigenous school attendance is not on track.
- Attendance rates for Indigenous students have not improved between 2014 and 2018 (around 82% in 2018), and remain below the rate for non-Indigenous students (around 93%).
- The gap in school attendance is evident from when children start school. During primary school the attendance gap was around 8 percentage points in 2018. Attendance falls when students reach secondary school – particularly for Indigenous students – and the attendance gap widens to 14 percentage points.
- In remote areas, school attendance by Indigenous students is lower and the attendance gap is larger. In 2018, attendance rates for Indigenous students ranged from 86% in Inner Regional areas to 63% in Very Remote areas.
What the data tells us
National
The target to close the gap between Indigenous and non-Indigenous school attendance by 2018 is not on track. Progress against this target is assessed using Semester 1 school attendance rates for Years 1–10. The final assessment of the target will be considered following the release of Semester 1 2019 attendance data. Semester 1 2019 provides a better representation of changes in school attendance throughout 2018.
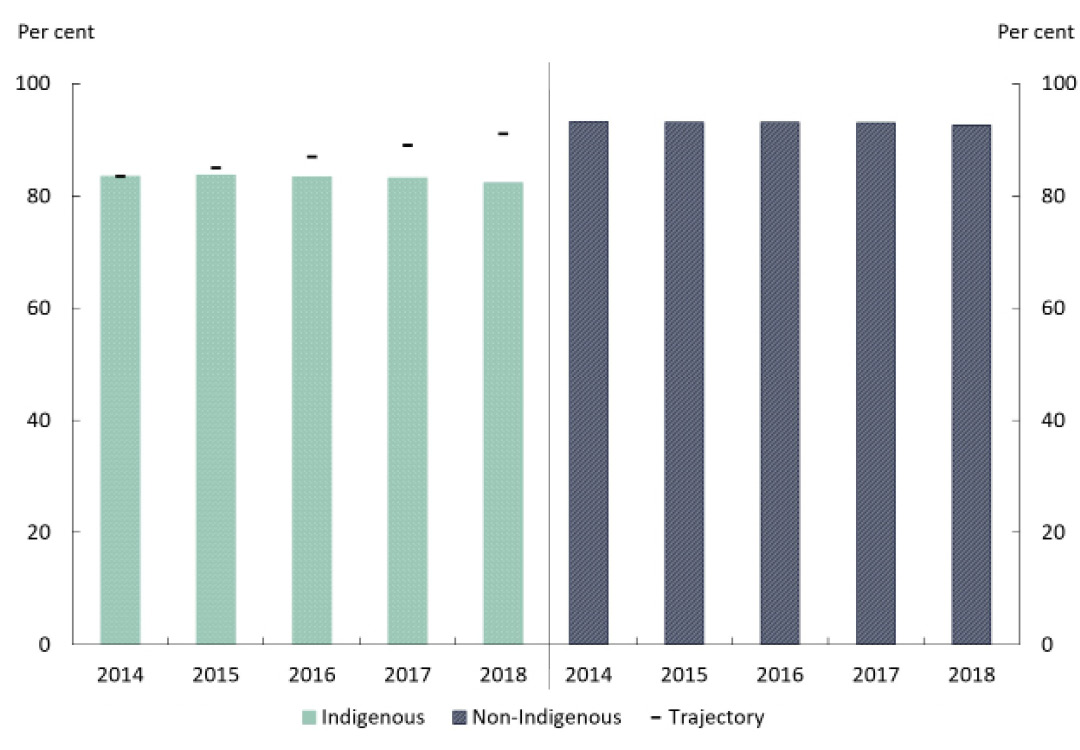
Based on Semester 1 school attendance data reported by the Australian Curriculum, Assessment and Reporting Authority, school attendance rates have not improved for both Indigenous and non-Indigenous students between 2014 and 2018. For both Indigenous and non-Indigenous students, attendance rates decreased by about 1 percentage point over the period (Figure 3.1).
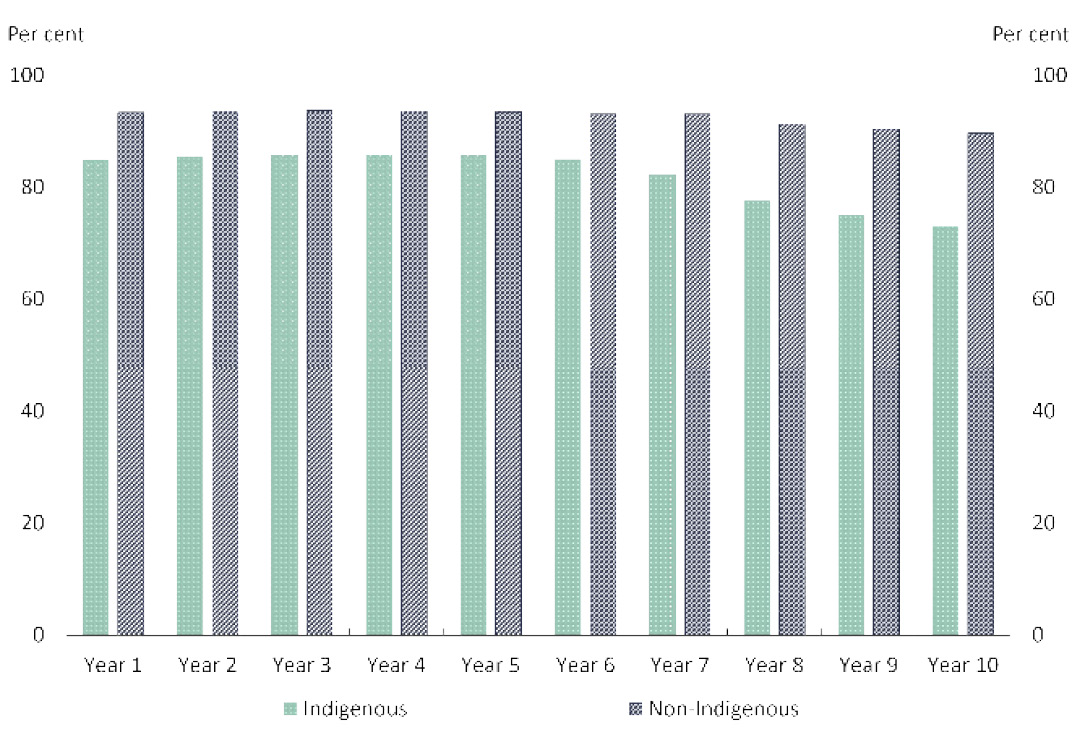
Figure 3.1: Student attendance rates
Source: Australian Curriculum, Assessment and Reporting Authority 2018, ACARA National Student Attendance Data Collection, Australian Curriculum, Assessment and Reporting Authority, Sydney; and National Indigenous Reform Agreement Performance Information Management Group, unpublished.
View the text alternative for Figure 3.1.
In 2018, the national school attendance rate was around 82% for Indigenous students. This compares to an attendance rate for non-Indigenous students of around 93%. With similar movement in both student populations, the gap in attendance rates has remained at around 10 percentage points over the past five years.
The gap in school attendance is evident from when children start school. Among primary school students the attendance gap was around 8 percentage points in 2018. The gap increased to around 14 percentage points for Indigenous students in secondary school (Box 3.1).
While attendance rates are slightly higher for girls than boys for both Indigenous and non-Indigenous students, the difference is larger for Indigenous students. In 2018, there was a 0.3 percentage point gap in attendance between non-Indigenous boys and girls. Attendance by Indigenous girls, however, was 1.3 percentage points higher than Indigenous boys. Indigenous girls also recorded slightly higher levels of consistent school attendance than Indigenous boys (Box 3.2).
States and territories
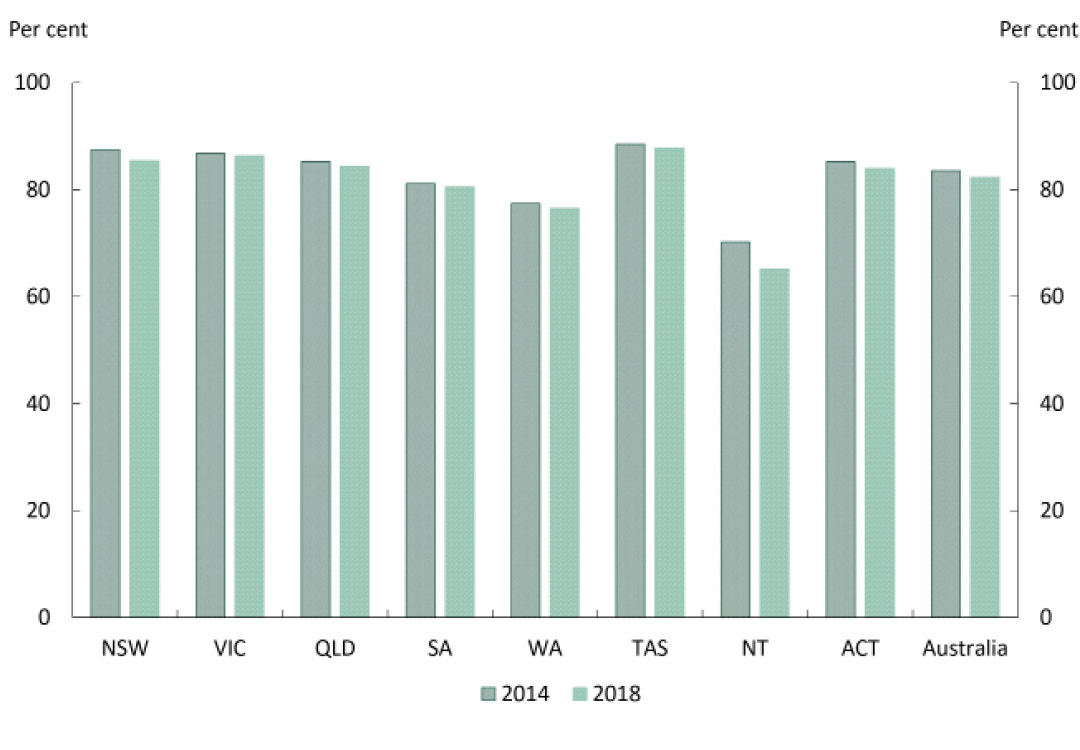
There has been no improvement in attendance rates for Indigenous students across the states and territories. The largest change has been in the Northern Territory, where the attendance rate fell by around 5 percentage points between 2014 and 2018. Declines of around 2 percentage points or less have been observed in the attendance rate for Indigenous students in all other jurisdictions (Figure 3.2).
Figure 3.2: Indigenous student attendance rates by jurisdiction
Source: Australian Curriculum, Assessment and Reporting Authority 2018, ACARA National Student Attendance Data Collection, Australian Curriculum, Assessment and Reporting Authority, Sydney.
View the text alternative for Figure 3.2.
Remoteness
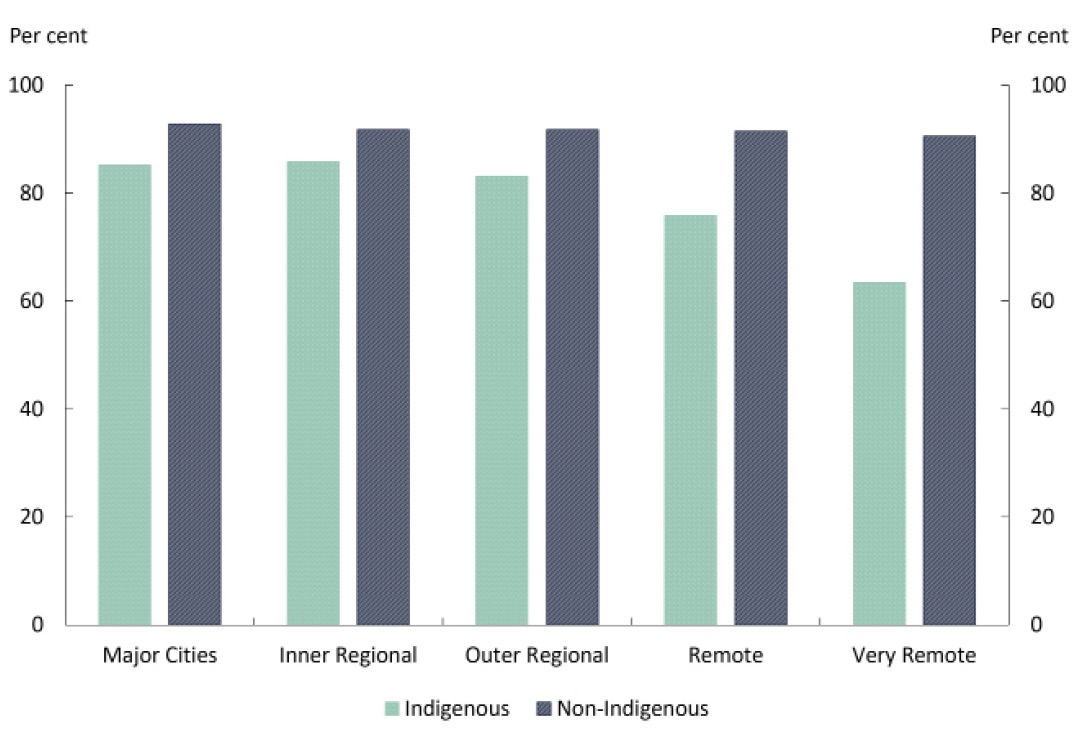
School attendance rates for Indigenous students are higher in metropolitan areas, and lower in remote areas. In 2018, the attendance rate for Indigenous students ranged from 86% in Inner Regional areas to 63% in Very Remote areas.
While attendance rates for non-Indigenous students did not vary substantially by remoteness, attendance rates for Indigenous students decline with remoteness. The gap in attendance rates, therefore, increases with remoteness (Figure 3.3). The gap between Indigenous and non-Indigenous attendance rates was 27 percentage points in 2018 in Very Remote areas, and narrowed to 6 percentage points in Inner Regional areas.
Figure 3.3: Student attendance rates by remoteness, Semester 1 2018
Source: Australian Curriculum, Assessment and Reporting Authority 2018, ACARA National Student Attendance Data Collection, Australian Curriculum, Assessment and Reporting Authority, Sydney.
View the text alternative for Figure 3.3.
Similar to the attendance rate, the level of consistent attendance — that is, the share of students who attended school 90% or more of the time — was highest in Inner Regional areas (55% attending 90% or more of the time) and fell off sharply in remote areas (to 21% in Very Remote areas). Again, the attendance levels for non-Indigenous students showed less difference by remoteness, and as a result the gap in consistent school attendance was highest in Remote and Very Remote areas.
While Indigenous and non-Indigenous school attendance is stable throughout primary school (Years 1–6), attendance rates fall in secondary school (Years 7–10). The decline in attendance is larger for Indigenous students. For Indigenous students in 2018, the attendance rate in Year 10 (73%) was around 12 percentage points lower than in Year 6; for non-Indigenous students the Year 10 rate (90%) was around 3 percentage points lower than in Year 6 (Figure 3.4).
Over the past five years, attendance rates have not materially changed for non-Indigenous secondary students. Attendance for Indigenous secondary students, however, declined slightly from 79% in 2014 to 77% in 2018. This resulted in a slight increase in the attendance gap for secondary students, of less than 2 percentage points over the period.
Figure 3.4: Student attendance rates by year level, Semester 1 2018
Source: Australian Curriculum, Assessment and Reporting Authority 2018, ACARA National Student Attendance Data Collection, Australian Curriculum, Assessment and Reporting Authority, Sydney.
View the text alternative for Figure 3.4.
While many factors contribute to learning outcomes, poor school attendance has been linked to lower achievement in numeracy, writing and reading. Between 2008 and 2012, after taking into account student demographics and school location, NAPLAN scores for students in Western Australia were found to decline with any school absence, and continued to decline as the number of days absent increased (Hancock et al. 2013).
Around three quarters of all students attended school 90% or more of the time in 2018. This means a quarter of Australian children are not attending school consistently. Levels of consistent attendance are lower again among Indigenous students – just under half (49%) of Indigenous students attended school 90% or more of the time, compared with 77% of non-Indigenous students. This leaves a gap in the level of consistent school attendance of around 28 percentage points.
In 2018, the gap in consistent attendance was 26 percentage points for primary school students compared to 32 percentage points for secondary students (Figure 3.5).
Figure 3.5: Proportion of students who attended school 90% or more of the time, Semester 1 2018
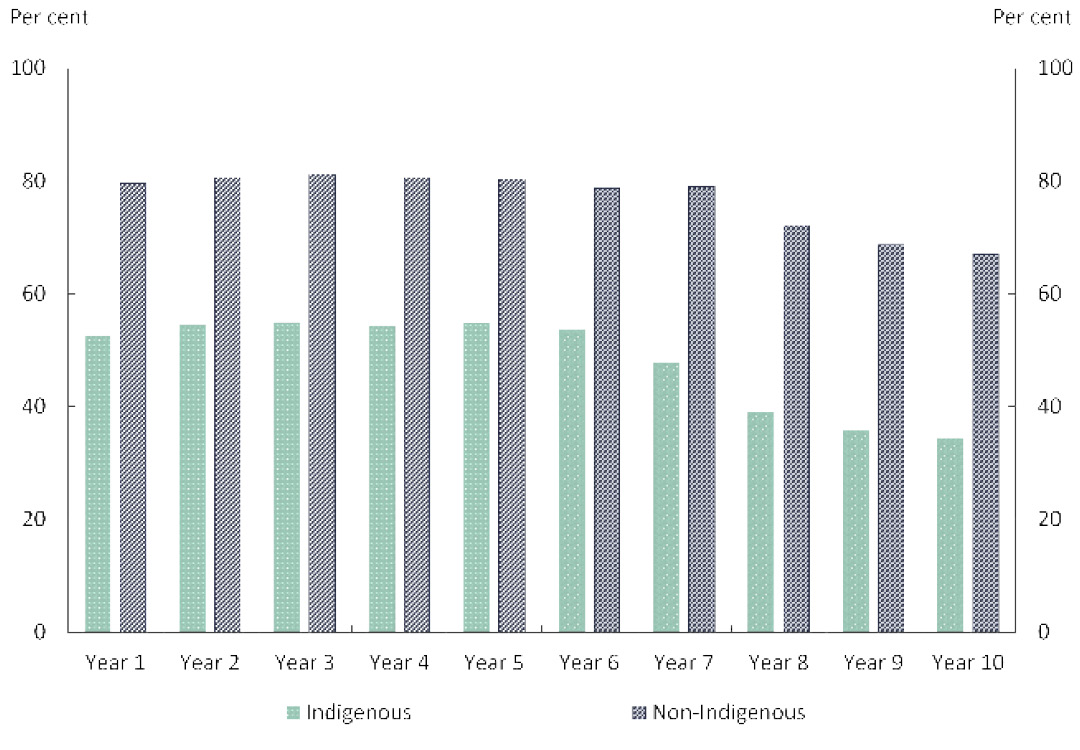
Source: Australian Curriculum, Assessment and Reporting Authority 2018, ACARA National Student Attendance Data Collection, Australian Curriculum, Assessment and Reporting Authority, Sydney.
View the text alternative for Figure 3.5.
Indigenous girls recorded slightly higher levels of consistent school attendance than Indigenous boys. The gap in the level of consistent attendance was slightly smaller for girls than boys, around 27 percentage points and 29 percentage points respectively in 2018.
In primary school, 56% of Indigenous girls consistently attended school compared with 52% of Indigenous boys. In secondary school, consistent school attendance dropped to 41% for Indigenous girls and 38% for Indigenous boys.
Literacy and numeracy
Halve the gap for Indigenous children in reading,
writing and numeracy within a decade (by 2018)
- As outlined in the 2018 Report, the target to halve the gap for Indigenous children in reading and numeracy is not on track.
- The share of Indigenous students at or above national minimum standards has improved and the gap has narrowed between 2008 and 2017. In particular, the share of Indigenous students at or above minimum standards in Years 3 and 5 reading, and Years 5 and 9 numeracy, increased by around 11–13 percentage points (statistically significant).
- Outcomes vary by state and territory, and only Year 9 numeracy is on track in all the states and territories.
What the data tells us
National
As outlined in the 2018 Report, the target to halve the gap in the share of Indigenous children at or above national minimum standards in reading and numeracy in Years 3, 5, 7 and 9 within the decade to 2018 is not on track.[17] The 2018 National Assessment Program – Literacy and Numeracy (NAPLAN) data were not available in time for inclusion in this Report.
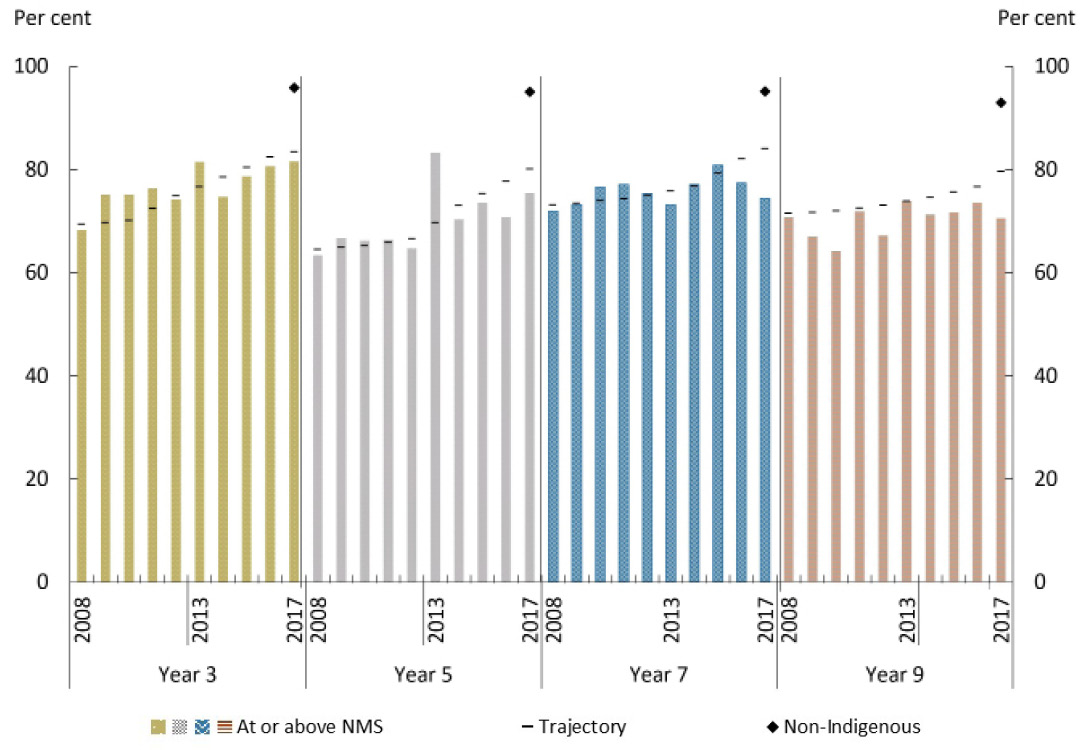
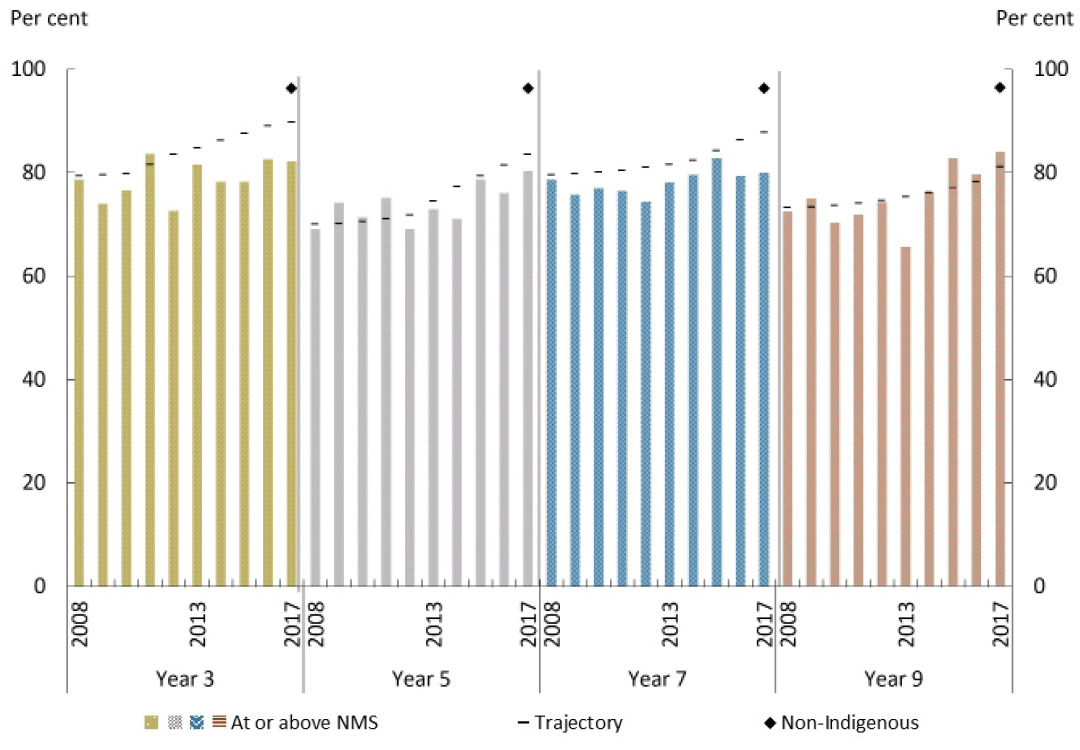
In 2017, a disproportionate share of Indigenous children remain below the national minimum standards in reading and numeracy compared to non‑Indigenous students (Figure 3.6 and Figure 3.7).
That said, gains have been made in reading and numeracy achievements for Indigenous children, narrowing the gap in outcomes with non-Indigenous children over the past nine years (Figure 3.8).
The shares of Indigenous students at or above national minimum standards were 11–13 percentage points higher (statistically significant) than the share in 2008 (the baseline), for reading in Years 3 and 5 and for numeracy in Years 5 and 9.[18] These four areas have shown the largest reduction in the gap from 2008–2017 (by around 10 percentage points each) (Figure 3.8). The shares of Indigenous students at or above national minimum standards in Year 7 reading and Years 3 and 7 numeracy also increased, by 1–4 percentage points each (not statistically significant).
A disproportionately low share of Indigenous students participate in NAPLAN. In 2017, across all eight areas less than 90% of Indigenous students participated, while participation was over 90% for non‑Indigenous students. Indigenous participation rates are lower for secondary students and students living in remote areas.
Low participation rates may skew the measurement of NAPLAN outcomes (COAG Reform Council 2012; Thompson 2013). For example, Indigenous participation in the reading test ranged from 89% in Year 3 to 75% in Year 9 — implying a quarter of Year 9 Indigenous students were not counted in the 2017 reading results.
Figure 3.6: Indigenous students at or above national minimum standards for reading
Source: Australian Curriculum, Assessment and Reporting Authority 2017, NAPLAN Results, viewed 15 January 2019, and National Indigenous Reform Agreement Performance Information Management Group, unpublished.
View the text alternative for Figure 3.6.
Figure 3.7: Indigenous students at or above national minimum standards for numeracy
Source: Australian Curriculum, Assessment and Reporting Authority 2017, NAPLAN Results, viewed 15 January 2019, and National Indigenous Reform Agreement Performance Information Management Group, unpublished.
View the text alternative for Figure 3.7.
Figure 3.8: The gap in meeting national minimum standards
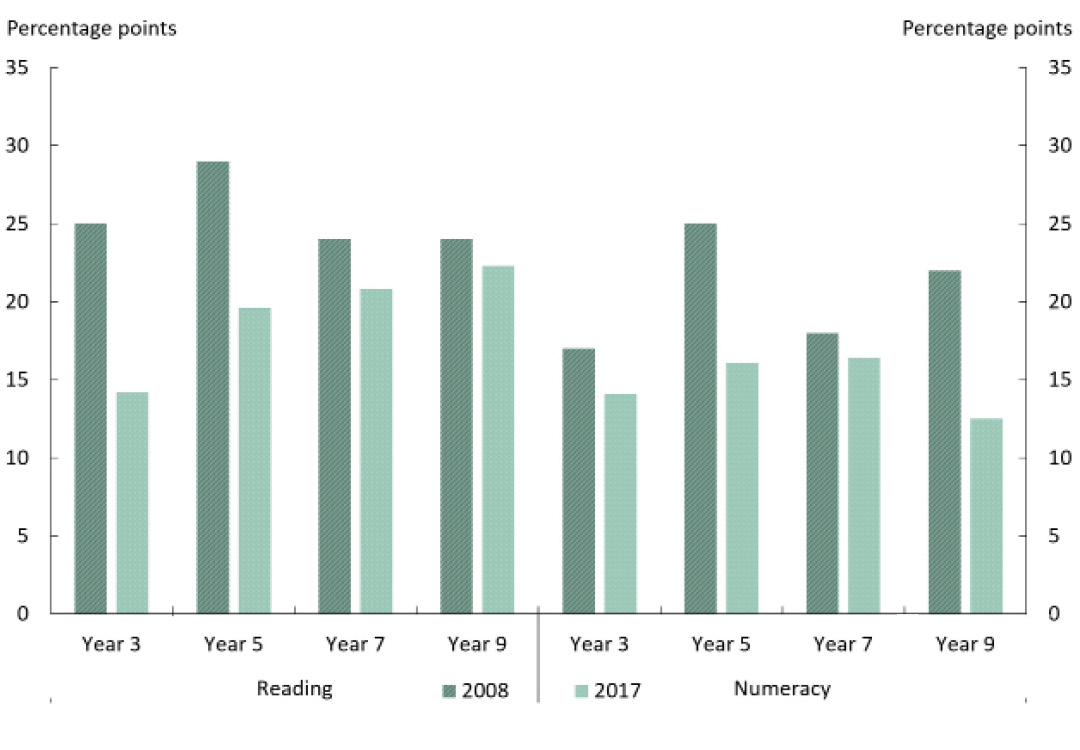
Source: Australian Curriculum, Assessment and Reporting Authority 2017, NAPLAN Results, viewed 15 January 2019.
View the text alternative for Figure 3.8.
States and territories
The gap in schooling outcomes between Indigenous and non-Indigenous students varies by state and territory.
At the jurisdictional level, the target to halve the gap in reading and numeracy outcomes was assessed across 64 result areas — that is, for each of the eight jurisdictions, across the four year levels (Years 3, 5, 7 and 9), for both reading and numeracy outcomes (Table 3.1).
Results were on track in 29 of these result areas, including Year 9 numeracy for all jurisdictions.[19]
In 2017, the Australian Capital Territory was the only jurisdiction on track across all eight areas. Tasmania was on track in all but two areas (Years 7 and 9 reading), while Victoria was on track in half of the areas. New South Wales, Western Australia and South Australia each had three areas on track. Both Queensland and the Northern Territory were only on track in Year 9 numeracy. The Northern Territory had the lowest proportion of Indigenous students at or above the national minimum standards.
Table 3.1: Reading and numeracy areas on track by jurisdictions, 2017
| NSW | VIC | QLD | SA | WA | TAS | ACT | NT | AUST | |
|---|---|---|---|---|---|---|---|---|---|
| Reading | |||||||||
| Year 3 | ✔ | ✔ | ✔ | ✔ | ✔ | ||||
| Year 5 | ✔ | ✔ | ✔ | ✔ | ✔ | ||||
| Year 7 | ✔ | ||||||||
| Year 9 | ✔ | ||||||||
| Numeracy | |||||||||
| Year 3 | ✔ | ✔ | |||||||
| Year 5 | ✔ | ✔ | ✔ | ✔ | ✔ | ||||
| Year 7 | ✔ | ✔ | |||||||
| Year 9 | ✔ | ✔ | ✔ | ✔ | ✔ | ✔ | ✔ | ✔ | ✔ |
Note:
A tick ✔ indicates results on track for the target. The target was not on track for the remaining measures.
Source: Australian Curriculum, Assessment and Reporting Authority 2017, NAPLAN results.
View the text alternative for Table 3.1.
Year 12 attainment
Halve the gap for Indigenous Australians aged 20–24 in Year 12
attainment or equivalent attainment rates (by 2020)
- As outlined in the 2018 Report, the target to halve the gap in Year 12 attainment or equivalent rate by 2020 is on track. Nationally, the gap has narrowed from 36 percentage points in 2006 to 24 percentage points in 2016.
- Indigenous Year 12 attainment rates have improved across all regions. In Major Cities, where over 40% of Indigenous 20–24 year olds live, the Year 12 attainment rate increased from 59% in 2006 to 74% in 2016.
- There has also been a marked improvement in Remote and Very Remote areas. Young Indigenous Australians living in Very Remote areas have experienced the largest gains in Year 12 attainment, with rates rising from 23% in 2006 to 43% in 2016.
What the data tells us
National
As outlined in the 2018 Report, the target to halve the gap in Year 12 attainment or equivalent by 2020 is on track. This is based on Australian Bureau of Statistics Census 2016 data released in October 2017. There are no new national data to assess progress against the target this year.
Progress against this target is measured using data on the proportion of 20–24 year old Aboriginal and Torres Strait Islander people who have completed Year 12, or obtained a Certificate level II or above qualification.
Nationally, the proportion of Indigenous 20–24 year olds who had achieved Year 12 attainment or equivalent increased from 47% in 2006 to 65% in 2016 (Figure 3.9). While the rate of non‑Indigenous Year 12 attainment or equivalent also increased over the period, the gap has reduced by around 13 percentage points over the past decade, from 36 percentage points in 2006 to 24 percentage points in 2016.
There are slight differences by gender, with young Indigenous women (aged 20–24) marginally more likely to have a Year 12 or equivalent qualification than their male counterparts, 3 percentage point difference - the same percentage point difference as in 2006. This was up from a 2 percentage point difference in 2006. By gender, the gap between Indigenous and non-Indigenous women is marginally larger (24 percentage points) than the gap between Indigenous and non-Indigenous men (23 percentage points).
Indigenous women face different challenges to Indigenous men, with childcare responsibilities being one factor related to lower participation in education for women (see Box 3.3).
Figure 3.9: Year 12 or equivalent attainment rate, Indigenous 20–24 year olds
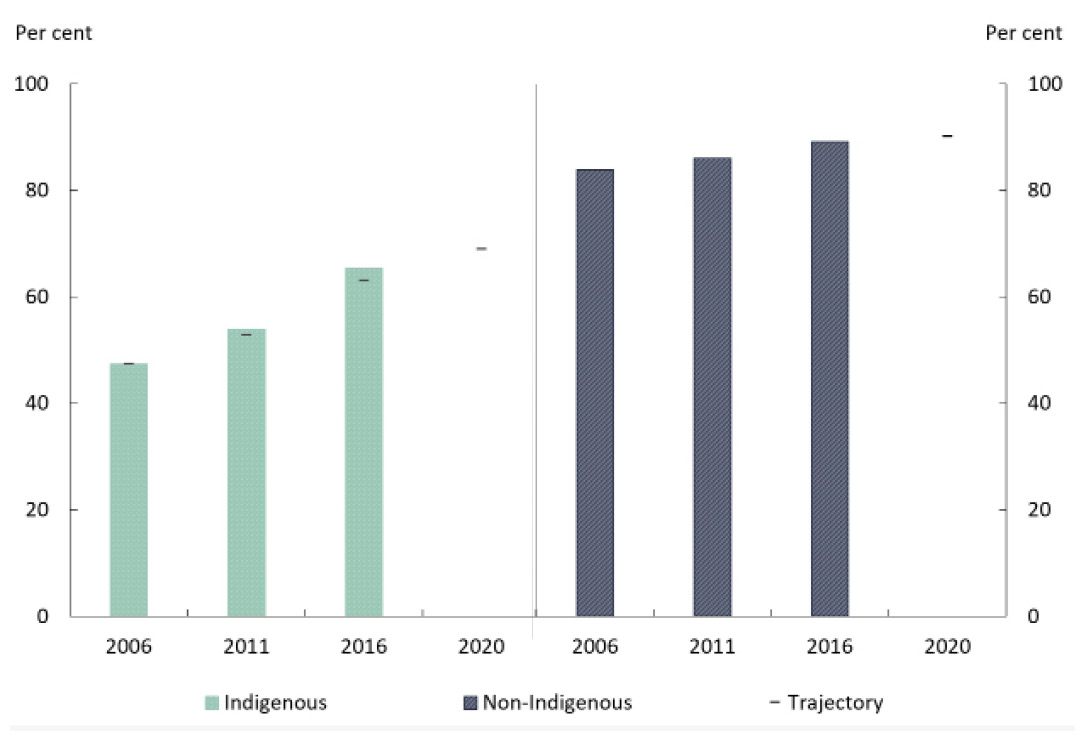
Source: Steering Committee for the Review of Government Service Provision 2018, National Agreement performance information 2017–18: National Indigenous Reform Agreement, Productivity Commission, Canberra; and National Indigenous Reform Agreement Performance Information Management Group, unpublished.
View the text alternative for Figure 3.9.
Childcare responsibilities is one driver affecting young women’s participation in education. The rate of Year 12 attainment or equivalent for Aboriginal and Torres Strait Islander 20–24 year old women without children is around 33 percentage points higher than the rate of attainment for their counterparts with children (Figure 3.10). By comparison, the corresponding gap among non‑Indigenous 20–24 year old women was 28 percentage points.
Figure 3.10: Year 12 attainment rate in 2016, by 5 year age range
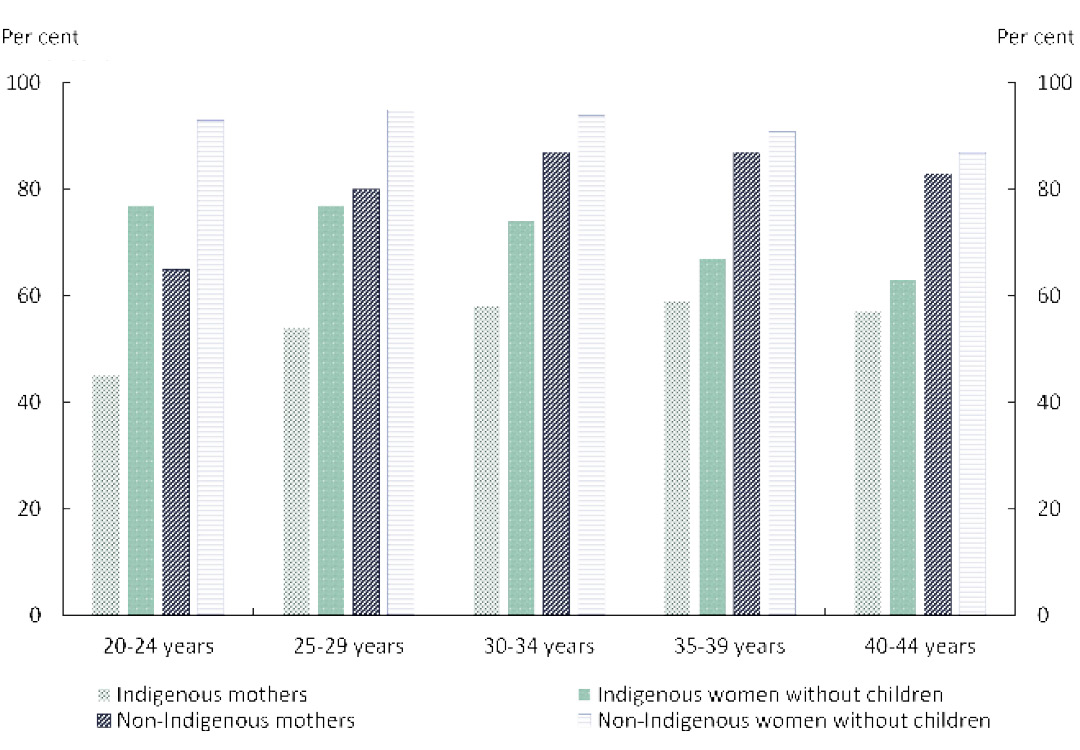
Source: Department of the Prime Minister and Cabinet analysis of Australian Bureau of Statistics 2018, 2016 Census TableBuilder Pro, Cat. No. 2037.0.30.001, Australian Bureau of Statistics, Canberra.
View the text alternative for Figure 3.10.
Notably, the difference in Year 12 or equivalent attainment between mothers and women without children was smaller, in 2016, among older age groups for both Indigenous and non-Indigenous women (Figure 3.10). For instance, the difference between Indigenous mothers and Indigenous women without children reduces from 33 percentage points at 20–24 years old to only 5 percentage points at 40–44 years old. The relatively low Year 12 attainment rates among young Indigenous mothers (aged 20–24 years) highlight the importance of initiatives to support and promote alternative pathways and entry points into education later in life.
Under the IAS, the Government provides funding for a range of activities to support Aboriginal and Torres Strait Islander women to finish school and complete further tertiary study. For instance, the Cape York Girl Academy aims to support young Indigenous mothers and their children to engage with and to complete schooling. This holistic approach includes access to VET, work experience and school-based traineeships aimed at preparing students for future employment opportunities. The Government also works closely with state and territory governments and service providers to better support young Aboriginal and Torres Strait Islander mothers, particularly those still at school.
Remoteness
Year 12 or equivalent attainment rates have increased across all remoteness categories (Figure 3.11). Rates of Indigenous Year 12 attainment or equivalent are higher in metropolitan areas, and lower in remote areas. In 2016, rates of Year 12 attainment or equivalent for Indigenous Australians ranged from 74% in Major Cities and 65% in Inner Regional areas to 43% in Very Remote areas.
Figure 3.11: Year 12 or equivalent attainment rate, by remoteness, 20–24 year olds
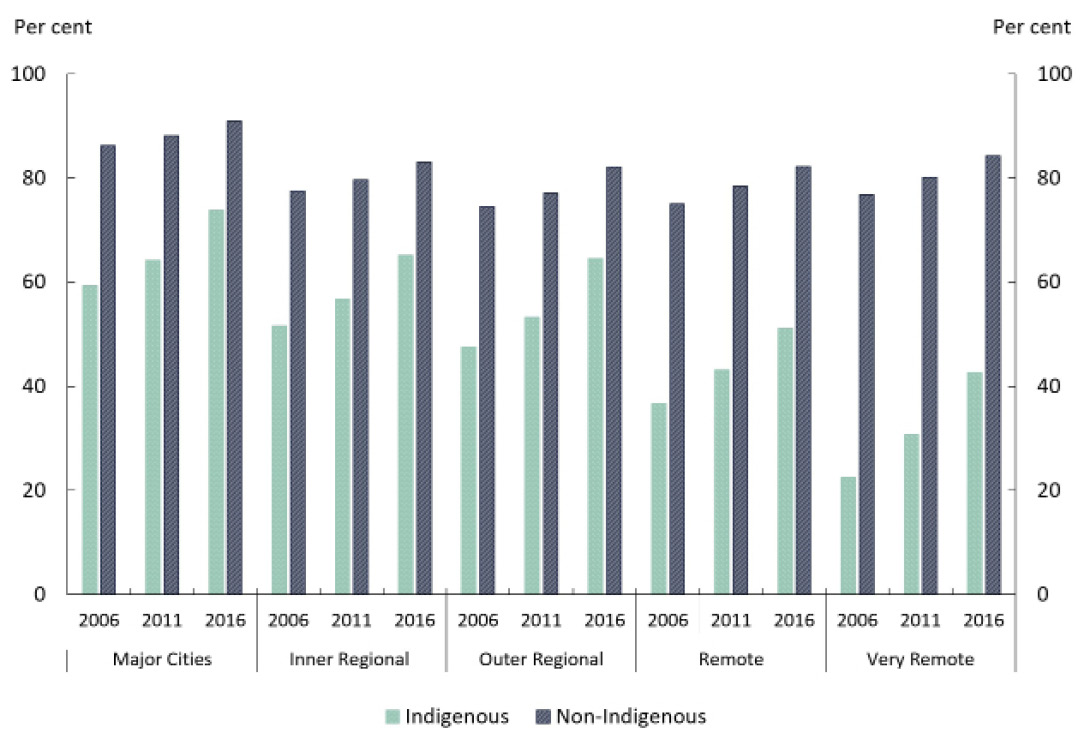
Source: Steering Committee for the Review of Government Service Provision 2018, National Agreement performance information 2017–18: National Indigenous Reform Agreement, Productivity Commission, Canberra; and Steering Committee for the Review of Government Service Provision 2013, National Agreement performance information 2012–13: National Indigenous Reform Agreement, Productivity Commission, Canberra.
View the text alternative for Figure 3.11.
The gap in Year 12 attainment or equivalent improved across all remoteness categories over the decade to 2016. A large proportion of Indigenous 20–24 year olds live in Major Cities (over 40%) where the attainment rate has increased from 59% in 2006 to 74% in 2016. This improvement has resulted in a narrowing of the gap to around 17 percentage points in 2016.
Indigenous Year 12 attainment has also increased by 17 percentage points in Outer Regional areas and 14 percentage points in Inner Regional areas between 2011 and 2016. This narrowed the gap in Year 12 attainment or equivalent to around 18 percentage points in each area.
There has also been marked increases in Year 12 attainment or equivalent between 2006 and 2016 in Remote areas and Very Remote areas. In particular, young Indigenous Australians living in Very Remote areas experienced the largest gains in Year 12 attainment or equivalent, with rates rising from 23% in 2006 to 43% in 2016.
What are the areas for further development?
The Australian Government will continue to work across agencies, with state and territory governments, experts and relevant stakeholders and Aboriginal and Torres Strait Islander Australians to improve:
- Attendance. Consistent school attendance lays a foundation for improved outcomes. Evidence also shows that the attendance gap widens by remoteness for Aboriginal and Torres Strait Islander students, with attendance rates 21.8 percentage points lower in Very Remote areas when compared to major cities (ACARA 2018).
- Literacy and Numeracy. A significant proportion of Aboriginal and Torres Strait Islander students in remote schools are English as an Additional Language or Dialect learners. A key aspect to supporting their literacy and numeracy development is the recognition of their existing language skills in local Aboriginal and Torres Strait Islander languages and supporting their language development as English learners.
- Teacher quality. Teacher quality is the most significant in-school determinant of student achievement. Further work is required to improve initial teacher education programs, and professional development of the existing educator workforce, to build overall capacity to teach Aboriginal and Torres Strait Islander students. The numbers of Aboriginal and Torres Strait Islander teachers also needs to be improved, as they are significantly underrepresented in the education workforce.
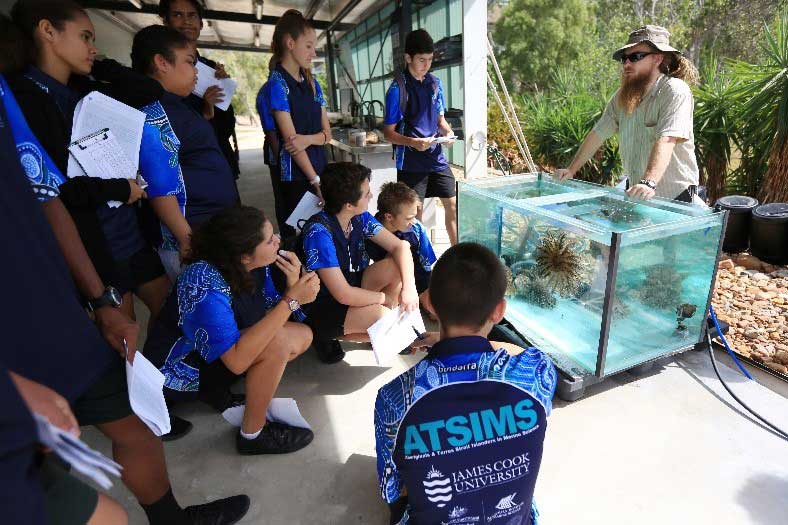
In North Queensland, the Australian Institute of Marine Science engages with Aboriginal and Torres Strait Islander high school students to bolster the interest, experience and hands-on skills needed for tertiary studies in marine science. The Aboriginal and Torres Strait Islanders in Marine Science Scholars’ Initiative brings students together in interactive workshops under the guidance of marine researchers and Aboriginal and Torres Strait Islander leaders. The program aims to foster links between western marine science and traditional ecological knowledge. Back row (left to right): Jeneke Forrest, Shane Pilot, Jakahn Von Senden, Shakira Travers, Zane Lydom. Front row (left to right): Tanieka Kyle, Samantha Icely, Jordan Hann.
Tertiary education
Government investment includes:
- Higher education support. The Government provides funding for services such as scholarships, tutorial assistance, mentoring, safe cultural spaces and other support services to assist students to enrol in and successfully complete a higher education degree.
- Tertiary education access for remote and regional students. Enabling students to remain in their communities and complete their studies by distance education supports access to education.
- Higher education for regional students. The Government supports Aboriginal and Torres Strait Islander students through regional study hubs and scholarships. The hubs provide facilities such as study spaces, video conferencing, computing facilities and internet access for university students who wish or need to remain in their local area for study, but where enrolments are not sufficient to justify a university establishing a regional campus.
- Earning a TAFE Certificate while serving Australia. Aboriginal and Torres Strait Islander people in the Australian Defence Force (ADF) receive high quality training and education including TAFE studies in literacy and numeracy, physical fitness, military training and cultural studies. On completion, they have the option of continuing with ADF careers or returning to civilian life with new workplace skills.
What the data tells us
University enrolments by Indigenous Australians have increased significantly over the past decade, possibly reflecting higher Year 12 completion rates. Data from the Department of Education and Training (2018a) show the number of Aboriginal and Torres Strait Islander students in higher education award courses has more than doubled, from 9,329 in 2007 to 19,237 in 2017. In comparison, domestic award student numbers increased by 44% over the same period. Female students make up 66% of the Indigenous cohort, compared with 58% of the total domestic student population.
There has also been a 69% increase in the number of Indigenous higher education completions between 2007 and 2017. Nonetheless, Indigenous students remain underrepresented in universities. Indigenous students comprise less than 2% of the domestic higher education student population.
What are the areas for further development?
- Improving university and VET completion rates. Efforts should aim to maintain and increase the numbers of Aboriginal and Torres Strait Islander men entering into higher education and Aboriginal and Torres Strait Islander women undertaking trade apprenticeships. Aboriginal and Torres Strait Islander women are significantly more represented at university than Aboriginal and Torres Strait Islander men while Aboriginal and Torres Strait Islander men are significantly more represented in trade apprenticeships. However, once tertiary qualifications are completed, Aboriginal and Torres Strait Islander university graduates have, on average, higher salaries than other Australian graduates in the short and medium term (Quality Indicators for Learning and Teaching 2018).
- Building the Aboriginal and Torres Strait Islander academic workforce. Around 1% of the Australian higher education workforce are Aboriginal and/or Torres Strait Islander people (DET 2018b). Greater numbers of Aboriginal and Torres Strait Islander people in the higher education workforce ensure that all Australians are able to better benefit from Aboriginal and Torres Strait Islander knowledge and perspectives. Building the Aboriginal and Torres Strait Islander higher education workforce requires development of a pipeline of students who are undertaking research degrees and progressing onto employment in the higher education sector.
Local Solutions
In Nhulunbuy, the Arnhem Land Progress Aboriginal Corporation will establish a regional study hub to support university students in Nhulunbuy Yirrkala and Gunyangara, with satellite hubs in the communities of Ramingining, Millingimbi (Yurrwi) and Galiwink’u. Similarly students from Ngukurr and Numbulwar will be supported by the hub at Wuyagiba outstation. This initiative provides access to tertiary studies for remote students in a supportive environment.
[17] The target as originally agreed also included writing results. However, due to a change in the test from narrative writing to persuasive writing, the writing results from 2011 onwards are not comparable with results from previous years, and so have been excluded.
[18] Statistical significance is reported for changes in the proportion of students at or above national minimum standards. However, statistical significance is not reported for changes in the gap between Indigenous and non-Indigenous outcomes.
[19] Results are found to be on track based on confidence intervals. The Northern Territory and the Australian Capital Territory have the largest confidence intervals. For example, in the Australian Capital Territory in 2017, the results for seven of the eight areas were under the trajectory points, but were still consistent with the trajectories due to their large confidence intervals.