'We recognise that the social, emotional, spiritual and cultural wellbeing of the whole community is paramount in determining the health and wellbeing of individual members. The holistic nature of our knowledge and cultures locates health in culture, community and kinship networks.' Janine Mohamed, CEO, Congress of Aboriginal and Torres Strait Islander Nurses and Midwives.
Introduction
Access to health services is a fundamental right for all Australians. Aboriginal and Torres Strait Islander people have a right to be healthy, well and safe.
Healthy lives rely on complex, multi-sector, whole-of-government approaches. Income, employment, education, culture and community safety have a significant impact on health.
Improvements in Aboriginal and Torres Strait Islander peoples’ health requires an integrated approach which includes strengthening community functioning, reinforcing positive behaviours, improving economic participation, developing regional economies, housing and environmental health, gender-specific strategies and spiritual healing.
The Australian Government leads the delivery of primary health care, the Medicare Benefits Scheme, the Pharmaceutical Benefits Scheme, and funding for Indigenous health through the Indigenous Australians Health Programme. State and territory governments are responsible for the provision of acute care services.
The Australian Government also has specific initiatives that focus on key areas for improving the health and wellbeing of Aboriginal and Torres Strait Islander peoples including mental health programs, social and emotional wellbeing supports for members of the Stolen Generation and their families, alcohol and other drug treatment services and the rollout of low aromatic fuel.
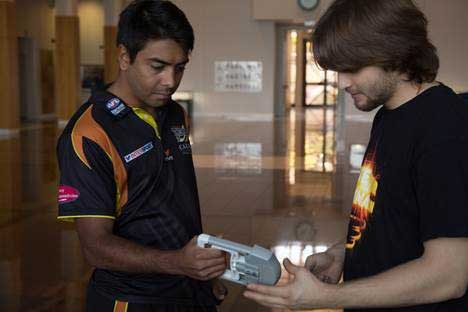
HealthLAB is a mobile health education clinic that focuses on youth and Indigenous communities with the aim of providing education about positive lifestyle choices. A National Science Week grant supported travel around the Northern Territory from Darwin to the Tiwi Islands, and across to Nhulunbuy and the East Arnhem Land community of Yirrkala. Here, NT Thunder captain Shannon Rioli tests it out at the official launch of Health Lab during National Science Week (image credit: National Science Week).
Life expectancy
Close the life expectancy gap within a generation (by 2031)
- The target to close the gap in life expectancy by 2031 is not on track.
- Between 2010–12 and 2015–17, Indigenous life expectancy at birth has improved by 2.5 years for Indigenous males and by 1.9 years for Indigenous females (both not statistically significant), which has led to a small reduction in the gap.
- Large gaps remain between Indigenous and non-Indigenous life expectancy estimates.
- Indigenous life expectancy estimates reduce with increasing remoteness while non-Indigenous life expectancy estimates are similar across remoteness areas, resulting in particularly marked gaps in life expectancy estimates in Remote and Very Remote areas.
- There have been significant[24] reductions in the Indigenous mortality rate from chronic diseases, particularly from circulatory diseases since 1998. However, Indigenous mortality rates from cancer are rising and the gap in cancer mortality rates is widening.
What the data tells us
National
The target to close the gap in life expectancy by 2031 is not on track.
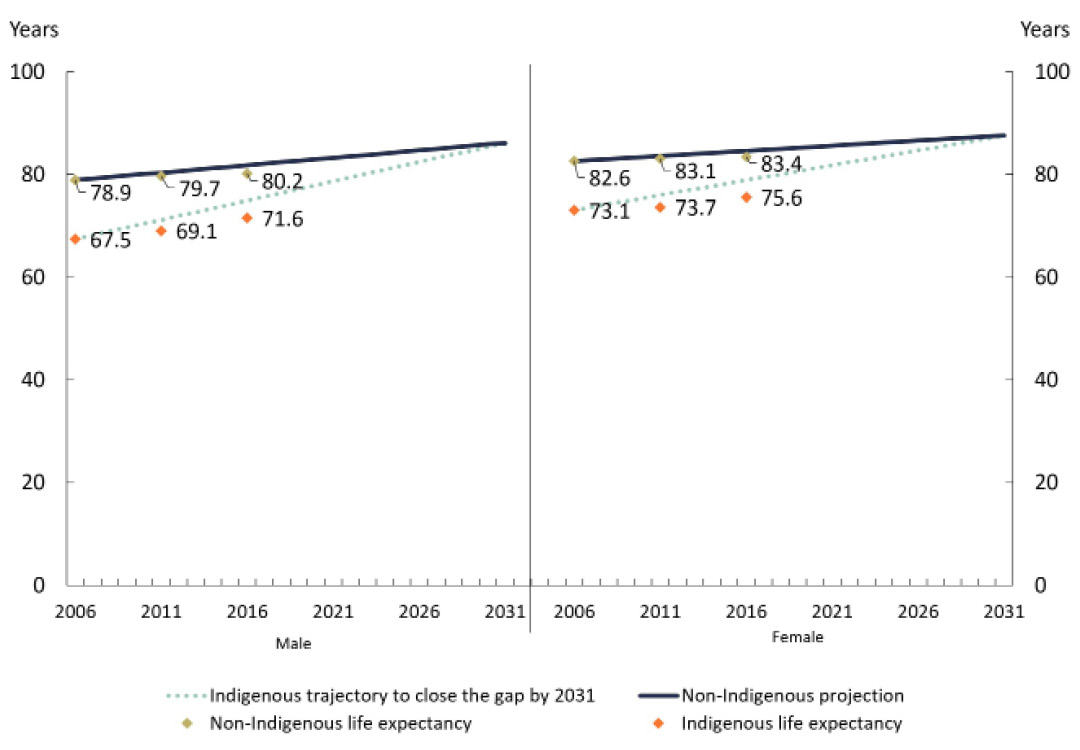
The target is measured by estimates of life expectancy at birth, which are available every five years.[25] According to the latest ABS estimates, Indigenous males born between 2015 and 2017 have a life expectancy of 71.6 years (8.6 years less than non-Indigenous males) and Indigenous females have a life expectancy of 75.6 years (7.8 years less than non-Indigenous females) (Table 6.1). Between 2010–12 and 2015–17, Indigenous life expectancy at birth has improved by 2.5 years for Indigenous males and by 1.9 years for Indigenous females (both not statistically significant), which has led to a small reduction in the gap.
Indigenous life expectancy has been growing at a faster rate than for non-Indigenous Australians, and the rate of increase in Indigenous life expectancy has also increased over the recent five year period (2010–12 to 2015–17) compared to the previous five year period. The annual increase in life expectancy for Indigenous males was 0.5 years between 2010–12 and 2015–17 compared with 0.3 years between 2005–07 and 2010–12. The annual increase for Indigenous females was 0.4 years between 2010–12 and 2015–17 compared with 0.1 years between 2005–07 and 2010–12.
While these improvements are welcome, they are not sufficient to meet the life expectancy target of closing the gap by 2031. According to the Indigenous life expectancy trajectory, the annual rate of increase required was about 0.75 year for males and about 0.58 for females (Figure 6.1).
The improvement in Indigenous life expectancy and the reduction in the gap between 2010–12 and 2015–17 should be interpreted with considerable caution as the population composition has also changed between the 2011 and 2016 Censuses (ABS 2018b).[26] More detailed analyses of variations in life expectancy estimates across geographical areas provide insights into life expectancy gains (Box 6.1).
Table 6.1: Life expectancy at birth, by Indigenous status, 2005–07 to 2015–17
| Indigenous | Non-Indigenous | Gap (years)[a] | ||||
|---|---|---|---|---|---|---|
| Males | Females | Males | Females | Males | Females | |
| Life expectancy at birth estimates | ||||||
| 2005-2007[b] | 67.5 | 73.1 | 78.9 | 82.6 | 11.4 | 9.6 |
| 2010-2012 | 69.1 | 73.7 | 79.7 | 83.1 | 10.6 | 9.5 |
| 2015-2017 | 71.6 | 75.6 | 80.2 | 83.4 | 8.6 | 7.8 |
| Improvements in life expectancy at birth | ||||||
| Changes over last 5 years (2010-12 to 2015-17) | 2.5[c] | 1.9[c] | 0.5 | 0.3 | -2.0 | -1.7 |
| Changes over last 10 years (2005-07 to 2015-17) | 4.1[d] | 2.5[d] | 1.3 | 0.8 | -2.8 | -1.8 |
Note:
(a) Based on unrounded estimates.
(b) Revised estimates, published with the 2010–12 life expectancy estimates.
(c) Changes are not statistically significant.
(d) Statistical significance of the changes cannot be calculated as confidence intervals could not be produced for the revised 2005–07 estimates.
Source: Australian Bureau of Statistics 2018, Life tables for Aboriginal and Torres Strait Islander Australians, 2015–2017. Australian Bureau of Statistics Cat. No. 3302.0.55.003. Canberra; and ABS 2013, Life tables for Aboriginal and Torres Strait Islander Australians, 2010–2012. Australian Bureau of Statistics cat. no. 3302.0.55.003. Canberra.
View the text alternative for Table 6.1.
Figure 6.1: Life expectancy at birth estimates
Source: Australian Bureau of Statistics 2018, Life tables for Aboriginal and Torres Strait Islander Australians, 2015–2017, Cat. No. 3302.0.55.003, Australian Bureau of Statistics, Canberra; Australian Bureau of Statistics 2013, Life Tables for Aboriginal and Torres Strait Islander Australians, 2010–2012, Cat. No. 3302.0.55.003, Australian Bureau of Statistics, Canberra; and National Indigenous Reform Agreement Performance Information Management Group, unpublished.
View the text alternative for Figure 6.1.
States and territories[27]
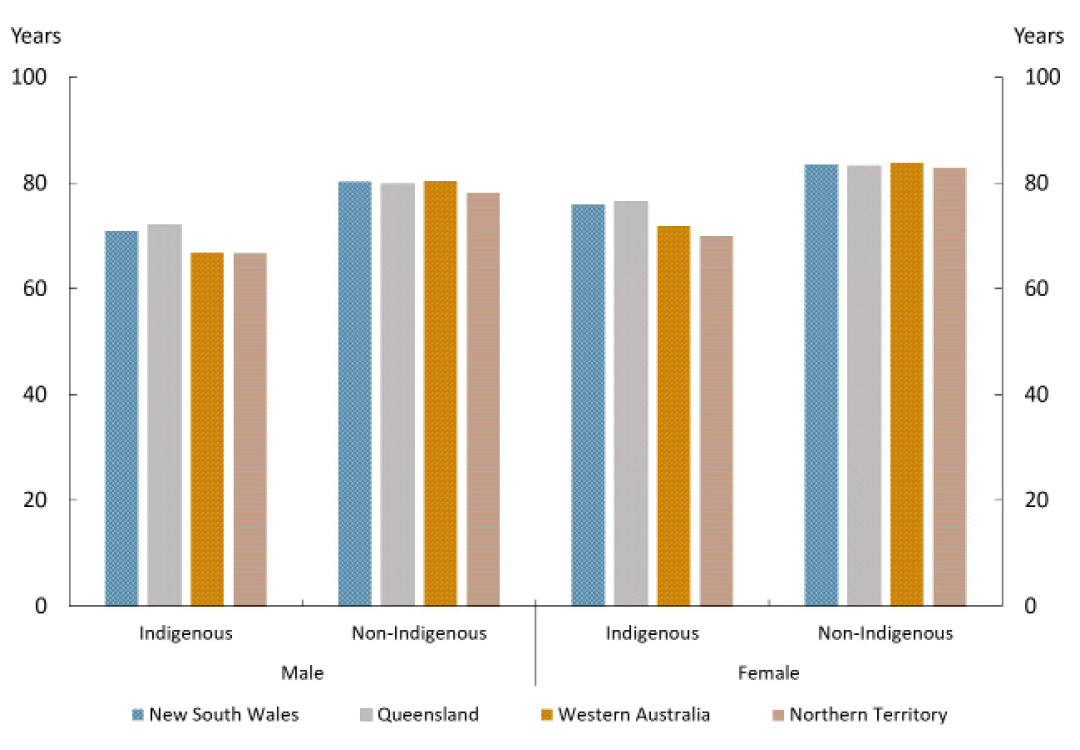
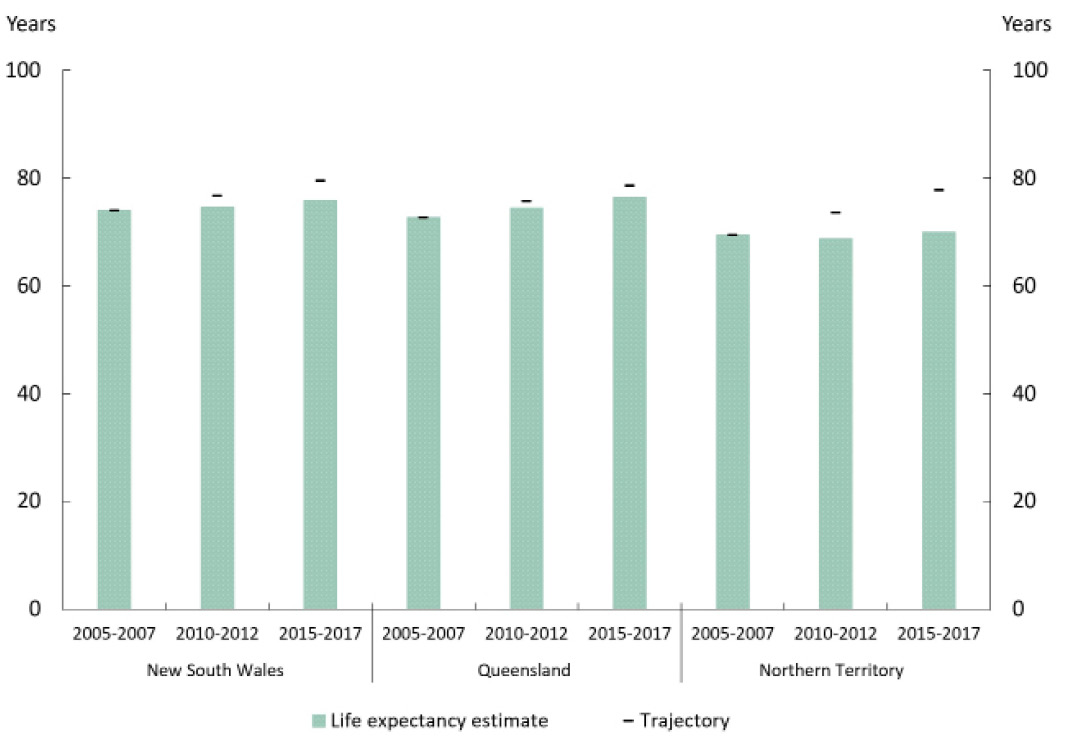
Indigenous life expectancy was highest in Queensland (72.0 years for males, 76.4 years for females) and lowest in the Northern Territory (66.6 years for males, 69.9 years for females) (Figure 6.2).
The gap in life expectancy was the largest for males in Western Australia (13.4 years) and for females in the Northern Territory (12.8 years).
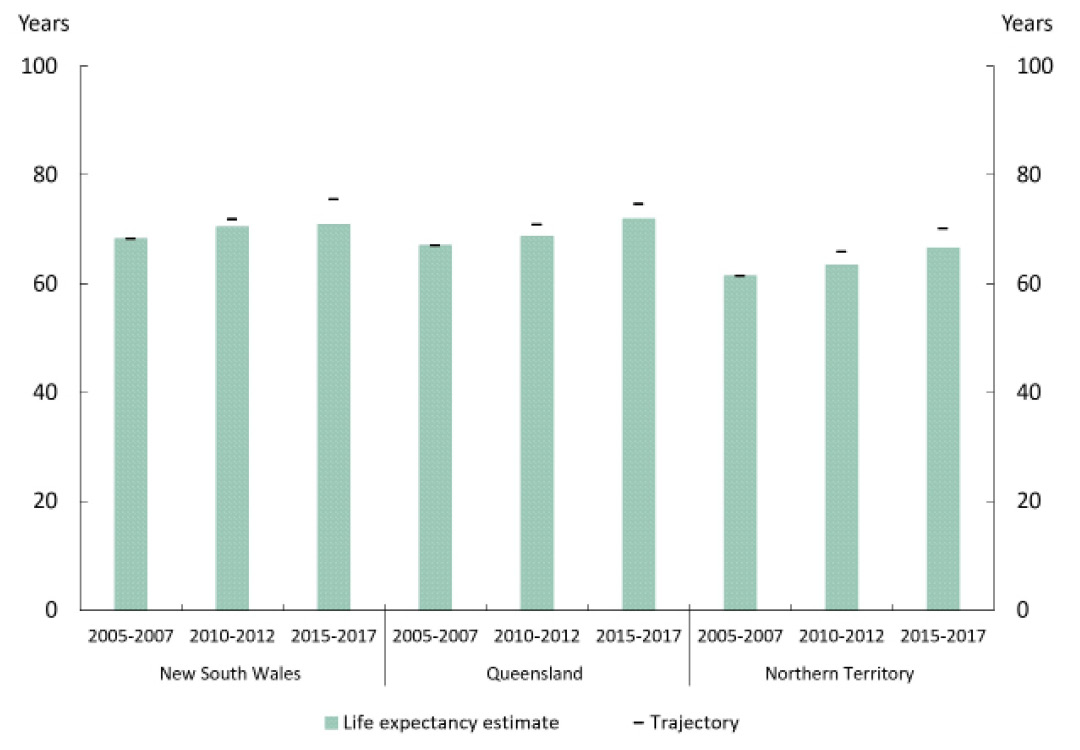
During the five-year period from 2010–12 to 2015–17, the largest improvement in life expectancy was in Queensland (3.3 years for males and 2.0 years for females), and the lowest improvement was in New South Wales (0.4 years for males and 1.3 years for females). The Indigenous life expectancy increase for Queensland males was the only statistically significant increase.
Figure 6.2: Life expectancy at birth by Indigenous status by jurisdiction, 2015–17
Source: Australian Bureau of Statistics 2018, Life tables for Aboriginal and Torres Strait Islander Australians, 2015–2017, Cat. No. 3302.0.55.003, Australian Bureau of Statistics, Canberra.
View the text alternative for Figure 6.2.
Of the three jurisdictions with agreed trajectories for the life expectancy target, none had life expectancy results on track to meet the target (Figure 6.3 and Figure 6.4).[28]
Figure 6.3: Life expectancy at birth – Indigenous males
Source: Australian Bureau of Statistics 2018, Life tables for Aboriginal and Torres Strait Islander Australians, 2015–2017, Cat. No. 3302.0.55.003, Australian Bureau of Statistics, Canberra; Australian Bureau of Statistics 2013, Life Tables for Aboriginal and Torres Strait Islander Australians, 2010–2012, Cat. No. 3302.0.55.003, Australian Bureau of Statistics, Canberra; and National Indigenous Reform Agreement Performance Information Management Group, unpublished.
View the text alternative for Figure 6.3.
Figure 6.4: Life expectancy at birth – Indigenous females
Source: Australian Bureau of Statistics 2018, Life tables for Aboriginal and Torres Strait Islander Australians, 2015–2017, Cat. No. 3302.0.55.003, Australian Bureau of Statistics, Canberra; Australian Bureau of Statistics 2013, Life Tables for Aboriginal and Torres Strait Islander Australians, 2010–2012, Cat. No. 3302.0.55.003, Australian Bureau of Statistics, Canberra; and National Indigenous Reform Agreement Performance Information Management Group, unpublished.
View the text alternative for Figure 6.4.
National estimates may mask variations in life expectancy estimates for different groups in the community. More disaggregated analyses can provide insights for some groups.
Life expectancy for Indigenous Australians living in Remote and Very Remote areas was lower than those living in Major Cities: 6.2 years lower for males and 6.9 years lower for females. Life expectancy for non-Indigenous Australians did not vary much across remoteness areas, with Inner and Outer Regional areas slightly lower than Remote and Very Remote areas and Major Cities. The gap between Indigenous and non-Indigenous life expectancies was most marked in Remote and Very Remote areas, with the gap being 13.8 years for males and 14.0 years for females. However, while this indicates a social gradient for Indigenous life expectancy by remoteness, it is important to note the highest Indigenous life expectancy in Major Cities (72.1 years for males and 76.5 for females) was still lower than the lowest life expectancy of non-Indigenous Australians which occurs in Inner and Outer Regional areas (79.1 for males and 82.8 for females) (Figure 6.5).
There is also a gradient when looking at socio-economic status. Indigenous Australians living in the most disadvantaged areas had about four years lower life expectancy than those living in the least disadvantaged areas. For Indigenous males, life expectancy varied from 68.2 years for the most disadvantaged areas to 72.4 in the least disadvantaged areas, and for females, it varied from 72.8 years in the most disadvantaged to 76.6 in the least disadvantaged areas. Non-Indigenous life expectancies had similar variations across socio-economic disadvantaged areas. However, Indigenous life expectancy was still lower in the least disadvantaged areas compared with non-Indigenous Australians in the most disadvantaged areas (77.9 for males and 82.0 for females) (Figure 6.6).
Figure 6.5: Life expectancy at birth by remoteness
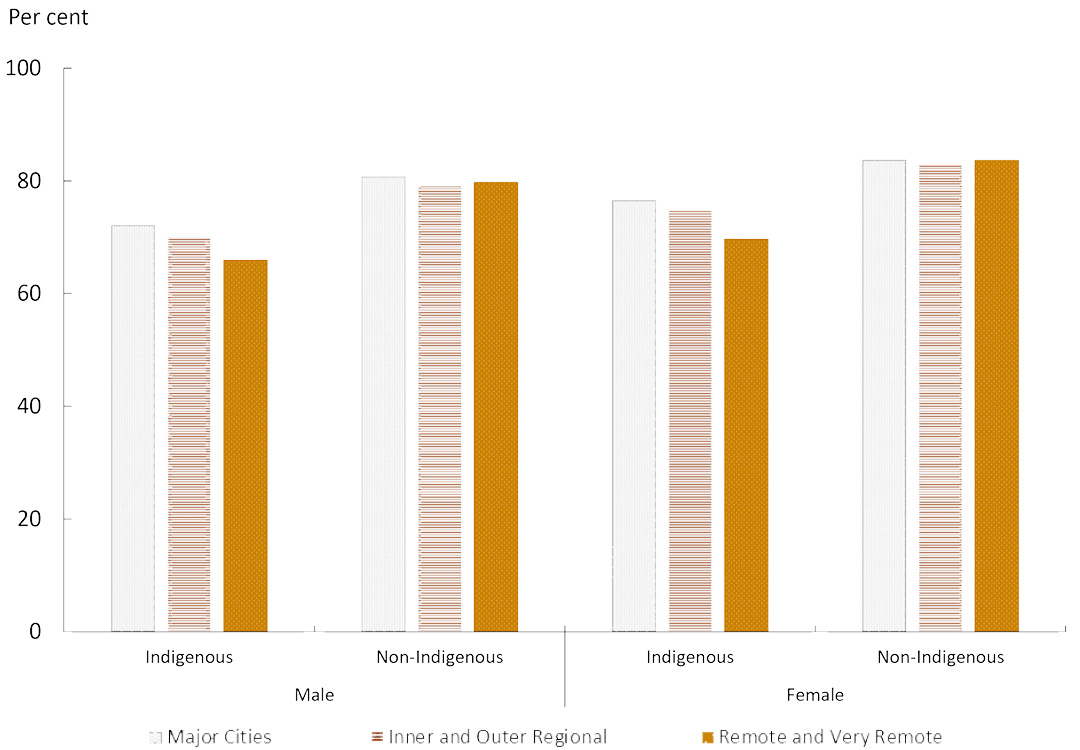
Source: Australian Bureau of Statistics 2018, Life tables for Aboriginal and Torres Strait Islander Australians, 2015–2017, Cat. No. 3302.0.55.003, Australian Bureau of Statistics, Canberra.
View the text alternative for Figure 6.5.
Figure 6.6: Life expectancy at birth by SEIFA
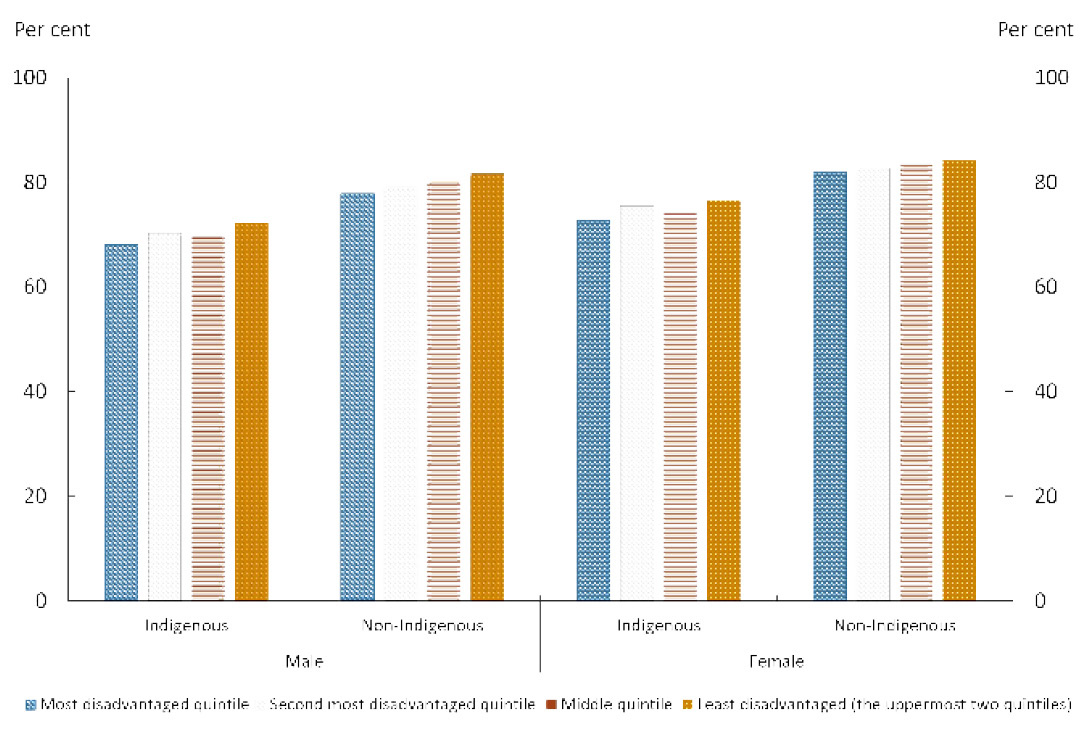
Source: Australian Bureau of Statistics 2018, Life tables for Aboriginal and Torres Strait Islander Australians, 2015–2017, Cat. No. 3302.0.55.003. Australian Bureau of Statistics, Canberra.
View the text alternative for Figure 6.6.
Mortality
While official Indigenous life expectancy estimates are only available every five years, mortality data are collected annually, allowing the tracking of progress for this target on an annual basis.
In 2017, there were 2,988 deaths of Aboriginal and Torres Strait Islander people (1,631 males and 1,357 females), at the rate of 976 per 100,000 persons.[29] This was 1.8 times the non-Indigenous rate (556 per 100,000) in 2017.
Over the long term (1998–2017), the overall Indigenous mortality rate has declined significantly, by 14%.[30] Non-Indigenous mortality rates have also declined over this period, and the gap has narrowed by about 8% (not statistically significant). Despite these long-term declines, there has been no significant change in the Indigenous mortality rate between the 2006 baseline and 2017.
Leading causes of Indigenous mortality
In the period 2013–17, the five leading causes of Indigenous mortality were circulatory diseases (23%), cancer and other neoplasms (22%), external causes (15%), respiratory diseases (9%) and endocrine disorders (mainly diabetes) (9%). These diseases have remained the leading causes of Indigenous death for decades although the relative contribution of diseases has changed. Between 2003–07[31] and 2013–17, the relative share of circulatory diseases has reduced from 27% to 23%, whereas the share of cancer has increased from 18% to 22% with the contribution of the other three diseases remaining similar over this time.
The non-communicable chronic diseases account for more than half the deaths of Indigenous Australians, and are also responsible for the majority of the gap in mortality rates between Indigenous and non-Indigenous Australians. In the period 2013–17, circulatory diseases contributed 22% of the gap in mortality rates, and cancer contributed 16%. While external causes accounted for 15% of Indigenous deaths, they contributed only 11% to the gap. In contrast, diabetes, which caused 8% of Indigenous deaths, contributed 16% to the gap, and respiratory diseases, which account for 9% of deaths, contributed 14% of the gap.
Over the long run, there has been a significant decline in the Indigenous chronic disease mortality rate. Between 1998 and 2017, the Indigenous chronic disease mortality rate decreased significantly by 19%, from 951 per 100,000 in 1998 to 745 per 100,000 in 2017. In the shorter run too, between 2006 and 2017, the Indigenous chronic disease mortality rate decreased significantly by almost 7%, from 826 per 100,000 in 2006 to 745 per 100,000 in 2017. However, the non-Indigenous chronic disease mortality rate has declined at a faster rate, and there has been no significant change in the gap in chronic disease mortality rates between Indigenous and non-Indigenous Australians.
The decrease in Indigenous chronic disease mortality rates has largely been driven by the decline in mortality rates from circulatory diseases. Indigenous mortality rates from circulatory diseases reduced by 47% between 1998 and 2017. Since the 2006 baseline also, there has been a significant decrease of 26% in Indigenous circulatory disease mortality rates. Indigenous mortality rates from respiratory diseases (14%) and diabetes (11%) have also declined (although not statistically significant) since 1998. However, cancer mortality rates are rising for Indigenous Australians. Between 1998 and 2017, there has been a significant increase by 25% in the Indigenous cancer mortality rate (Figure 6.7). In 2017, for the first time, the cancer mortality rate for Indigenous Australians was larger than for circulatory diseases (240 per 100,000 compared with 229 per 100,000). Although the data are sometimes volatile year on year, this shift is consistent with the trend.
Figure 6.7: Trends in Indigenous mortality rates of leading chronic diseases
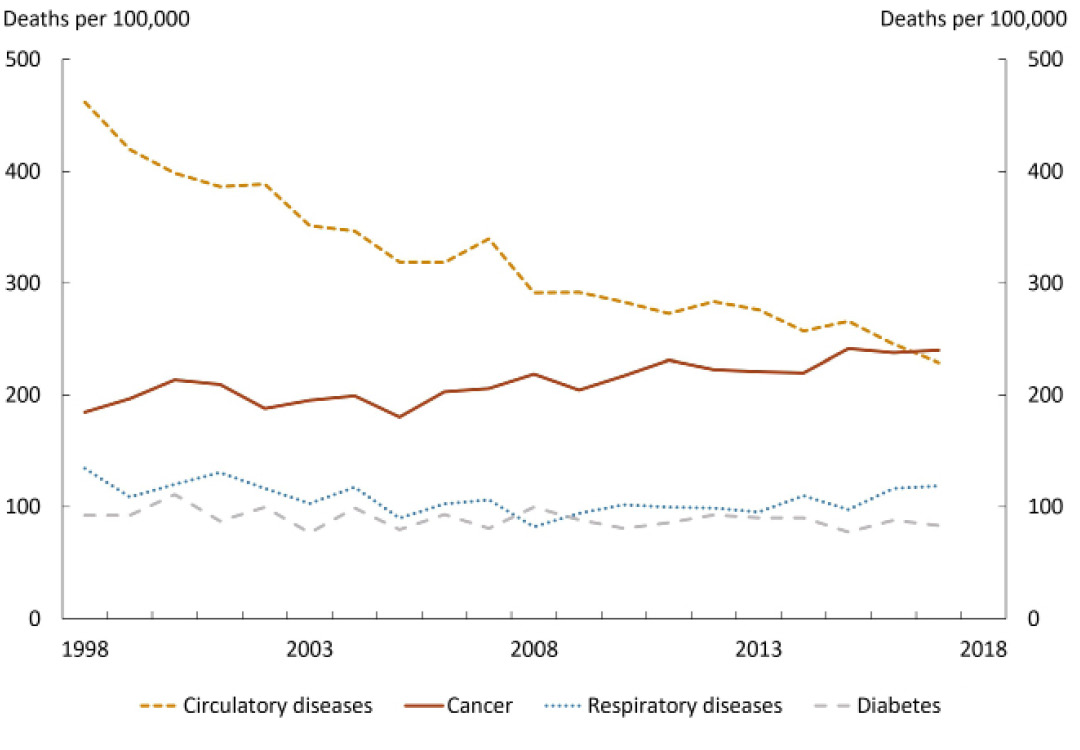
Source: Australian Bureau of Statistics and Australian Institute of Health and Welfare 2018 analysis of National Mortality Database, unpublished.
View the text alternative for Figure 6.7.
Several of these non-communicable chronic diseases have common preventable risk factors, such as a lack of physical exercise, alcohol consumption, smoking and poor nutrition. For example, smoking, and tobacco use, is the leading contributor to cancer, respiratory and circulatory diseases (mainly the cardiovascular diseases), and accounted for 12% of the total Indigenous disease burden in 2011 (AIHW 2016).
There has been some progress in controlling prevalence of these risk factors. Smoking prevalence for Indigenous Australians (aged 15 years and over) has declined significantly from 51% to 42% between 2002 and 2014–15. The rate of drinking alcohol at lifetime risky levels has also declined from 19% to 15%, between 2008 and 2014–15, among Indigenous Australians (aged 15 and over) (AHMAC 2017). However, while some health effects of the positive changes in risk factor prevalence may be immediate, there is a long lag between changes in risk behaviours and the full impact upon mortality outcomes. For example, the long latent period for lung cancer which can be up to 30 years, means that, despite falls in smoking rates, smoking related deaths may continue to rise over the next decade, before peaking (Lovett, Thurber & Maddox 2017).
Continued focus on reducing prevalence of health risk factors, improving health literacy and social determinants of health, together with improving access to medical care especially early detection and management of chronic disease is critical to reduce the Indigenous chronic disease mortality rate and, in turn, the life expectancy gap.
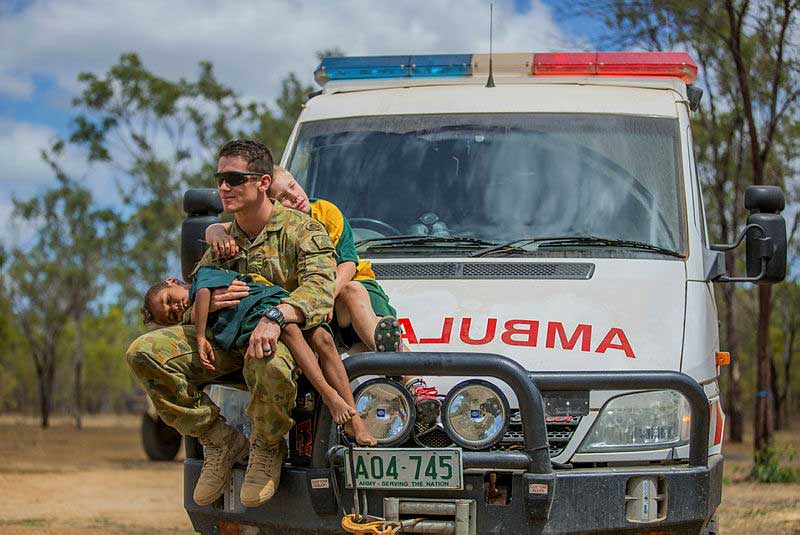
The Australian Army works with the remote community of Laura, Queensland to deliver complementary health services.
Translating policy into action
The Australian Government is working with state and territory governments to improve health outcomes, with a priority focus on Aboriginal and Torres Strait Islander Australians.
The Australian Government contribution includes support for:
- Providing culturally appropriate primary care. For most people, primary care is the first and main contact with the health system, and the gateway to specialist, allied and other health services. More than 160 organisations (including around 130 Aboriginal Community Controlled Health Services) are funded through the Indigenous Australians’ Health Programme to provide comprehensive primary health care.
- Promoting eye health. Vision impairment and blindness is three times higher for Aboriginal and Torres Strait Islander people than non-Indigenous Australians. A total of $34.2 million is being provided from 2018–19 to 2021–22 to improve eye health.
- Helping kids hear well. Ear disease is highly prevalent in Aboriginal and Torres Strait Islander children and repeated episodes can lead to hearing loss if not treated early. A total of $95.3 million is being provided from 2018–19 to 2021–22 to improve ear and hearing health for Aboriginal and Torres Strait Islander people.
- Promoting culturally appropriate and trauma-informed health care. Ensuring health services are culturally safe and trauma-informed is a key aspect of access to health care for Aboriginal and Torres Strait Islander people. Major steps towards better access include supporting Aboriginal and Torres Strait Islander health professional organisations, increasing the cultural competence of our next generation of GPs and allied health providers, and developing the Indigenous health workforce.
- Fighting cancer. First Australians have a higher incidence of fatal, screen-detectable and preventable cancers and are diagnosed at more advanced stages, and often with more complex comorbidities. Through Cancer Australia, the Australian Government is developing monitoring frameworks, optimal care pathways, national leadership and health promotion. The Australian Government, working jointly with state and territory governments, delivers screening programs to detect breast, cervical and bowel cancer. Specialised programs such as the National Indigenous Bowel Screening Pilot Project aim to increase Aboriginal and Torres Strait Islander screening rates.
- Tackling chronic disease. Chronic diseases were responsible for 64% of the total disease burden (fatal and non-fatal) for Indigenous Australians, and 70% of the gap in 2011 (AIHW 2016). The Australian Government provides a range of measures to support Aboriginal and Torres Strait Islanders living with chronic disease, from subsidising medications for more than 300,000 patients to improving access to coordinated and multidisciplinary care through Primary Health Networks.
- Supporting good mental health. Primary Health Networks commission mental health services for Aboriginal and Torres Strait Islander people that are joined up, culturally appropriate and safe, and designed to holistically meet mental health needs at the local level. These services complement and link with other activities such as social and emotional wellbeing services, headspace, suicide prevention approaches, and alcohol and other drug services. These services can put people on a different path, a path where they are able to make different choices about their lives, where they are making positive decisions for their future.
- Supporting members of the Stolen Generations to reconnect with families and heal the impact of trauma. Services provide community based healing initiatives, social and emotional wellbeing support services and support for family reunions. This includes the work of The Healing Foundation.
- Improved nutrition in remote communities. More than 100 licensed stores operate under the Northern Territory Community Stores Licensing Scheme, making healthy food and drinks more accessible for local residents. The Commonwealth-owned company, Outback Stores, manages 37 remote community stores on a fee for service basis across the Northern Territory, Western Australia and South Australia. In 2017–18 Outback Stores-managed stores sold 430 tonnes of fresh fruit and vegetables, and created 402 Aboriginal and Torres Strait Islander jobs in communities. Through store-based sugar reduction strategies, there were 7.6 tonnes less sugar consumed from sugary drinks in these communities.
- Providing sport and recreation activities for young people. As at 31 December 2018, $24.2 million had been committed to sport and recreation activities to improve wellbeing and resilience, improve educational attendance and attainment, engage youth, and provide employment and training opportunities.
- Enabling older people to stay close to home and community in remote and very remote areas. As of 1 January 2018, there are 35 aged care services funded to deliver 860 aged care places, including residential and home care, with funding for more than 900 aged care places for Aboriginal and Torres Strait Islander people in the next four years.
- Improving housing affordability and supply. Aboriginal and Torres Strait Islander households are less likely to own their house and almost three times as likely to experience some amount of overcrowding compared to other households. The National Housing and Homelessness Agreement provides $1.5 billion per annum to support state and territory governments in the delivery of housing and homelessness services, including social and affordable housing, and support for young people at risk of homelessness. In addition, the Australian Government provides support to the National Housing Finance and Investment Corporation, an organisation with a mandate to improve housing outcomes by reducing pressure on housing affordability.
- Supporting Indigenous people with disability. Aboriginal and Torres Strait Islander people are at greater risk of disability. The Australian Government provides support for Aboriginal and Torres Strait Islander organisations to build awareness, provide peer support, links and referrals, and assist mainstream organisations to become more culturally competent.
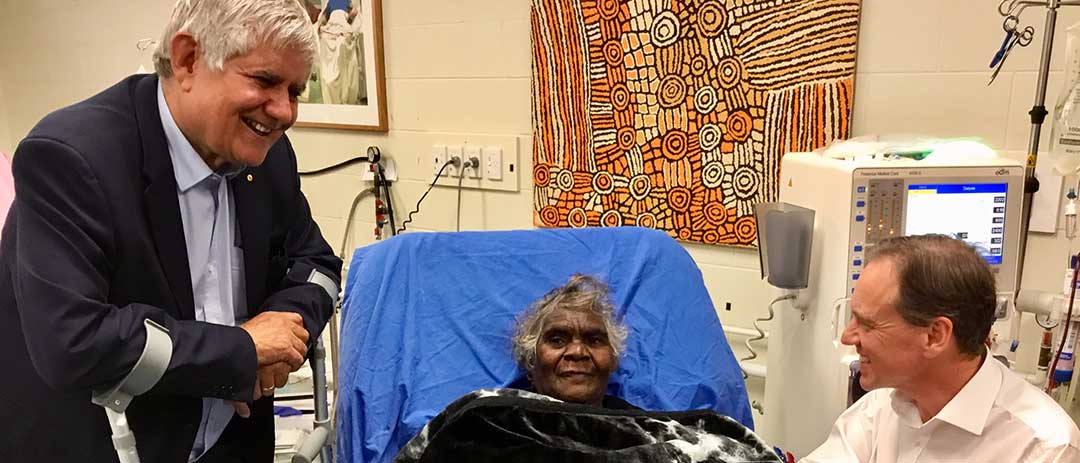
Minister for Indigenous Health and Ageing, Ken Wyatt AM and Minister for Health, Greg Hunt, sharing time with Marilyn Nangala and announcing a $25 million boost for the service, after receiving a heartfelt letter from the Purple House Director.
What are the areas for further development?
The Australian Government will continue to work across agencies, with state and territory governments, experts and other stakeholders and Aboriginal and Torres Strait Islander Australians and their representatives to deliver the next iteration of the Implementation Plan for the National Aboriginal and Torres Strait Islander Health Plan 2013–23 so that it aligns with the refreshed Closing the Gap agenda. This includes:
- Strengthening approaches to the social determinants and cultural determinants of health by transforming the findings of the My Life, My Lead report into action. The My Life My Lead report highlights the impact of social determinants, such as housing, education, employment, and interactions with the justice system, on health outcomes for Aboriginal and Torres Strait Islander people. At least 34.4% of the gap in health outcomes can be attributed to social determinants (AHMAC 2017). The My Life My Lead report also highlights the positive role culture plays in supporting good health.
- Further improving hearing health through a Hearing Health Roadmap for all Australians. In addition, all jurisdictions have agreed to explore a national approach to reducing the burden of middle ear disease through the National Aboriginal and Torres Strait Islander Health Standing Committee.
Local Solutions
In Port Pirie, Country Health SA Local Health Network hosted a Tarpari Wellbeing Day in April 2018. With a theme of “looking forward - new beginnings”, the event focused on Aboriginal health, culture and reconciliation and recognised that working together will bring a more inclusive and healthy future.
In Port Lincoln, the Port Lincoln Aboriginal Health Service has established the Chronic Condition Self-Management Team that provides coordinated case management of chronic illness through Health Assessments for chronically ill clients over 55 years. Recognising the impact of chronic disease on life expectancy, dedicated staff including a GP have been allocated to provide clinical services to close the gap in chronic disease.
[24] Throughout this chapter, the word significant is used to denote statistical significance. It has not been used in any other sense.
[25] The Australian Bureau of Statistics (ABS) publishes life tables and calculates life expectancy for the Australian population and by Indigenous status. These measures are based on three years of data (for example, 2015–17) to reduce the effect of variations in death rates from year to year. Updated estimates of Aboriginal and Torres Strait Islander life expectancy were published by the ABS in November 2018.
[26] According to the ABS analysis, part of the change in Indigenous population composition between 2011 and 2016 Censuses (about 21%) cannot be explained by demographic factors. Rather it can be attributed to changing propensities to identify and methodological improvements in coverage and response rates in the Census (more details are available from ABS 2018b).
[27] Life expectancy estimates are produced for New South Wales, Queensland, Western Australia and the Northern Territory only. Due to the small number of Indigenous deaths in Victoria, South Australia, Tasmania and the Australian Capital Territory, it is not possible to construct separate reliable life tables for these jurisdictions.
[28] Of the four jurisdictions for which life expectancy estimates are produced, Western Australia does not have an agreed trajectory.
[29] Indigenous mortality data includes: New South Wales, Queensland, South Australia, Western Australia and the Northern Territory only, which are the jurisdictions considered to have adequate levels of Indigenous identification suitable to publish. As the Indigenous population is much younger, comparisons of mortality rates with non-Indigenous Australians can be made after adjusting for the different age structures of the two populations.
[30] References to per cent change in mortality rates in this chapter are derived through linear regression analysis, and statistical significance is tested at 95% level of significance. For details on the specifications for the mortality indicator used in this report, refer to the NIRA data specifications on the AIHW METeOR website.
[31] Sourced from Steering Committee for the Review of Government Service Provision 2009, National Agreement performance information 2008-09: National Indigenous Reform Agreement, Productivity Commission, Canberra.