'Australia has benefitted from having an employment Closing the Gap target. While progress over the past ten years against this target has been variable, its existence has ensured a continued focus on employment as a key desired outcome for Government, communities and business. It has ensured that questions are asked of policy makers, service providers and individuals around what is working, and what needs improvement'. Participant in the Closing the Gap Refresh consultation.
Introduction
Having a job can be transformational. It creates financial independence and fosters new and improved skills. It also acts as a gateway to other opportunities.
Employment is critical to the health and prosperity of Aboriginal and Torres Strait Islander people. It offers social and economic benefits that flow to individuals, families, communities and the economy as a whole.
Many Aboriginal and Torres Strait Islander people are thriving in workplaces across Australia, however progress towards the target to halve the gap in employment rates has been slow. It is important to understand the drivers and barriers affecting Indigenous employment when considering the pace of change required.
Life circumstances fundamentally affect a person’s capacity for work. Capacity to gain sustainable employment is affected by broader influences, including education, access to housing and adequate health care. In turn, the number and types of jobs available impact on success rates.
To achieve long-term progress, pathways must be built from school to further education and training, then into self-employment or to trades and professional industries that provide culturally competent workplaces for Indigenous Australians.
Complex influences on employment mean that a range of policies can impact on progress. Australian Government macro-economic policies and employment services must work in concert with state and territory government employment initiatives and the health and education systems. The private sector also plays a critical role by recruiting and developing staff and providing safe workplaces. More broadly, a society that values Aboriginal and Torres Strait Islander cultures and people provides a supportive environment for employment.
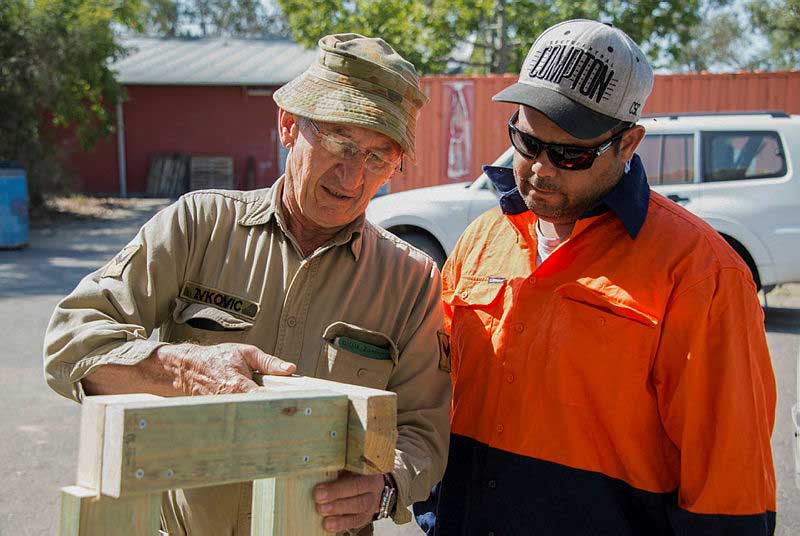
Each year the Australian Army works together with a remote Indigenous community to deliver infrastructure projects and vocational skills training. Courses in hospitality, business and construction were well attended in Toomelah, NSW.
Employment
Halve the gap in employment outcomes between Indigenous and non-
Indigenous Australians within a decade (by 2018)
- As outlined in the 2018 Report, the target to halve the gap in employment by 2018 is not on track. Nationally, the Indigenous employment rate has not improved and the gap has widened over the past decade.
- The share of Indigenous Australians employed varies across remoteness. In 2016, 54% of Indigenous Australians of working age and living in Major Cities were employed, compared to 31% of those living in Very Remote areas.
- After adjusting for changes in remote employment programs, the employment rate for Indigenous Australians rose around 4 percentage points, and in Very Remote areas by around 11 percentage points over the decade to 2016.
What the data tells us
National
As outlined in the 2018 Report, the target to halve the gap in employment outcomes within a decade is not on track.
Progress against this target is measured using data on the proportion of working age (15–64 years) Aboriginal and Torres Strait Islander peoples employed (the employment-to-population ratio, referred to here as the employment rate). There are no new data to assess progress against the target this year.[20]
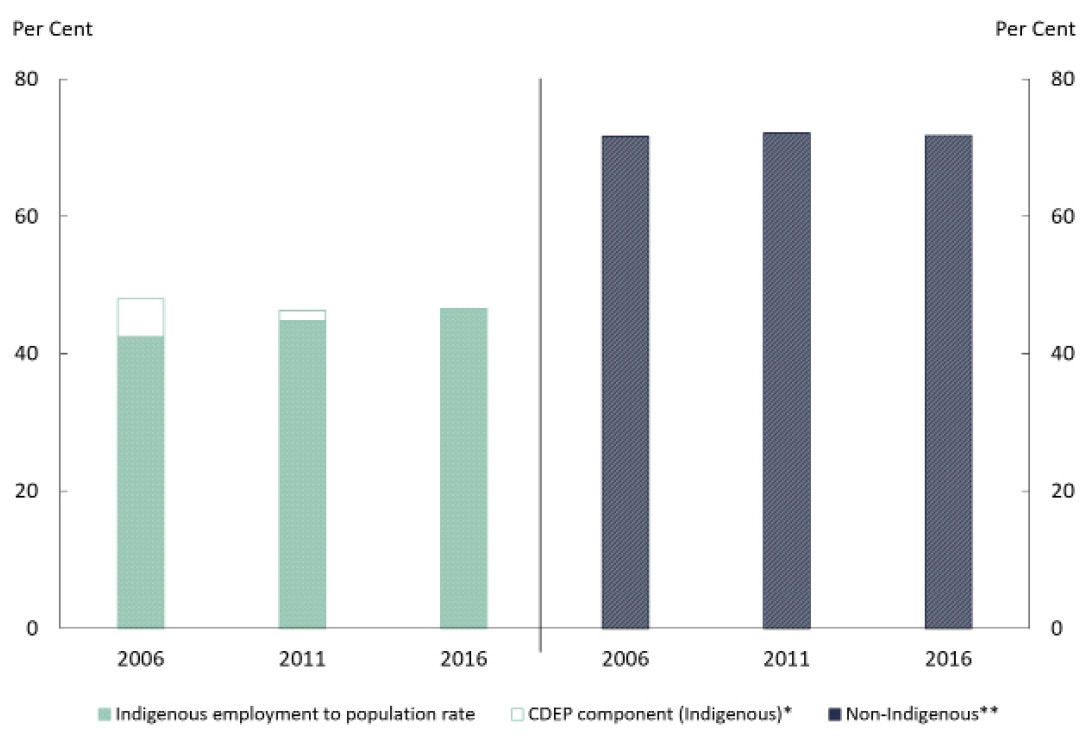
Nationally, the employment rate for Indigenous Australians has not improved over the past decade. The Indigenous employment rate fell from 48% in 2006 to just under 47% in 2016 (Figure 4.1). Over the same period, the non-Indigenous employment rate was broadly stable, at around 72%. As a result, the gap has widened by 1.5 percentage points to around 25 percentage points in 2016.
Measuring progress toward the employment target is affected by the cessation of the Community Development Employment Projects (CDEP) program. The CDEP program paid participants CDEP wages (derived from income support) to participate in activities or training and were previously classified as being employed. Job seekers who were eligible for the CDEP are now supported through jobactive and Disability Employment Services (in non-remote areas) and the Community Development Program (CDP) (delivered in 60 regions and more than 1,000 communities) and are not classified as being employed.[21]
Focusing on changes in the non-CDEP employment rate over time can provide a more accurate sense of labour market developments. After adjusting the employment status of CDEP participants, the employment rate for Indigenous Australians was around 42% in 2006 (Figure 4.1). In 2016, the employment rate for Indigenous Australians increased to 47%. This represents an approximate 4 percentage point improvement in the share of Indigenous Australians employed over the past decade. However, this increase is likely to be an underestimate of the actual improvement in the non-CDEP employment rate because the Census underestimates the number of CDEP participants.[22]
Figure 4.1: Employment to population rate, 15–64 years
Note:
* Employment rates are adjusted to exclude those CDEP participants employed, while including all CDEP participants in the underlying population count. The CDEP program did not exist in 2016 so no estimate is shown.
** Non-Indigenous CDEP participants have not been identified separately due to the small size of the cohort.
Source: Steering Committee for the Review of Government Service Provision 2018, National Agreement performance information 2017–18: National Indigenous Reform Agreement, Productivity Commission, Canberra; and Steering Committee for the Review of Government Service Provision 2013, National Agreement performance information 2012–13: National Indigenous Reform Agreement, Productivity Commission, Canberra.
View the text alternative for Figure 4.1.
Remoteness
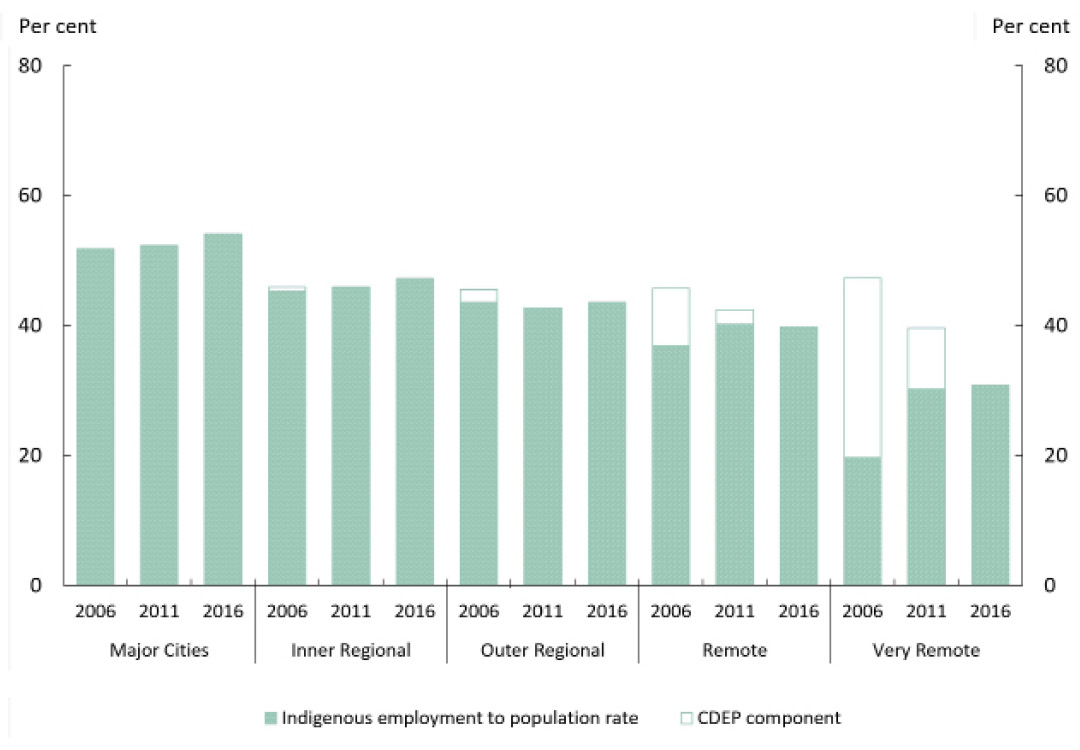
Employment outcomes vary markedly across regions. In 2016, the Indigenous employment rate ranged from 54% in Major Cities to 31% in Very Remote areas.
Without adjusting for the effect of the CDEP program, over the decade to 2016 the share of Indigenous Australians employed in both Major Cities and Inner Regional areas increased slightly (by 2.3 and 1.2 percentage points respectively). However, over the same period, employment rates for Indigenous Australians living in Outer Regional, Remote and Very Remote areas fell (ranging from 2.0 percentage points in Outer Regional areas to 16.5 percentage points in Very Remote areas) (Figure 4.2).
As outlined above, focusing on changes in the non-CDEP employment rate over time can provide a more accurate sense of labour market developments. For example, recent analysis has demonstrated that the impact of the cessation of the CDEP program on Indigenous employment rates was likely to be more pronounced in remote areas, where CDEP participation was relatively high (Venn & Biddle 2018).
For Indigenous Australians living in remote areas, while the unadjusted employment rate (counting CDEP participants as employed) declined between 2006 and 2016, the adjusted employment rate increased (Figure 4.2). Specifically, over the decade to 2016 the employment rate in:
- Remote areas increased by almost 3 percentage points to around 40% in 2016 (in contrast, the unadjusted rate decreased by 6 percentage points).
- Very Remote areas increased by around 11 percentage points to 31% in 2016 (the unadjusted rate fell by around 16 percentage points).
Negligible changes were observed in the adjusted employment rate for Indigenous Australians in Outer Regional areas (the unadjusted rate fell by 2 percentage points).
Figure 4.2: Employment to population rate by remoteness for Indigenous Australians, 15–64 years*
Note:
* Employment rates are adjusted to exclude those CDEP participants employed, while including all CDEP participants in the underlying population count. The CDEP program did not exist in 2016 so no estimate is shown.
Source: Steering Committee for the Review of Government Service Provision 2018, National Agreement performance information 2017–18: National Indigenous Reform Agreement, Productivity Commission, Canberra; and Steering Committee for the Review of Government Service Provision 2013, National Agreement performance information 2012–13: National Indigenous Reform Agreement, Productivity Commission, Canberra.
View the text alternative for Figure 4.2.
As the nature of employment continues to evolve, certain types of jobs decline or become redundant and new opportunities and industries will emerge.
These trends reflect a number of factors, including ongoing technological change and the automation of many routine jobs. Over recent decades, employment growth has come from non-routine cognitive jobs such as managers and professionals, and more recently, from non-routine manual jobs such as community and personal service workers (Heath 2017).
While this transformation can drive innovation and productivity growth, the effect across industries and occupations may not be uniform. For example, the rate of growth in routine manual[23] employment such as technicians, trade workers, labourers and machine operators was much slower in the decade to 2016. Employment levels in the manufacturing and agricultural sectors also fell over this same period (PMC analysis of ABS 2018a).
More routine and manual jobs will become increasingly susceptible to automation over the next few decades (Edmonds & Bradley 2015). This includes those industries with historically large workforces such as retail trade, manufacturing and construction.
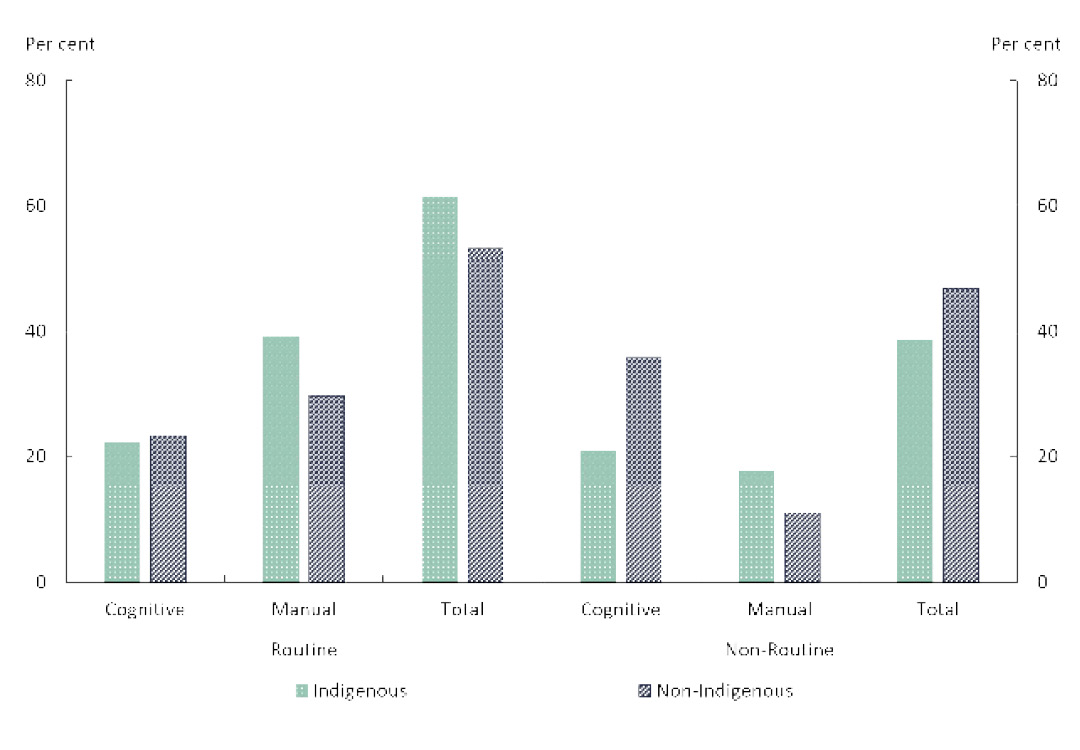
While the proportion of Indigenous Australians in routine manual employment has declined over the decade, it remains a significantly more common employment type for the Indigenous workforce compared with the non-Indigenous workforce (Figure 4.3).
Indigenous Australians also have a comparatively low representation in the non-routine forms of employment that are forecasted to make a significant contribution to future employment growth. The forecasted growth in non-routine employment is expected to be concentrated in cognitive roles such as in Science, Technology, Engineering and Mathematics (STEM) fields, as well as more interpersonal and manually-focused jobs such as education and healthcare (Hajkowicz et al. 2016).
Figure 4.3: Routine and non-routine work for Indigenous and non-Indigenous Australians, 15–64 years in 2016
Source: Department of the Prime Minister and Cabinet analysis of Australian Bureau of Statistics 2018, 2016 Census TableBuilder Pro, Cat. No. 2037.0.30.001, Australian Bureau of Statistics, Canberra.
View the text alternative for Figure 4.3.
Translating Policy into Action
The Commonwealth and state and territory governments are working together to improve employment outcomes for all Australians. Employment services play an important role to support job seekers find work. Government investment includes support for:
- Mainstream employment programs. Like all Australians, Aboriginal and Torres Strait Islander Australians, receive support and services through government-funded mainstream programs, including employment services programs. It is essential mainstream programs are able to support Indigenous Australians. Indigenous job seekers can access support through mainstream employment programs, such as jobactive, Transition to Work, YouthPaTH and ParentsNext. jobactive provides services to the majority of Indigenous job seekers. The Closing the Gap – Employment Services package enhances the ability of mainstream employment services to place more Indigenous job seekers into work.
- Complementary Indigenous-specific programs. The Government funds Indigenous-specific employment programmes, such as Vocational Training and Employment Centres, the Employment Parity Initiative, Tailored Assistance Employment Grants and the Indigenous Rangers. Increasingly, many employment service providers funded through these programs are Indigenous organisations themselves, supporting the growth of the Indigenous business sector and the delivery of culturally competent services. The Government has also established the Time to Work Employment Service. The service is an in-prison employment service that aims to better prepare Indigenous prisoners for their release from prison, improve the likelihood of connecting with post-release employment services and support post-release employment service providers to place ex-offenders in employment. The service aims to help address the current pattern of high rates of Indigenous recidivism.
- Disability Employment Services. Over 12,000 Aboriginal and Torres Strait Islander Australians with a disability are supported through Disability Employment Services, with a steep increase in the number of participants who stay employed for more than 13 weeks. In addition, strategies to build and diversify the Indigenous allied health workforce will benefit participants in the National Disability Insurance Scheme living in rural/remote areas to increase access to culturally appropriate allied health services and other service delivery.
- Remote employment programs. The Government acknowledges remote jobs are often more sporadic and short term. In response to feedback from remote communities and other stakeholders, the Government is implementing reforms to the remote employment service, the Community Development Program (CDP). From 2019, the CDP reforms will help more remote job seekers transition from welfare into real jobs, and better support vulnerable job seekers.
- Employment of local Aboriginal and Torres Strait Islander people in Commonwealth-funded services. For example, the Remote School Attendance Strategy (RSAS) employs 495 staff who play a vital role in getting children to school. Approximately 93% of RSAS staff identify as Aboriginal and/or Torres Strait Islander people.
- Direct employment of Aboriginal and Torres Strait Islander people in the Commonwealth Public Sector. Indigenous representation has increased steadily towards the 3% by 2018 target (reaching 2.9% as at 30 June 2018), supported by the Aboriginal and Torres Strait Islander Employment Strategy. The number of Aboriginal and Torres Strait Islander employees in the Commonwealth has grown by almost 25% since 2015 (PMC 2019). In addition, the public sector supports secondments to Aboriginal and Torres Strait Islander partner organisations under the Jawun program.
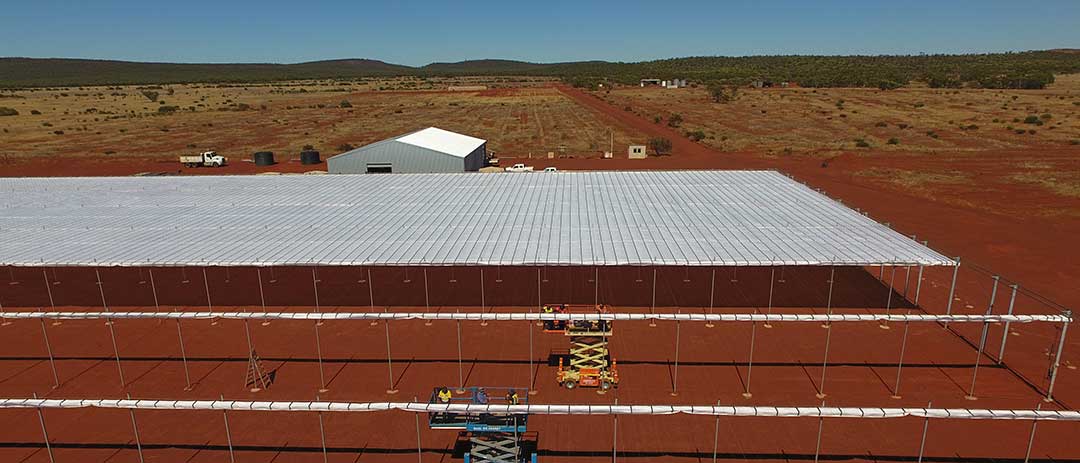
The Midwest Employment and Economic Development Aboriginal Corporation (MEEDAC) has gone from strength to strength since starting a project to supply fruit and vegetables to local mines. MEEDAC gained funding to construct a 10,000 square metre state of the art shadehouse at Innovation Park.
What are the areas for further development?
The Australian Government will continue to work across agencies, with state and territory governments, industry, experts and other stakeholders, and Aboriginal and Torres Strait Islander Australians to:
- Deliver effective and culturally competent employment services through mainstream programs.
- Ensure Indigenous-specific programs complement mainstream programs where necessary.
- Tailor the CDP based on the needs of remote communities and job seekers.
- Ensure Aboriginal and Torres Strait Islander Australians have access to quality employment opportunities, including in growth industries.
- Better understand the employment opportunities of the future and link relevant educational offerings to ensure Indigenous Australians are job ready.
Local solutions
In Ceduna, SA, the Maximising Indigenous Employment and Economic Opportunities (MIEEO) pilot works with Traditional Owners and ten key Aboriginal and Torres Strait Islander organisations to promote potential business opportunities arising from the National Disability Insurance Scheme (NDIS). Ceduna MIEEO has directly led to an increase in Aboriginal and Torres Strait Islander community controlled NDIS providers in the region.
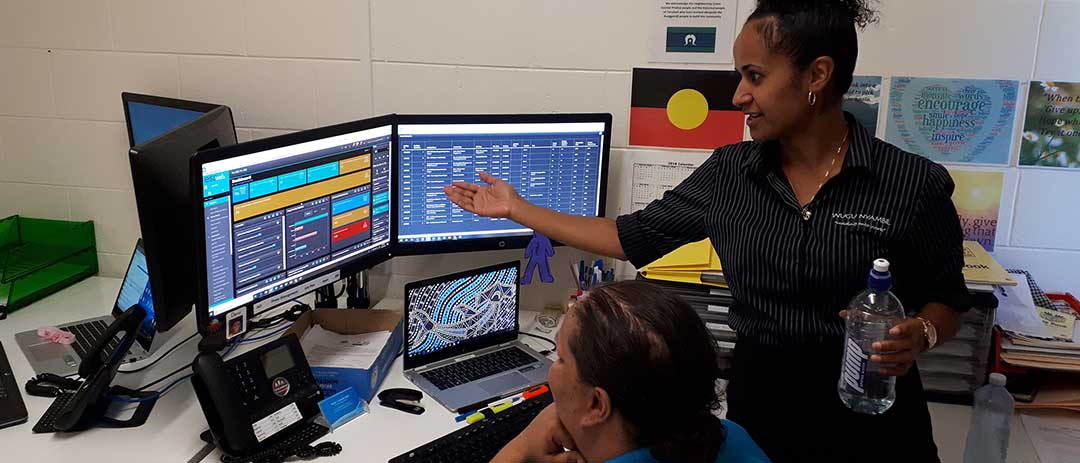
In Yarrabah, employment services are being delivered in the community by the community. This trial of a place-based employment service draws on the local knowledge and connections staff who are either residents of Yarrabah or who have a close connection to Yarrabah. To build the capacity of Yarrabah to deliver employment services, a flexible funding pool is available to deliver local employment projects, such as a community skills and training activity.
[20]The main data sources used to assess progress against the employment target are the ABS National Aboriginal and Torres Strait Islander Health Survey (NATSIHS) and Social Survey (NATSISS). Data from the 2014-15 NATSISS published in the 2017 Closing the Gap report showed this target was not on track. While not directly comparable with the NATSIHS and NATSISS, the ABS Census provides an alternative source of data for this target. Data from the 2016 Census, the most recent dataset for this target, were released in 2017 and included in the 2018 Closing the Gap report. The final datum point for this target will e sourced from the 2018-19 NATSIHS, due to become available in late 2019.
[21]As the CDEP was wound down and participation declined, many of these individuals transferred across to other employment services, where they received income support and were then counted as unemployed.
[22]The ABS Census only asks people who were counted using an Interviewer Household Form about their participation in CDEP. This form is primarily used for discrete Indigenous communities. To compare, around 32,800 Indigenous Australians were registered as CDEP participants in administrative data around the time of the 2006 Census; however, only 14,497 people were counted as CDEP participants in the Census itself (Hunter 2016).
[23]As defined by the Reserve Bank of Australia (Heath, 2017).