'The First 1,000 Days between a woman's pregnancy and her child's second birthday offers a unique window of opportunity to shape healthier and more prosperous futures.' Professor Kerry Arabena.
Introduction
A good start in life gives our children the best chance for success and for going on to make the most of their opportunities in later life.
Healthy development across the Australian Early Development Census (AEDC) domains of physical health and wellbeing, social competence, emotional maturity, language and cognitive skills and communication, helps children thrive in the early years and provides a sound foundation for life. Access to quality early childhood learning and care is one way to ensure positive child development and successful transition to school participation.
There is also a strong and consistent association between the AEDC results and literacy and numeracy outcomes.
A child’s early learning abilities can be compromised by factors such as inter-generational trauma, family stress, unstable housing, violence, low parental education and unemployment.
Giving children a good start relies on taking an integrated approach to support structured early learning environments, supporting positive parenting skills and stronger families, and maternal and child health interventions to enhance positive and healthy early child development.
Early childhood education and care services for Aboriginal and Torres Strait Islander children is a collaborative effort across all governments. The Australian Government works with Aboriginal and Torres Strait Islander people, families and communities to ensure that children are safe, resilient and thriving.
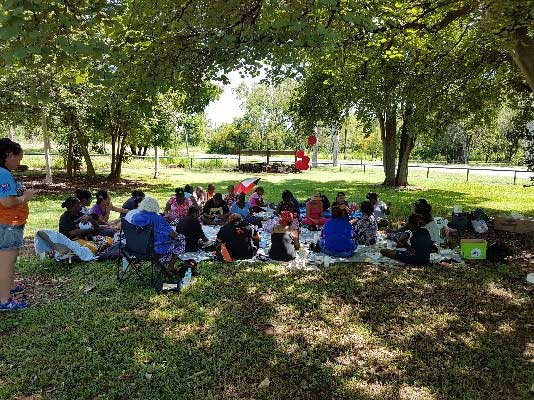
Wurli Wurlinjang’s Strong Indigenous Families program aims to improve the safety of women and their families. Here, Wurli delivers open air therapeutic services to families, which aim to work towards breaking the inter-generational cycle of family and domestic violence and the removal of children from families.
Child mortality Target
Halve the gap in mortality rates for Indigenous children
under five within a decade (by 2018)
- The target to halve the gap in child mortality rates by 2018 is not on track.
- Since the target baseline (2008) the Indigenous child mortality rate has declined by 10% (not statistically significant) but the gap has not narrowed as the non-Indigenous rate has declined at a faster rate.
- There has been progress over the longer term. Between 1998 and 2017, there has been a 35% decline in the Indigenous child mortality rate and the gap has narrowed by 29%.
- Indigenous maternal and child health indicators have continued to improve, indicating potential gains in child mortality outcomes in the coming years.
What the data tells us
National
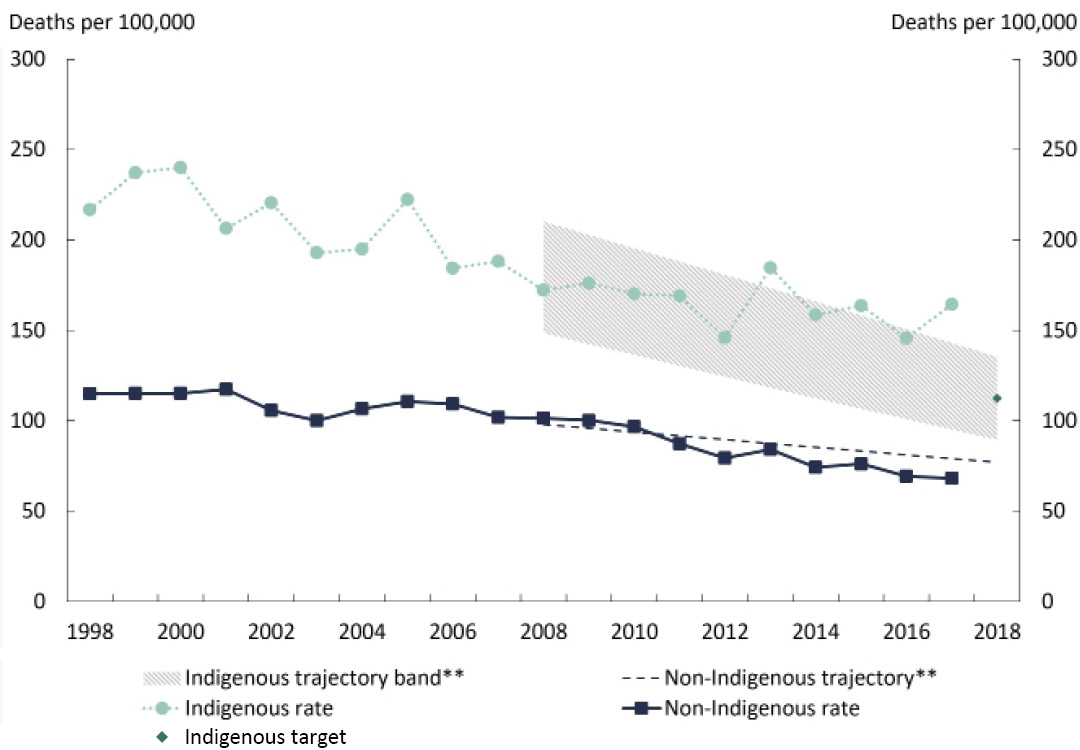
In 2017, the Indigenous child mortality rate[3] was not within the range to meet the target by 2018 and was, therefore, not on track (Figure 2.1).
Progress against this target is measured using the Australian Bureau of Statistics (ABS) mortality data for 0–4 year olds.[4] In 2017, data show that 131 Indigenous children died (see Box 2.1 for details about data collection). This was equivalent to a rate of 164 deaths per 100,000, which was 2.4 times the mortality rate for non-Indigenous children (68 deaths per 100,000).
Figure 2.1: Child mortality rates#*
Note:
# The rates for 2014 differ slightly from previous reports due to the correction of a minor processing error, and the rate for 2015 differs slightly due to final Estimated Resident Population (ERP) being incorporated into the denominator.
* Child mortality rates are based on data for New South Wales, Queensland, South Australia, Western Australia and the Northern Territory combined. Due to data quality issues, the average of three years of population data centred around the reporting year is used as the denominator to derive annual child mortality rates.
** The non-Indigenous trajectory is based on the non-Indigenous trend between 1998 and 2012, from which the Indigenous trajectory was derived.
Source: Australian Bureau of Statistics and Australian Institute of Health and Welfare 2018 analysis of National Mortality Database, unpublished and National Indigenous Reform Agreement Performance Information Management Group, unpublished.
View the text alternative for Figure 2.1.
While there was still a gap of 96 deaths per 100,000 children in 2017, there has been significant[5] improvement over the long run, although at a slower rate than required to meet the target. Between 1998 and 2017, Indigenous child mortality rates declined significantly by 35%[6] from 217 per 100,000 children to 164 per 100,000 children in 2017. Over the same period, the gap between Indigenous and non-Indigenous child mortality rates also reduced significantly by 29% (Figure 2.1).
However, since the 2008 target baseline, a high degree of volatility in the Indigenous child mortality rate makes it difficult to ascertain a trend (see Box 2.1 for more details). Over the last decade, the Indigenous child mortality rate declined from 172 per 100,000 in 2008 to 146 in 2012, before peaking at 185 in 2013. The rate then declined to 146 per 100,000 in 2016 before rising again to 164 per 100,000 in 2017.
Between 2008 and 2017, the Indigenous child mortality rate declined by 10% (not statistically significant), but the gap has not narrowed as the non-Indigenous child mortality rate has declined by around 35% (statistically significant).
Indigenous child mortality rates vary from year to year. This reflects a number of factors including natural variations in child death counts from year to year, changes in Indigenous identification in the mortality data and in the estimates of the total Indigenous child population (the denominator).
As reported previously, Queensland has recently changed its approach to Indigenous status identification for deaths data. From 2015, Queensland has included Medical Certificate of Cause of Death information to contribute to the Indigenous status identification. This administrative change has led to a subsequent increase in the number of deaths that were identified as Indigenous and a decrease in the number of deaths for which the Indigenous status was 'not stated'. In 2017, 12% of child deaths registered in Queensland were identified as Indigenous using the new methods which would have otherwise been classified as ‘not stated’. Since Queensland tends to have a dominant share in the total number of Indigenous child deaths (about 38% of Indigenous child deaths in 2017), such changes can have a substantial impact on the total Indigenous child mortality rate.
Improvements in data quality have been part of the Closing the Gap data improvement commitments and have long term benefits in terms of improved information and measurement. In the short term, such changes lead to volatility in the rates and create uncertainty around trend estimates.
This volatility affects the yearly status of the target and as such, caution is required in interpreting meaning to annual variation. To address the uncertainty, long-term data (from 1998) are provided to reveal the underlying trend. Greater context is also provided around trends acknowledging limited but nevertheless worthwhile improvements in intermediary child and maternal health outcomes which pave the way for future improvements.
States and territories
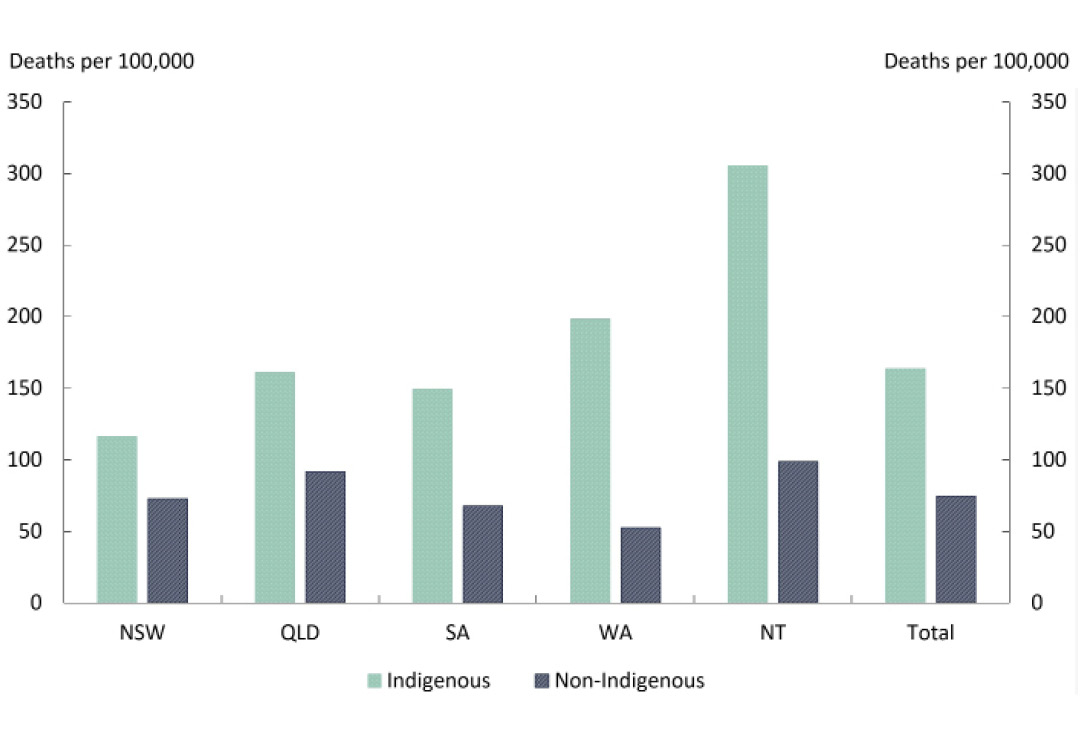
Of the five jurisdictions with acceptable quality of Indigenous mortality data, the Northern Territory continued to have the highest Indigenous child mortality rate (305 per 100,000) over the period 2013–17[7], and New South Wales had the lowest Indigenous child mortality rate (116 per 100,000). The gap was largest in the Northern Territory (207 per 100,000) (Figure 2.2).
Figure 2.2: Child mortality rates by jurisdiction, 2013–17
Source: Steering Committee for the Review of Government Service Provision 2018, National Agreement performance information 2017–18: National Indigenous Reform Agreement, Productivity Commission, Canberra.
View the text alternative for Figure 2.2.
Infant and early childhood mortality rates
Over the period 2013–17, 525 (84%) of the 622 Indigenous child deaths were infants (less than 1 year old). The Indigenous infant mortality rate was twice the rate for non-Indigenous infants (6.3 compared with 3.1 per 1,000 live births). More than half (56%) of these infant deaths were due to ‘perinatal conditions’ (such as birth trauma, foetal growth disorders, complications of pregnancy, and respiratory and cardiovascular disorders).[8]
The Indigenous infant mortality rate has more than halved from 13.5 per 1,000 live births in 1998 to 6.3 per 1,000 live births in 2017, and the gap has narrowed significantly (by 84%) from 9.1 per 1,000 live births to 3.3 per 1,000 live births over this period. Since the 2008 baseline, the infant mortality rate has declined by 9%, although not statistically significant, and there has been no significant change in the gap since 2008.
Over the period 2013–17, 16% of Indigenous child deaths were early childhood deaths (1–4 year olds). About half (51%) of these early childhood deaths were caused by external causes of morbidity and mortality (including transport accidents, drowning and other external causes of accidental injuries). The Indigenous early childhood mortality rate has declined by 26% since 1998, but a high degree of volatility (due to very small numbers) has contributed to the change being not statistically significant.
Of all Indigenous child (0–4 year olds) deaths over the period 2013–17, 75% were caused by three main causes: perinatal conditions (47%), 'signs, symptoms and abnormal clinical and laboratory findings not classified elsewhere' (such as Sudden Infant Death Syndrome - SIDS) (14%), and congenital and chromosomal conditions (14%). Perinatal conditions account for almost half (49%) of the gap in Indigenous child mortality, and the three leading causes together account for about 75% of the gap.
While a complex set of factors underpin the higher infant and child mortality rates for Indigenous children, a number of maternal health and pregnancy behaviours and birth outcomes seem to be closely related with the three main leading causes of Indigenous child deaths (AIHW 2018a). Perinatal conditions include disorders related to pre-term labour/birth or poor fetal growth. Pre-term babies are at higher risk of death and long-term health conditions. The risk of SIDS is higher for pre-term and/or low birthweight infants, or those exposed to maternal smoking or alcohol consumption. Congenital and chromosomal conditions are thought to be caused by a combination of genetic, environmental and behavioural factors including smoking, alcohol and drug use, poorly controlled medical conditions (such as diabetes), use of some medicines during pregnancy, and other factors. This highlights the importance of focusing on improving access to culturally appropriate maternal health and pregnancy-related care, as well as broader health and wellbeing initiatives as these help lower the risk factors for poor birth outcomes (AHMAC 2017; AIHW 2014).
A number of initiatives have been implemented to improve Indigenous child and maternal health since 2008, such as through the New Directions: Mothers and Babies Services program. Policies and programs take time to have measurable impacts as there is a long time lag between policy development, adoption and delivery, impact on outcomes and availability of data to measure changes in the final outcomes (AIHW 2014).
Available data suggest some of the impact of policies and programs implemented is now measurable. There have been notable improvements in child and maternal health indicators over recent years (Boxes 2.2 and 2.3). However, some substantial gaps remain between outcomes for Indigenous and non-Indigenous mothers and babies, indicating the scope, and the need, for further improvements. Further gains will be achieved by continued focus on these intermediary factors.
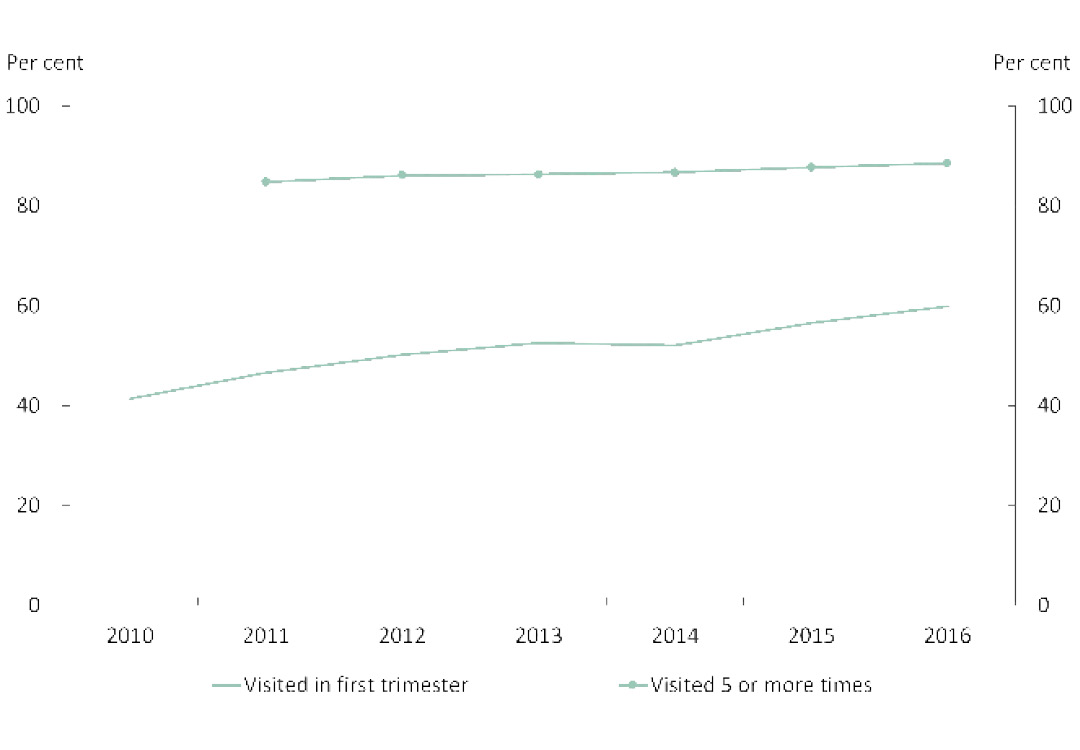
The proportion of Indigenous mothers who attended antenatal care in the first trimester increased from 41% in 2010 to 60% in 2016 (Figure 2.3). For non‑Indigenous mothers, there was a smaller increase over that time, from 61% to 67%.
For Indigenous mothers, the proportion was higher in Inner Regional areas (66%), compared with Major Cities and Very Remote areas (58%).
Figure 2.3: Antenatal care use by Indigenous mothers
Source: Australian Institute of Health and Welfare 2018, Australia’s mothers and babies 2016 — in brief, Perinatal statistics series no. 33, Cat. No. PER 91, AIHW, Canberra.
View the text alternative for Figure 2.3.
Between 2011 and 2016, the proportion of mothers attending five or more visits increased slightly for Indigenous mothers from 85% to 89% while remaining similar for non-Indigenous mothers, 95% to 96%.
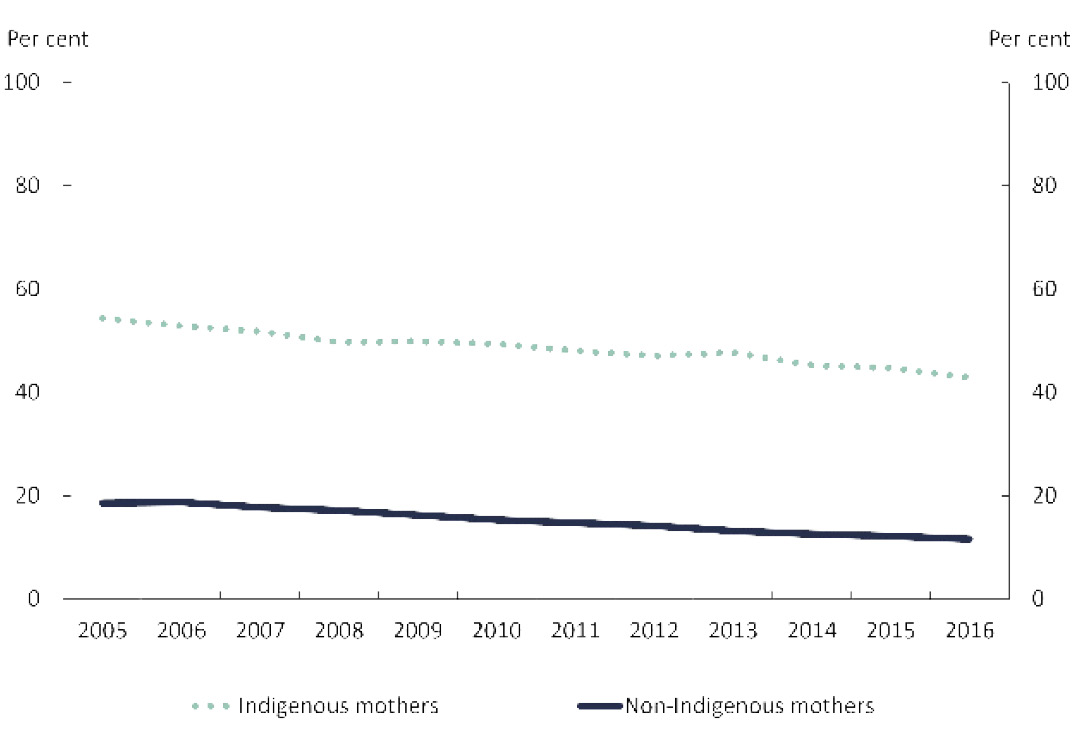
The proportion of Indigenous mothers who smoked at any time during pregnancy decreased from 54% in 2005 to 43% in 2016. However, it is still 3.7 times that of non-Indigenous mothers which was 12% in 2016 (Figure 2.4).
The rate of Indigenous mothers who were smoking ‘after 20 weeks of pregnancy’ has also decreased from 43% in 2011 to 38% in 2016.
Figure 2.4: Maternal smoking trends
Source: Australian Institute of Health and Welfare 2018, Australia’s mothers and babies 2016 — in brief, Perinatal statistics series no. 33, Cat. No. PER 91, AIHW, Canberra.
View the text alternative for Figure 2.4.
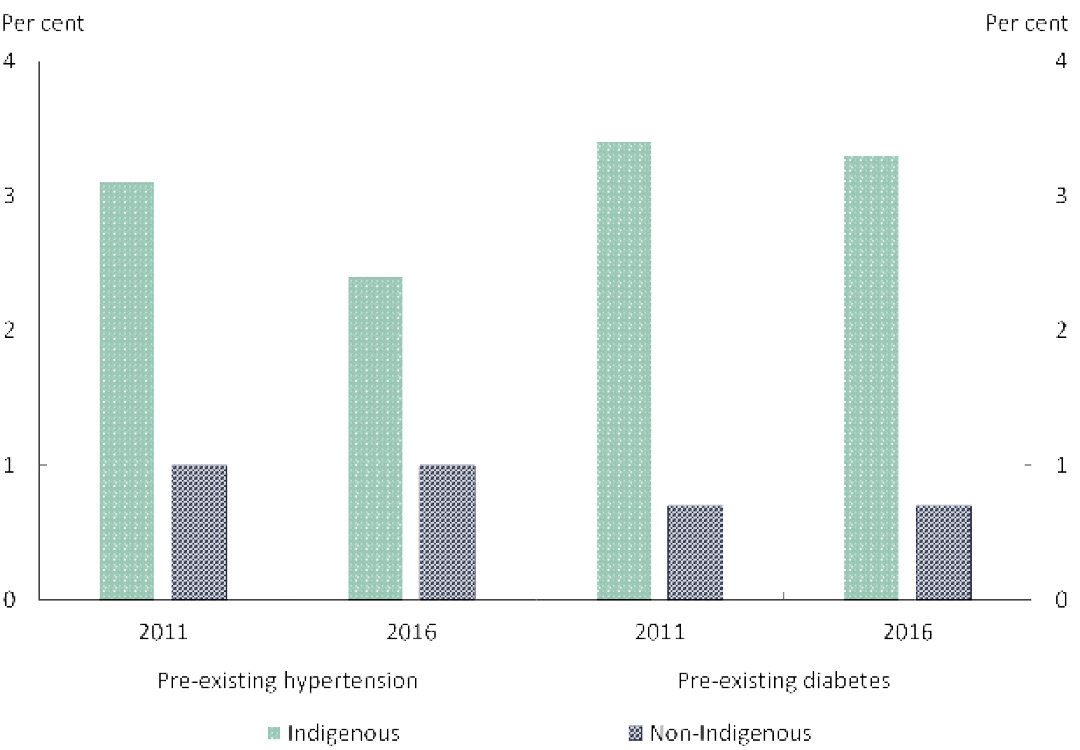
There have also been slight improvements in the rates of pre-existing hypertension, from 3.1% in 2011 to 2.4% in 2016 (Figure 2.5). The rate of pre‑existing diabetes remained similar (3.4 to 3.3%) over the same period. Still, Indigenous mothers were 2.4 times as likely to have pre‑existing hypertension and almost five times as likely to have pre-existing diabetes compared with non‑Indigenous mothers (1.0% with pre-existing hypertension and 0.7% with pre‑existing diabetes).
Figure 2.5: Pre-existing maternal health conditions
Source: Australian Institute of Health and Welfare 2018, Australia’s mothers and babies 2016 — in brief, Perinatal statistics series no. 33, Cat. No. PER 91, AIHW, Canberra.
View the text alternative for Figure 2.5.
Available data suggest the impact of the small improvements in these intermediate indicators of maternal health has started to appear in the form of gradual improvements in some of the child birth outcomes such as pre-term births and low birthweight.
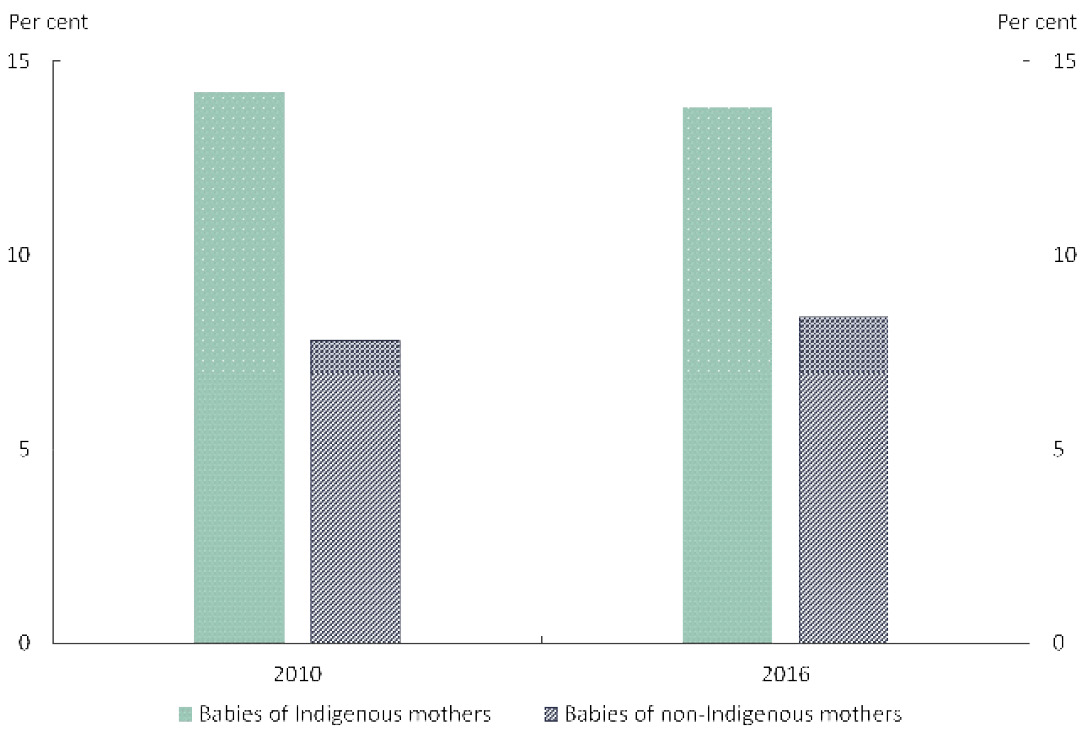
Pre-term births (between 20 and 36 weeks of pregnancy) is associated with a higher risk of adverse birth outcomes. Between 2010 and 2016, pre-term babies born to Indigenous mothers declined slightly from 14.2% to 13.8%, while pre‑term babies born to non‑Indigenous mothers increased slightly from 7.8% to 8.4% (Figure 2.6).
Source: Australian Institute of Health and Welfare 2018, Australia’s mothers and babies 2016 — in brief, Perinatal statistics series no. 33, Cat. No. PER 91, AIHW, Canberra.
View the text alternative for Figure 2.6.
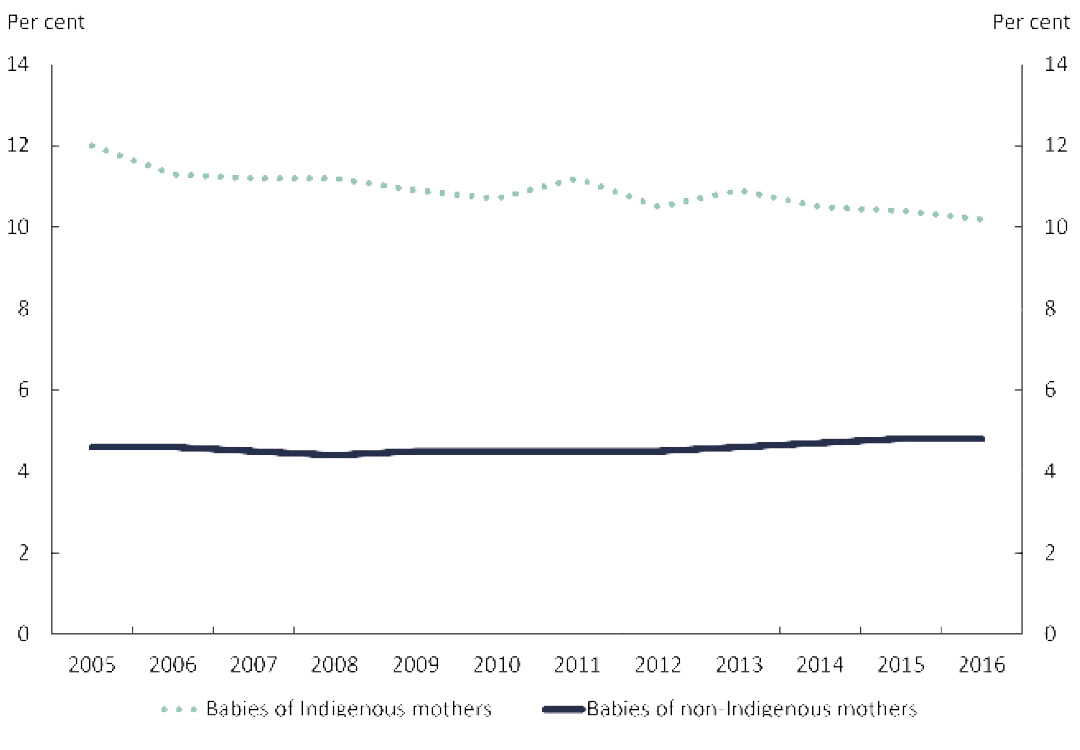
There has also been a slight decrease in the proportion of low birthweight singleton (single birth) babies born to Indigenous mothers between 2005 and 2016, from 12.0% to 10.2%. Over the same period the proportion of low birthweight babies with non‑Indigenous mothers increased slightly from 4.6% to 4.8% (Figure 2.7).
Figure 2.7: Low birthweight singleton babies
Source: Australian Institute of Health and Welfare 2018, Australia’s mothers and babies 2016 — in brief, Perinatal statistics series no. 33, Cat. No. PER 91, AIHW, Canberra.
View the text alternative for Figure 2.7.
Indigenous children are often found to be at higher risk of contracting diseases such as pneumococcal and influenza than non-Indigenous children and to experience worse health outcomes if infected (Hendry et al. 2018). Immunisation is a safe and effective way to reduce the incidence of morbidity and mortality due to vaccine preventable disease in the Australian community.
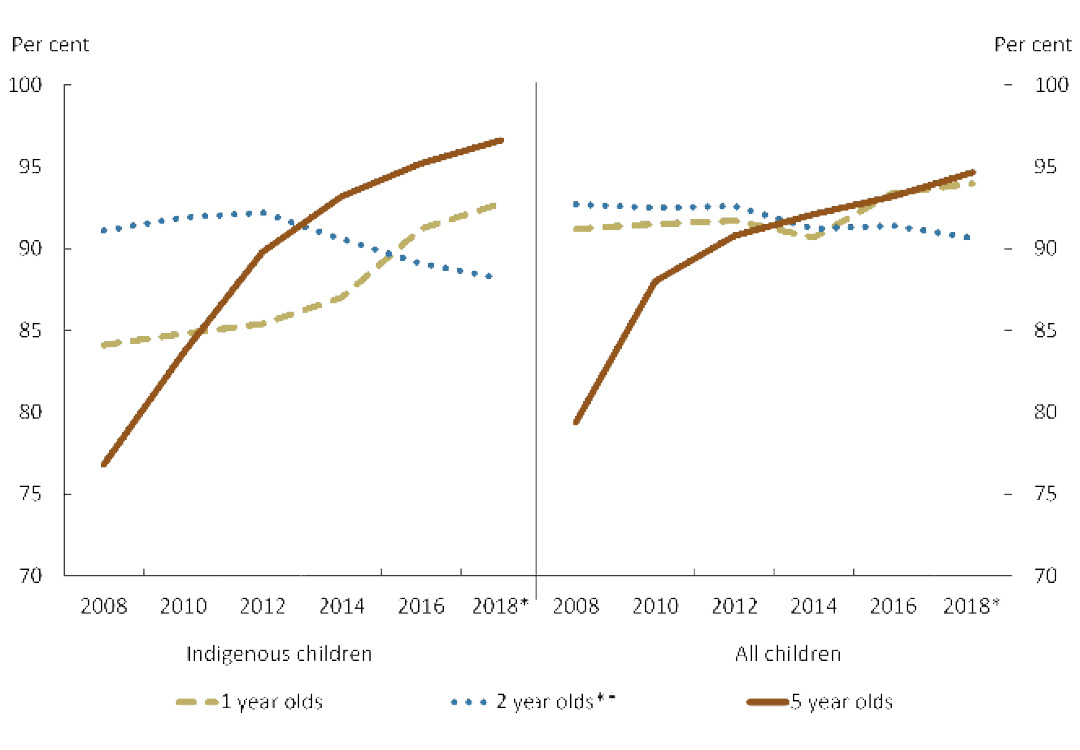
Over the past 10 years, Australia has continued to improve immunisation rates in all children, but most notably for Aboriginal and Torres Strait Islander children aged five. In 2018, immunisation rates for this group have continued to rise and remain above the rates for all children (Figure 2.8).
Figure 2.8: Immunisation rates
Notes:
* 2018 data are for the nine months to September 2018.
** There was a decline in coverage rates in December 2014 and March 2017 due to changes to the definition of full immunisation. The more antigens (immune response stimulating substances) included in the assessment, the higher the likelihood of reduced coverage rates. This usually resolves over time as the changes to the immunisation schedule become more routine.
Source: Department of Health 2018 analysis of Australian Immunisation Register, unpublished.
View the text alternative for Figure 2.8.
Early Childhood Education
95% of all Indigenous four year olds
enrolled in early childhood education (by 2025)
- The target to have 95% of Indigenous four year olds enrolled in early childhood education by 2025 is on track. In 2017, 95% of Indigenous four year olds were enrolled in early childhood education, in line with the benchmark rate for this target.
- New South Wales, Victoria, South Australia, Western Australia and the Australian Capital Territory had Indigenous enrolments in early childhood education at the benchmark rate of 95% or above.
- Attendance rates for Indigenous children were lower in remote areas - particularly in Very Remote areas - up to 16 percentage points lower than the rates for Indigenous children in other areas.
- Only around two-thirds (68%) of all Indigenous children enrolled in early childhood education attended for 600 hours or more in a year, with rates lower for Indigenous children living in the most disadvantaged and remote areas.
What the data tells us
National
In 2017, 95% of Indigenous four year olds were enrolled in early childhood education, in line with the target benchmark. It will be important to sustain this achievement over coming years.
Progress against this target is measured by the proportion of children enrolled in early childhood education in the year before they start full-time school as collected in the National Early Childhood Education and Care Collection (NECECC).[10] The 2017 NECECC data show there were 15,718 Indigenous children enrolled in early childhood education programs (the year before full-time school) – this was 95% of the estimated population (Figure 2.9).[11]
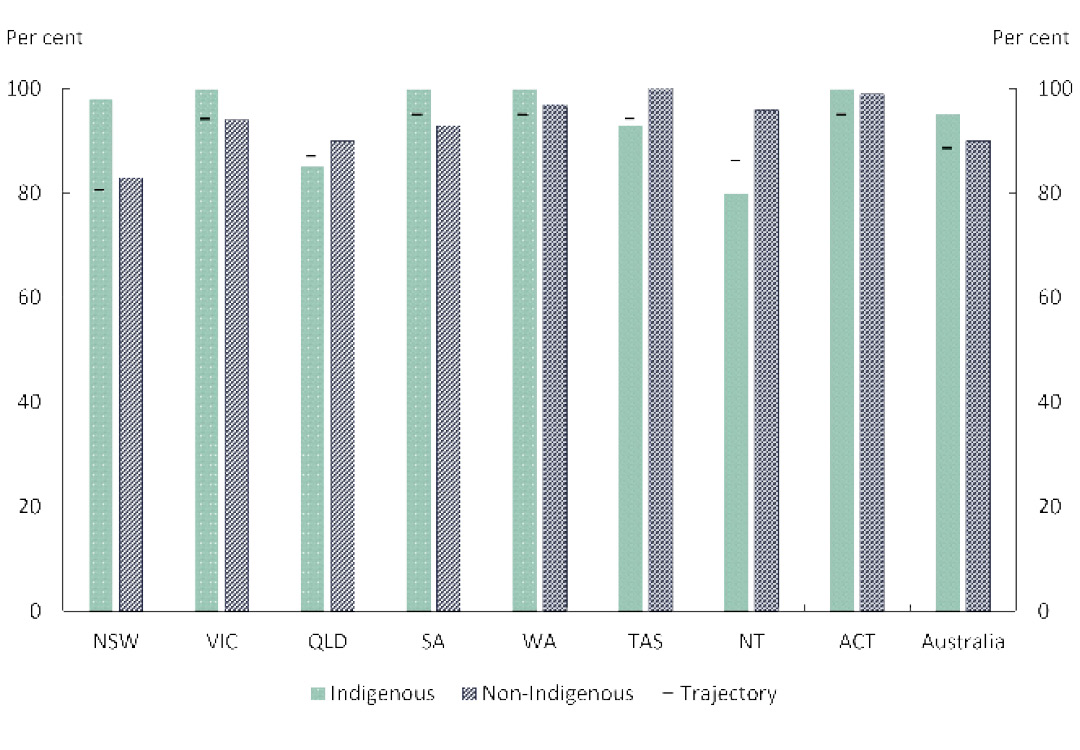
Figure 2.9: Preschool enrolments by jurisdiction, 2017
Source: Steering Committee for the Review of Government Service Provision 2018, National Agreement performance information 2017–18: National Indigenous Reform Agreement, Productivity Commission, Canberra and National Indigenous Reform Agreement Performance Information Management Group, unpublished.
View the text alternative for Figure 2.9.
Indigenous enrolment numbers in early childhood education programs increased from 14,667 in 2016 to 15,718 in 2017 resulting in an increase in the proportion of Indigenous children enrolled from 91% in 2016 to 95% in 2017. In comparison, the proportion of non-Indigenous children enrolled in early childhood education programs declined slightly from 92% to 90% between 2016 and 2017.
The attendance rate (proportion of enrolled children attending early childhood education for at least one hour in the reference week) has remained the same between 2016 and 2017 for Indigenous (93%) as well as non-Indigenous children (96%).[12]
Only 68% of Indigenous children enrolled in early childhood education programs attended for 600 hours or more in 2017. This compares to around 78% of non-Indigenous children (Box 2.4). Attendance of 600 hours or more a year is an essential element of the National Partnership Agreement on Universal Access to Early Childhood Education (DET 2017).
Enrolment and attendance are precursors to deriving the benefits of a good quality early childhood education, including improving developmental outcomes in preparation for full-time schooling (Box 2.5).
States and territories
In 2017, most of the jurisdictions had Indigenous early childhood education enrolments above the target benchmark of 95%, with four (Victoria, Western Australia, South Australia and the Australian Capital Territory) achieving universal enrolments for Indigenous children, and New South Wales achieving close to universal enrolments (98%). Each of these five jurisdictions had higher proportions of Indigenous than non-Indigenous enrolment in early childhood education programs (Figure 2.10).
The remaining three jurisdictions - Queensland (85%), Tasmania (93%) and the Northern Territory (80%) - had lower proportions of Indigenous children enrolled than the national average, and lower than their respective non-Indigenous enrolment rates. From 2016 to 2017, in both Queensland and Tasmania, the number of Indigenous children enrolled increased by about 6%. However, the proportion of Indigenous children enrolled (enrolled children as a proportion of the eligible population) decreased from 2016 to 2017[13]. Both jurisdictions remain within a couple of percentage points of being back on track with the agreed trajectories to reach the target by 2025 (Figure 2.9). In the Northern Territory the number of Indigenous children enrolled declined by 2%, and the proportion of Indigenous children enrolled also declined by around 2 percentage points between 2016 and 2017.
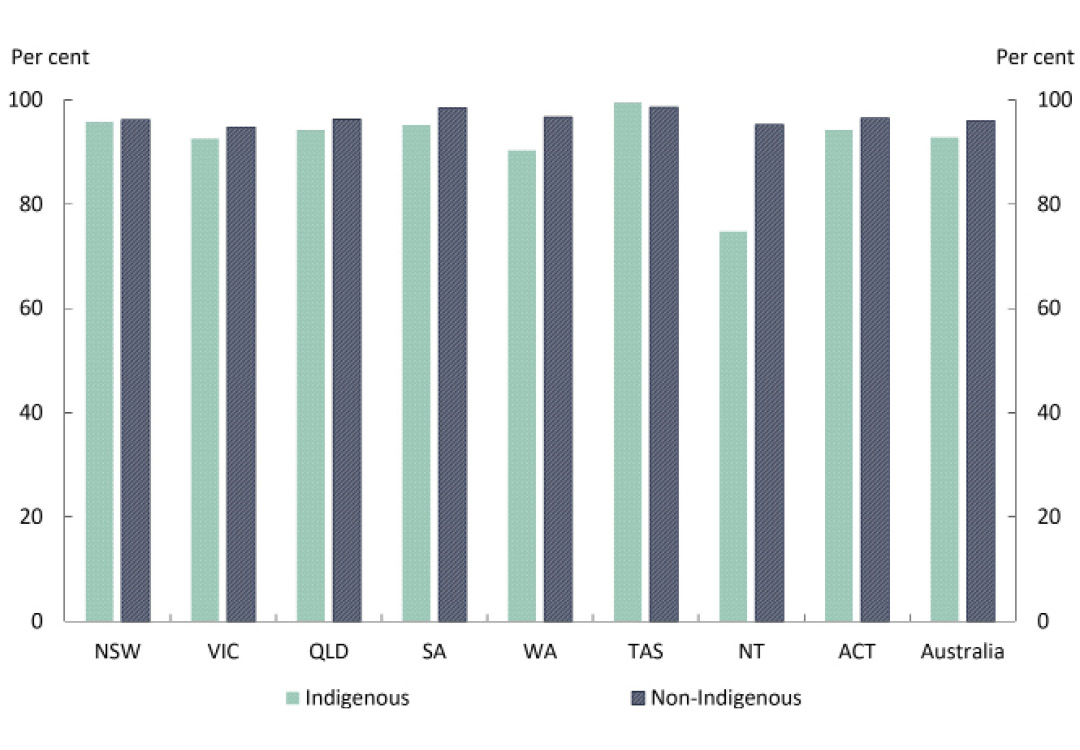
All jurisdictions, except the Northern Territory, had Indigenous early childhood education attendance rates (one hour or more in the reference week) of those enrolled close to the national average of 93%: ranging from 90% in Western Australia to the highest rate of 99% in Tasmania. The Northern Territory had the lowest attendance rate (75%). The non-Indigenous attendance rates were relatively similar across jurisdictions (ranging from 95% in Victoria and the Northern Territory to 99% in Tasmania). The gap between Indigenous and non-Indigenous attendance rates was largest in the Northern Territory (20 percentage points), followed by Western Australia (6 percentage points) (Figure 2.10).
Figure 2.10: Preschool attendance by jurisdiction, 2017
Source: Steering Committee for the Review of Government Service Provision 2018, National Agreement performance information 2017–18: National Indigenous Reform Agreement, Productivity Commission, Canberra.
View the text alternative for Figure 2.10.
Remoteness
In 2017, Indigenous early childhood education attendance rates (one hour or more in the reference week) tended to decrease with increasing remoteness, with 95% in Major Cities and Inner Regional areas to 88% in Remote and 79% in Very Remote areas. However, the non-Indigenous rates remained fairly similar across regions (ranging from 95% in Very Remote areas to 96% in all other areas) (Figure 2.11).

Source: Steering Committee for the Review of Government Service Provision 2018, National Agreement performance information 2017–18: National Indigenous Reform Agreement, Productivity Commission, Canberra.
View the text alternative for Figure 2.11.
Between 2016 and 2017, Indigenous attendance rates in Remote and Very Remote areas appear to have declined while non-Indigenous rates remained similar. As a result, the gap across remoteness areas has widened, from 12 to 17 percentage points[14] in Very Remote areas and from 6 to 8 percentage points in Remote areas.
All states and territories have committed to provide universal access to quality early childhood education programs under the National Partnership Agreement on Universal Access to Early Childhood Education. Universal access means that every child, in the year before they commence full-time schooling, has access to, and participates in: quality early childhood education program(s) delivered for at least 600 hours per year.
In 2017, almost all (97%) Indigenous children enrolled in an early childhood education program were enrolled for 600 hours or more a year. However, only 68% of all Indigenous children enrolled in early childhood education programs attended for 600 hours or more. While this is an improvement from 2016 (65%), it was still 10 percentage points below the non-Indigenous rate in 2017 (78%).
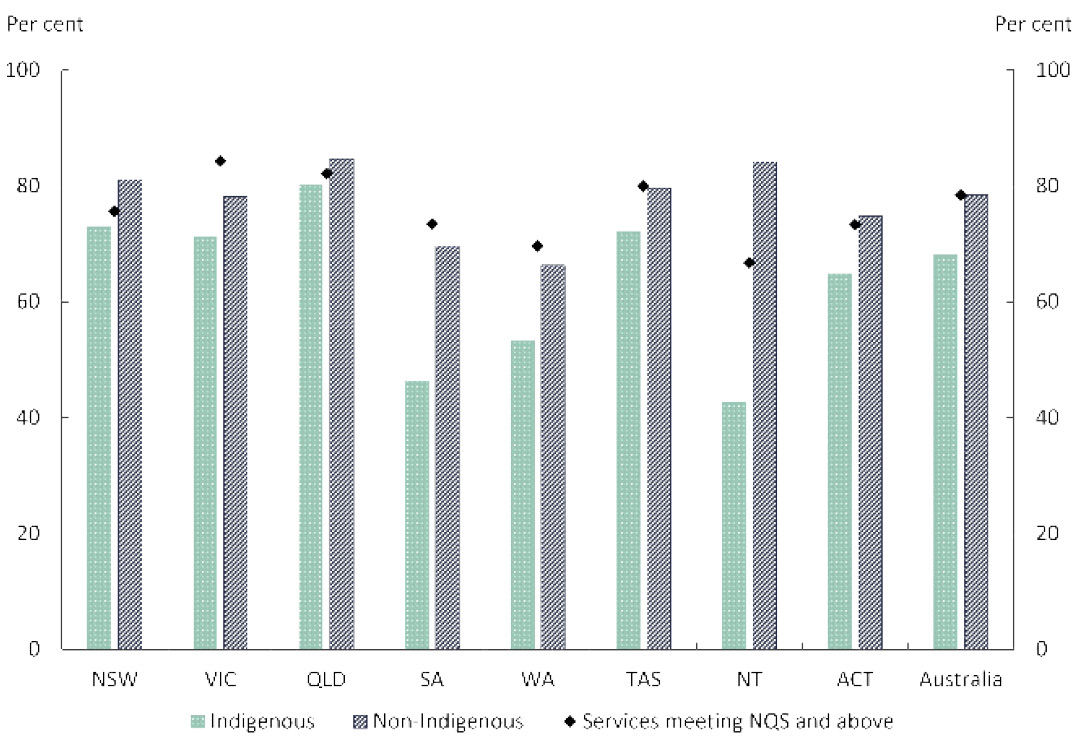
In 2017, the rate of Indigenous children attending 600 hours or more varied from 80% in Queensland to 46% in South Australia and 43% in the Northern Territory. In comparison, the non-Indigenous rates varied from 85% in Queensland to 66% in Western Australia (Figure 2.12).
Figure 2.12: Attendance rates and National Quality Standard (NQS) ratings by jurisdictions
Source: Australian Bureau of Statistics 2018, Preschool Education, Australia, 2017, Cat. No.4240.0, Australian Bureau of Statistics, Canberra; and Australian Children's Education and Care Quality Authority 2018, National Quality Framework Snapshot, Q3, viewed 9 January 2019.
View the text alternative for Figure 2.12.
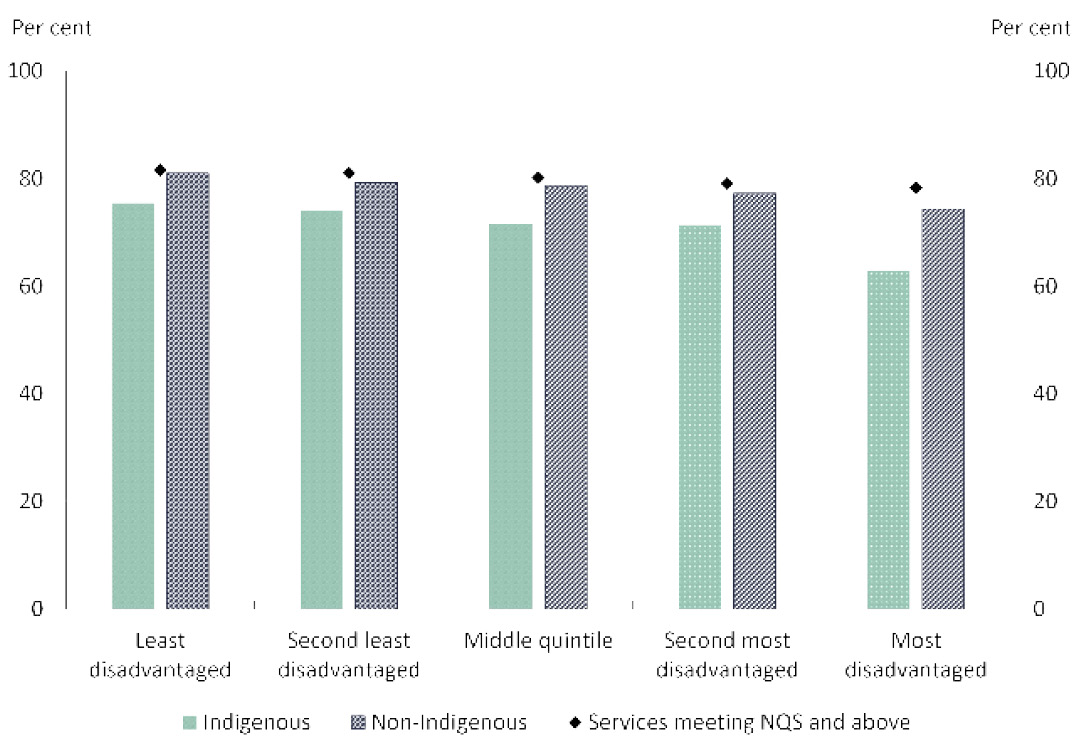
Attendance rates were also lower for children living in areas with higher levels of disadvantage (lower Socio-Economic Indexes for Areas[15] (SEIFA) quintile). For Indigenous children, the 600 hours or more attendance rate varied from 75% in the least disadvantaged areas (top quintile) to 63% in the most disadvantaged areas (bottom quintile) compared with the non-Indigenous rates varying from 81% to 74% from the least to most disadvantaged areas (Figure 2.13). Close to half (45%) of all Indigenous children enrolled in early childhood education lived in the most disadvantaged areas in 2017.
Figure 2.13: Attendance rates (600 hours or more) and NQS ratings by SEIFA
Source: Australian Bureau of Statistics 2018, Preschool Education, Australia, 2017, Cat. No.4240.0, Australian Bureau of Statistics Canberra; and Australian Children's Education and Care Quality Authority 2018, National Quality Framework Snapshot, Q3, viewed 9 January 2019.
View the text alternative for Figure 2.13.
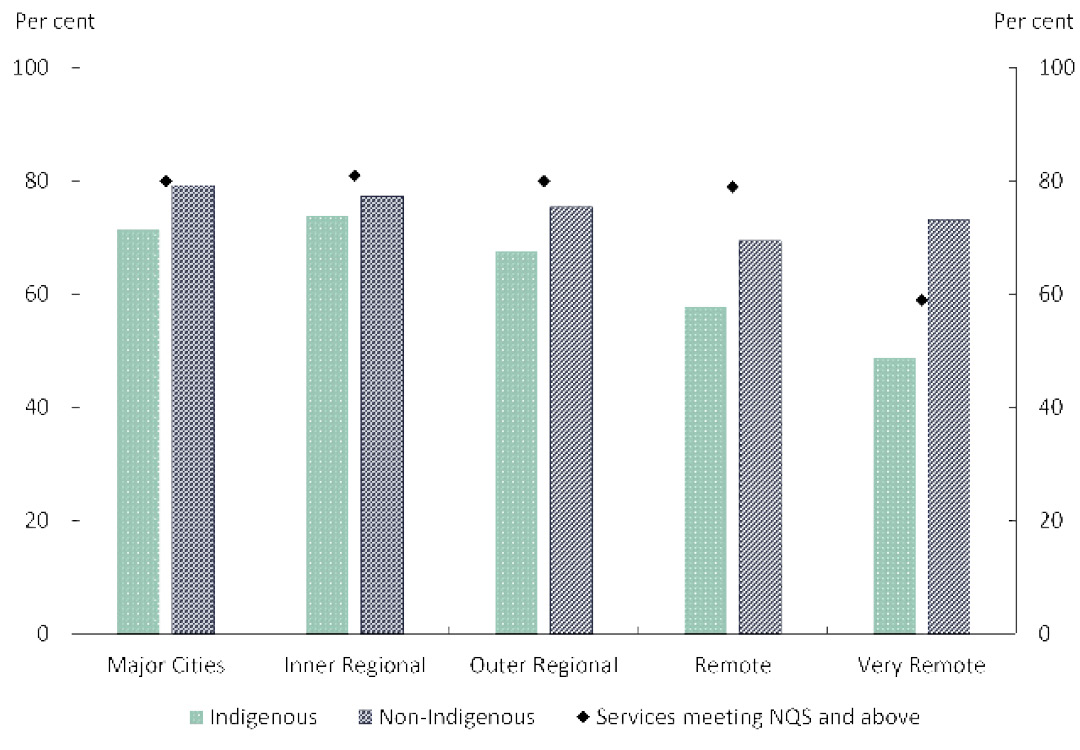
Across remoteness areas, the Indigenous children attending 600 hours or more varied from 71% in Major Cities and 74% in Inner Regional areas to 49% in Very Remote areas. In comparison, the non-Indigenous rate varied from 79% in Major Cities and 77% in Inner Regional areas to 69% in Remote areas and 73% in Very Remote areas (Figure 2.14).
Figure 2.14: Attendance rates (600 hours or more) and NQS ratings by remoteness
Source: Australian Bureau of Statistics 2018, Preschool Education, Australia, 2017, Cat. No.4240.0, Australian Bureau of Statistics, Canberra; and Australian Children's Education and Care Quality Authority 2018, National Quality Framework Snapshot, Q3, viewed 9 January 2019.
View the text alternative for Figure 2.14.
Quality of early childhood education programs is one of the key factors influencing the variation in the early childhood education attendance rates, as noted in a recent AIHW report (AIHW 2018b). In Australia, state and territory regulatory authorities undertake quality assessments against the National Quality Standard (NQS) for approved services under the National Quality Framework (NQF). Based on assessments against seven quality areas of the NQS, services are assigned one of the following as the overall rating – ‘significant improvement required’, ‘working towards the NQS’, ‘meeting the NQS’, ‘exceeding NQS’ and ‘excellent’.
By 30 September 2018, 14,880 early childhood education services (94%) had received a quality rating. Of these, 78% were rated at ‘meeting NQS' (service provides quality education and care in all seven quality areas) or above (ACECQA 2018). This means that nearly a quarter (22%) of services were in need of improvement towards fully meeting the requirements of providing a quality learning environment under the NQS.
The spread of NQS ratings across locations suggests some association between the proportion of services meeting quality standards and early childhood education of 600 hours or more attendance rates.
Across jurisdictions, the proportion of services rated as ‘meeting NQS or above’ (Meeting NQS or Exceeding NQS or Excellent rating) varied from 84% in Victoria and 82% in Queensland to 73% in South Australia, 70% in Western Australia and 67% in the Northern Territory (Figure 2.12). The most disadvantaged areas tended to have a slightly lower proportion of services rated as meeting NQS or above ratings (78% in the most disadvantaged areas to 82% in the least disadvantaged areas) (Figure 2.13). There was some variation in quality ratings by remoteness – with only 59% of services in Very Remote areas receiving ‘meeting NQS’ or above ratings compared with around 80% of services in other remoteness areas[16] (ACECQA 2018) (Figure 2.14).
Quality early childhood education encourages children’s development. Recent evidence from the Northern Territory has linked preschool attendance to children’s developmental readiness for school as measured by the Australian Early Development Census (AEDC) (Menzies 2018). While Indigenous children had the lowest rates of preschool attendance compared with non-Indigenous children, increasing their level of preschool attendance was estimated to have a larger effect on their school readiness.
The AEDC is a triennial data collection that reports on development for children in their first year of full‑time schooling. It provides a ‘check point’ for children’s physical health and wellbeing, social competence, emotional maturity, language and cognitive skills, as well as communication skills and general knowledge. Together the five domains of early childhood development measured by the AEDC provide information about early childhood development before their first year of full-time school.
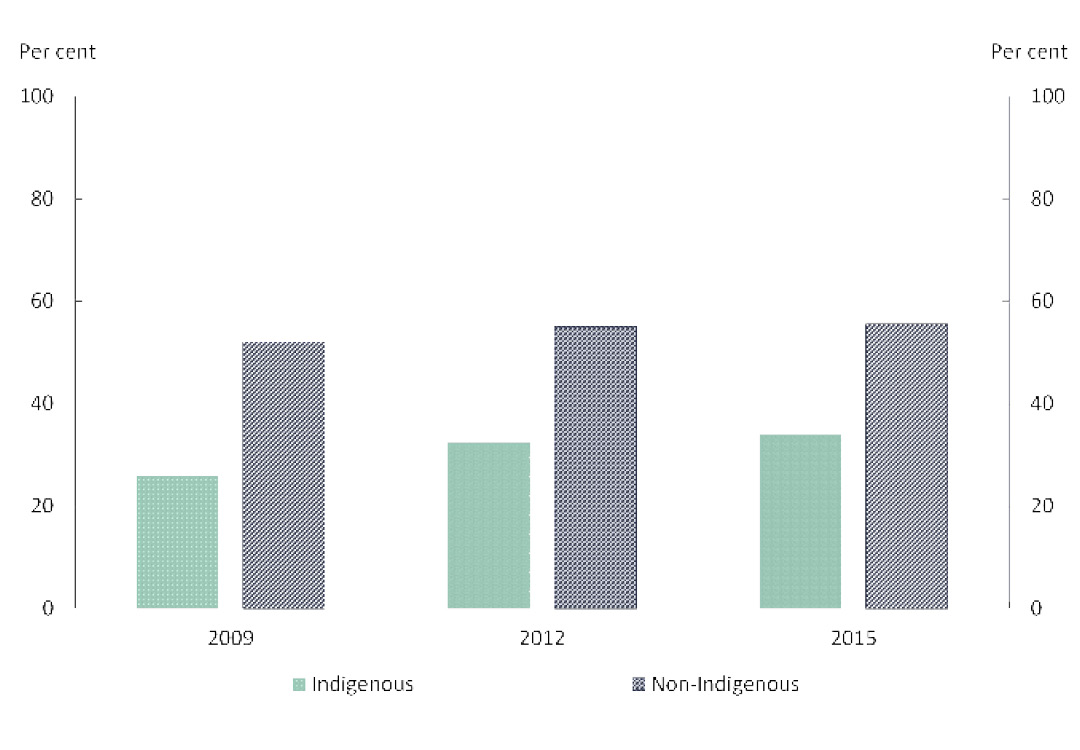
In 2015, 34% of Indigenous children in their first year of full-time schooling were assessed as being on track across all five domains (Figure 2.15). This was an 8 percentage point improvement on the share of Indigenous children on track in 2009. The improvement in outcomes over this period was driven in part by an increase in the share of Indigenous children starting school on track in terms of their language and cognitive skills (increasing from 48% in 2009 to 63% in 2015).
This improvement in AEDC outcomes between 2009 and 2015 also coincided with an increase in preschool enrolments. For Indigenous children, less than 8 out of 10 children in the year before full‑time schooling were enrolled in preschool in 2011 (the first year national data are available). By 2015, preschool enrolment had increased to over 9 out of 10 Indigenous children (DET 2017).
Figure 2.15: Share of children starting school developmentally on track on all five domains
Source: Department of the Prime Minister and Cabinet 2018 analysis of Australian Early Development Census, unpublished data.
View the text alternative for Figure 2.15.
Minister for Indigenous Health and Ageing, Ken Wyatt and Nola Marino MP catch up with Jobe Gidgup and Lyric Gidgup at the launch of the New Directions Mothers and Babies service provided by South West Aboriginal Medical Service in Bunbury WA.
Translating policy into action
The Australian Government invests in a range of universal and targeted programs to support early childhood development. This includes:
- Ensuring the best start in life. Evidence shows that early childhood is the period when the foundations are established for children to develop physically and cognitively, form secure attachments and build healthy social, emotional and communication skills. Efforts that focus on the first three years are the most likely to support positive change across the life-course. The Australian Nurse-Family Partnership Program is a voluntary, evidence based and nurse-led program to provide regular home visits to mothers to provide valuable information and support. The New Directions Mothers and Babies Services provides access to antenatal care, information, assistance and monitoring.
- Access to early childhood education (preschool). Over $3.7 billion of funding has been made available through a series of National Partnership agreements since 2008 to support states and territories ensure that every child has access to a quality preschool education for 600 hours (15 hours a week) in the year before school.
- Supporting families to engage with early learning and care services. Having a clear focus on the health, safety and development of children in the first five years will not only achieve the new Closing the Gap targets, but support change in the trajectories for the next generation.
- Access to childcare. The Community Child Care Fund aims to increase childcare participation, particularly for children living in disadvantaged communities.
- Integrating early childhood health, education and family support services. The Connected Beginnings program provides Aboriginal and Torres Strait Islander children and families with holistic support and timely access to existing services so that children meet the learning and development milestones necessary for a positive transition to school.
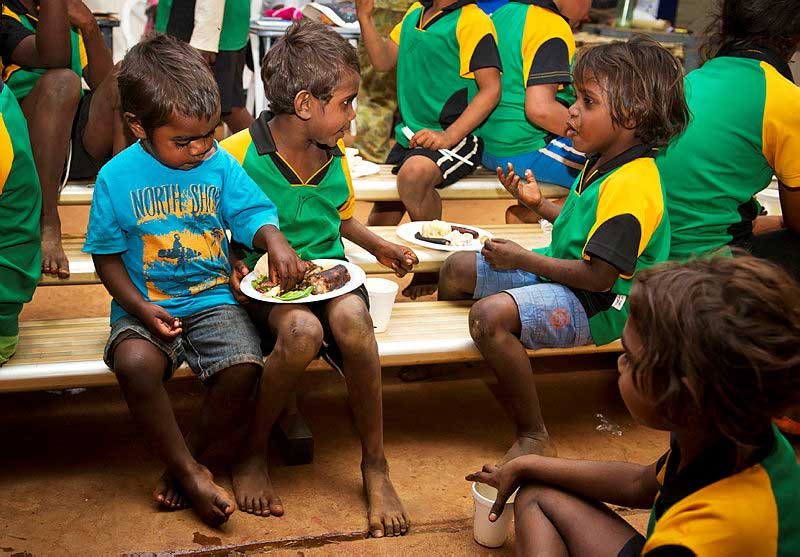
The Canteen Creek and Wutunugurra communities, 1,200km south of Darwin in the Northern Territory, were part of the Australian Defence Force Parliamentary Program.
What are the areas for further development?
The Australian Government will continue to work across agencies, with state and territory governments, experts and other stakeholders and Aboriginal and Torres Strait Islander Australians to:
- Continue to address antenatal and perinatal risk factors to reduce infant mortality.
- Improve preschool attendance rates to ensure that all children are participating the full 15 hours a week.
- Reinforce educational gains made in preschool by supporting parents to provide a stimulating and safe home environment and build complementary skills to enhance the healthy development of children including physical health, social and emotional abilities, language and communication.
All levels of government work with Aboriginal and Torres Strait Islander people, families and communities to improve outcomes for children. A long-term focus on early childhood development can also deliver a return on investment through reduced service dependency, reduced health and justice interventions and improved education and employment participation.
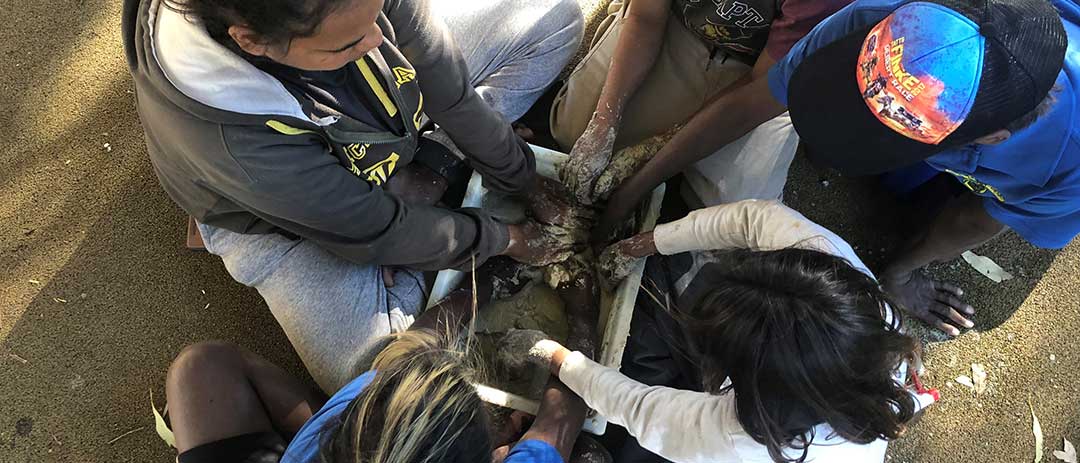
In Ntaria (Hermannsburg), the Kids Club uses play to develop critical skills that children who may have experienced trauma struggle with. Kids Club is funded as part of Stronger Communities for Children, a place based, community development program designed to ensure that communities have a real say in what services they need and how they are delivered. Communities develop their own plan to implement locally designed service responses to positively engage families in the region.
Local solutions
In Cape York, the Apunipima Cape York Health Council Baby One program has been hugely successful, resulting in the majority of women attending five or more antenatal visits and the majority of children being immunised. Culturally appropriate care is provided in women's homes by local community based Aboriginal and Torres Strait Islander health workers.
In Mossman, Queensland, a part time Indigenous Health Worker supports pregnant women to attend appointments such as scans, antenatal care, and diabetes education. As a result, women are making contact with the health system earlier in their pregnancy, which is associated with better birth outcomes. Last year, 63% of Indigenous women had attended their first antenatal visit by week 13 of gestation. For the past two years, 100% of the babies are born at a healthy birthweight, and there has been a marked decrease in smoking.
In Ceduna, Ngura Yardurirn Children and Family Centre is the lead provider for the Connected Beginnings program. The collaboration with the Ceduna Koonibba Health Service Aboriginal Corporation provides tailored support to families with children aged 0-4 years to ensure health care in the early years is provided prior to commencing school.
[3] The child mortality rate is defined as the number of deaths among children aged 0-4 as a proportion of the total number of children in that age group, presented as a rate per 100,000.
[4] ABS Death Registrations collection is the source for the data. Data are reported for New South Wales, Queensland, South Australia, Western Australia and the Northern Territory only, which are considered to have adequate levels of Indigenous identification suitable to publish.
[5] In this chapter, significant change denotes statistically significant change only. The word significant has not been used in any other sense.
[6] References to per cent change in mortality rates in this chapter are derived through linear regression analysis, and statistical significance is tested at 95% level of significance. For details on the specifications for the child mortality indicator used in this report, refer to the NIRA data specifications on the Australian Institute of Health and Welfare (AIHW) METeOR website.
[7] Five years of data are combined for more detailed reporting of Indigenous child and infant mortality to overcome the volatility in rates associated with the small numbers involved.
[8] The perinatal period commences at 20 completed weeks (140 days) of gestation and ends 28 completed days after birth.
[9] In this box on Improvements in Indigenous maternal health and child birth outcomes, because of the differences in the age structures of the Indigenous and non-Indigenous populations, all data are age standardised to enable comparisons. Five or more antenatal care visits and pre-existing health conditions data are based on women who gave birth at 32 weeks or more gestation (excluding unknown gestation). Trend data exclude Victoria and Western Australia. Trend data on antenatal visits in the first trimester exclude New South Wales due to a change in data collection practice introduced in 2011. Victoria started collecting smoking data in 2009.
[10] The National Early Childhood Education and Care Collection was an outcome of the 2010 National Information Agreement on Early Childhood Education and Care between Commonwealth, state and territory authorities, and aims to provide nationally consistent and comparable early childhood education data.
[11] Estimated population eligible for enrolment in the year before full-time school.
[12] The census date for the 2017 Collection is Friday 4 August 2017, with the one-week reference period spanning 31 July 2017 to 6 August 2017. Some jurisdictions may adopt a two-week reference period that includes the census week.
[13] Single year of age estimated resident population and population projections may be subject to errors that cannot be adjusted for in the calculation of population estimates. Tasmania and the Australian Capital Territory have relatively small Aboriginal and Torres Strait Islander populations compared to the other jurisdictions which means year-to-year variability in single year of age populations may be more pronounced. This may result in year-to-year variability of the rate of preschool enrolment in these jurisdictions and should be used with caution.
[14] Percentage point differences are based on unrounded figures.
[15] The SEIFA index used is the Index of Relative Socio-economic Disadvantage (IRSD) which only includes measures of relative disadvantage.
[16] ACECQA excludes Family Day Care services from SEIFA and remoteness classifications because their operation is not specific to one location. 'Meeting NQS or above' combines services that have received an overall rating of 'meeting NQS', 'exceeding NQS' or 'excellent’.