The National Indigenous Australians Agency (NIAA) strives to consolidate and build on our Agency’s culture and champion a proactive organisational stance towards gender equality. Gender equality is integral to an inclusive workplace and benefits everyone. Workplace gender equality is linked to a country’s overall economic performance, enhanced organisational ability to attract talent and retain employees and improved organisational productivity.
To assess how well the Agency is upholding its commitment, we conduct an annual analysis of gender-based pay using data and insights from the APS Remuneration Survey, which informs the APS Remuneration Report, an annual overview of pay across the Australian Public Service.
The most recent internal analysis shows that NIAA’s gender pay gap was 9.0% at December 2025, a 0.2% percentage increase from 2024. This was calculated based off the Australian Public Service’s (APSC’s) primary gender pay gap calculation using an average (mean) base salary metric.
Figure 1 – NIAA Gender Pay Gap Trend by Classification (2023 – 2025)
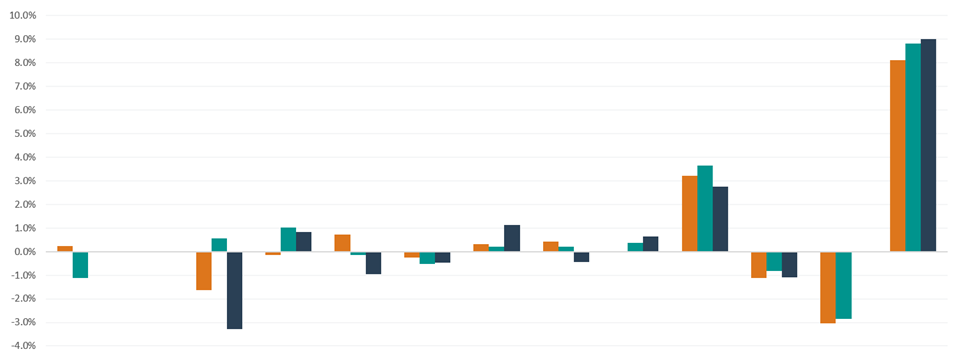
| Year | Graduate | APS1 | APS2 | APS3 | APS4 | APS5 | APS6 | EL1 | EL2 | SES1 | SES2 | SES3 | NIAA |
|---|---|---|---|---|---|---|---|---|---|---|---|---|---|
| 2023 | 0.2% | 0.0% | -1.6% | -0.1% | 0.7% | -0.2% | 0.3% | 0.4% | 0.0% | 3.2% | -1.1% | -3.0% | 8.0% |
| 2024 | -1.1% | 0.0% | 0.6% | 1.0% | -0.2% | -0.5% | 0.2% | 0.2% | 0.4% | 3.6% | -0.8% | -2.8% | 9.1% |
| 2025 | 0.0% | 0.0% | -3.3% | 0.8% | -1.0% | -0.5% | 1.1% | -0.5% | 0.7% | 2.8% | -1.1% | 0.0% | 9.0% |
Analysis indicates that NIAA’s gender pay gap is currently 9.0%.
Variations in figures reported by WGEA and NIAA are due to differences in calculation methodologies.
Drivers of the Gender Pay Gap at the NIAA
The gender pay gap does not mean men are paid more than women for doing the same job. All our staff are entitled to the same employee benefits and leave provisions regardless of gender. For us, our pay gap is reflective of the different classification profiles of women and men in the Agency. Men are more likely to be employed at the SES and EL levels, while women are more likely to be employed at the EL and APS levels – a trend which is seen across the APS. However, our gender pay gap data is somewhat impacted by the large number of female employees we have. This means more women are employed at the APS level than men, while more men are employed at the EL level than women. This results in an increase in the average male salaries when compared to the average female salaries.
Due to the high proportion of women in our workforce, combined with the APS-wide trend of women more frequently accessing part-time work arrangements, this further contributes to the lower average earnings among female employees. At NIAA, women at the EL level were more likely to work part-time than their APS level counterparts. At the SES level, 3.6% of women worked part-time, equal to the APS-wide figure for SES women.
Trends
Women in NIAA continue to be more likely than men to work part-time, though the overall proportion has declined slightly from 20.2% to 16.6% since 2022. While part-time work is most common among women at lower classification levels across the APS, NIAA women at the EL are more likely to work part-time than their APS peers.
Men, on the other hand, show consistently low engagement in part-time work, particularly at senior levels, with no NIAA men at the SES level working part-time.
Figure 2 – Part Time Attendance by Classification and Gender (2025)
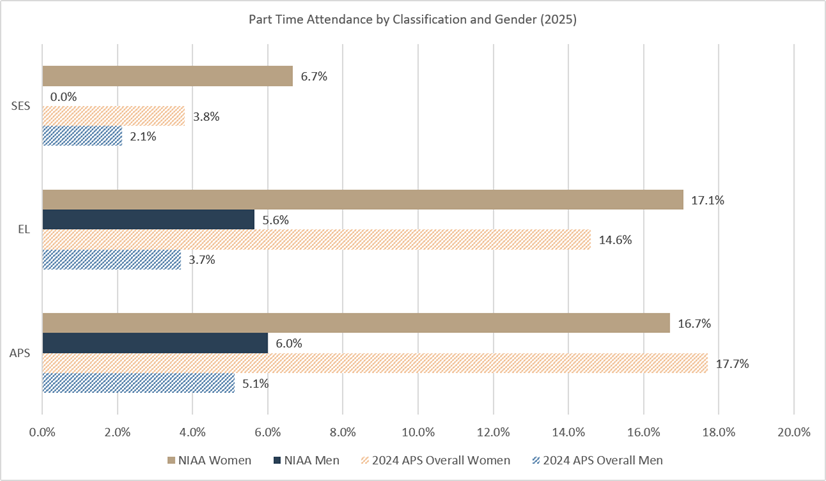
| Category | SES | EL | APS |
|---|---|---|---|
| NIAA women | 6.7% | 17.1% | 16.7% |
| NIAA men | 0.0% | 5.6% | 6.0% |
| APS overall women | 3.8% | 14.6% | 17.7% |
| APS overall men | 2.1% | 3.7% | 5.1% |
Note: APS equivalent data for 2026 is not yet available at time of publishing.
Next Steps for NIAA
We pride ourselves on having a work environment that is diverse in its talent base and being able to foster an
inclusive workplace culture where the unique perspectives, creativity and strengths of all employees can shine.
Whilst we have achieved a lot and are proud of the progress we have made, we recognise that there is additional
work that is needed to continue creating a more equitable working environment. The NIAA Gender Equality
Strategy 2024-27 is the mechanism that will allow us to continue making meaningful change.
To maintain momentum and sustain our progress achieving gender equality in a meaningful and impactful way, we need:
- Visible and committed senior leadership on the issue of gender equality.
- Corporate teams and staff networks to ensure internal policies and initiatives to reflect gender equality and are fit for purpose whilst maintaining employee engagement.
- Gender equality to be prioritised and viewed as critical to driving high performance and a positive workplace culture.
To ensure this Strategy is truly inclusive, we will prioritise the intersectionality of gender identity with other diverse identity groups including First Nations peoples, culturally and linguistically diverse backgrounds, people living with a disability, and LGBTQIA+SB groups. This will be supported through the Strategy’s alignment with the broader NIAA Diversity and Inclusion Framework 2024–27. Our Gender Equality Action Plan is agile, adaptable and will be reviewed as we evolve as an agency. The actions account for how different genders may be impacted differently by various factors and were developed through a gendered lens where we took existing differences between all genders into consideration.