Demographic context
The estimated resident Aboriginal and Torres Strait Islander population of Australia as at 30 June 2011 was 669,881 people (ABS, 2013a). Using population projections for 2017, the Indigenous population was estimated to be 761,300 people, representing 3.1% of the Australian population. This proportion varies from region to region—from 29% of the population of the NT to 0.9% of the population of Victoria (see Table 1) (ABS, 2014c).
When the data are analysed as a proportion of the Indigenous population, the projected results for 2017 show that 31% of all Aboriginal and Torres Strait Islander peoples live in NSW, 29% live in Qld, 13% in WA and 10% in the NT (see Figure 41) (ABS, 2014c).
In 2011, around 79% of Indigenous Australians lived in regional and metropolitan areas. While only 14% of Indigenous Australians lived in very remote areas, they made up a large proportion of Australians living in very remote areas (45%) (see Table 2).
The age structure of the Aboriginal and Torres Strait Islander population is significantly younger than the non‑Indigenous population (see Figure 42). In 2011, the median age for Indigenous Australians was 22 years compared with 38 years for non‑Indigenous Australians. In 2011, 36% of Indigenous Australians were aged 0–14 years compared with 18% of non‑Indigenous Australians. The younger age structure also represents a tremendous opportunity. With well-designed and competently delivered antenatal care and early childhood programmes, along with effective timely interventions helping young adults to adopt healthy lives, there is an opportunity to reduce the gap in long-term health outcomes. While it is vital that the focus is on ensuring improvement of health for Aboriginal and Torres Strait Islander peoples across their life course, it is important to take account of demographic composition in planning for resource requirements and service delivery for Aboriginal and Torres Strait Islander peoples.
While the Indigenous population is young relative to the non‑Indigenous population, it is also gradually ageing. In 2011, 36% of the Indigenous population was aged under 15 years, down from 38% in 2006. This is projected to decrease further to 32% in 2026. The share of the Indigenous population that is of workforce age (15–64 years) has risen from 58.6% in 2006 to 60.7% in 2011, and is projected to increase slightly to 61.2% in 2026. In contrast, the total Australian working age population (aged 15–64 years) was estimated to be 66.9% of the total population in 2012. This is projected to decrease to 63.6% by 2026.
The proportion of Indigenous people aged 65 years and over has increased from 3.0% in 2006 to 3.4% in 2011 and is projected to almost double to 6.4% from 2011 to 2026. A gradual demographic shift in the age profile of the Indigenous population will also have implications for service delivery, particularly for services aimed at older Indigenous Australians including aged care and planning for diseases such as cancer and dementia. The total Australian population aged 65 years and over was estimated to be 14.2% of the total population in 2012. This is projected to increase to 17.7% by 2026.
Figure 41
Aboriginal and Torres Strait Islander population by state and territory, 2017
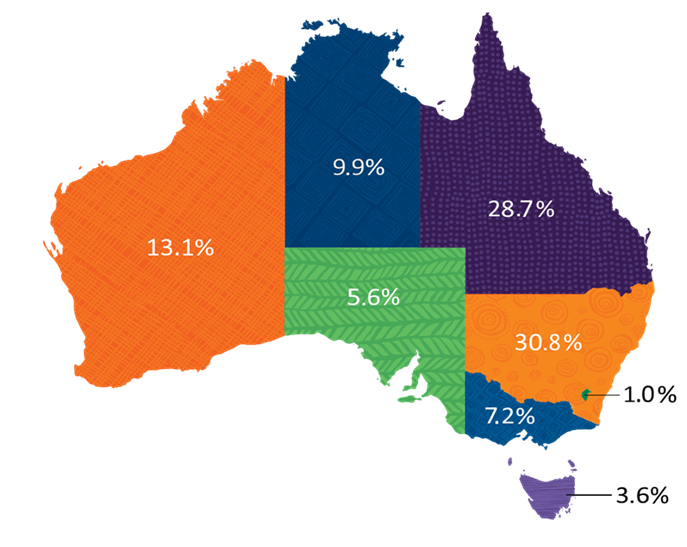
Source: ABS population projections based on the 2011 Census (ABS, 2014)
Table 1
Projected population by jurisdiction and Indigenous status, 2017
| Number of Indigenous population by jurisdiction | Indigenous population % by jurisdiction (a) | Number of total population by jurisdiction(b) | Indigenous population as % of jurisdiction population | |
|---|---|---|---|---|
| New South Wales | 234,699 | 30.8 | 7,795,072 | 3.0 |
| Victoria | 55,073 | 7.2 | 6,146,277 | 0.9 |
| Queensland | 218,448 | 28.7 | 5,059,620 | 4.3 |
| South Australia | 42,406 | 5.6 | 1,744,656 | 2.4 |
| Western Australia | 99,697 | 13.1 | 2,835,948 | 3.5 |
| Tasmania | 27,682 | 3.6 | 525,336 | 5.3 |
| Northern Territory | 75,692 | 9.9 | 257,368 | 29.4 |
| Australian Capital Territory | 7,310 | 1.0 | 413,633 | 1.8 |
| Australia* | 761,300 | 100.0 | 24,781,121 | 3.1 |
(a) See Figure 18
(b) Indigenous plus non-Indigenous
* Australia total includes ‘other Territories’
Source: ABS population projections (Series B) based on the 2011 Census (ABS, 2014)
Table 2
Estimated resident population by remoteness area and Indigenous status, 2011
| Number of Indigenous Australians | Indigenous as % of total population | Indigenous as % of total Indigenous population | |
|---|---|---|---|
| Major cities | 233,146 | 1.5 | 34.8 |
| Inner regional | 147,683 | 3.6 | 22.0 |
| Outer regional | 146,129 | 7.2 | 21.8 |
| Remote | 51,275 | 16.3 | 7.7 |
| Very remote | 91,648 | 45.1 | 13.7 |
| Australia | 669,881 | 3.0 | 100.0 |
Source: ABS population estimates based on 2011 Census (ABS, 2013a)
Figure 42
Age distribution of Aboriginal and Torres Strait Islander peoples and non-Indigenous Australians, by Indigenous status and sex, 2017 (projections)
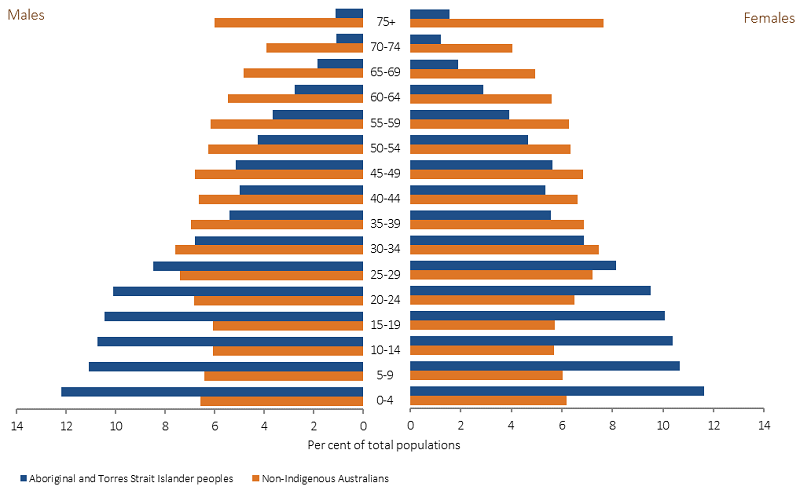
Source: AIHW analysis of ABS population estimates based on 2011 Census (unpublished)