1.23 Leading causes of mortality
Page content
Why is it important?
Mortality rates are a useful measure of the overall health status of a population, particularly to compare one population with another or to measure improvements over time. The gap between the Aboriginal and Torres Strait Islander population and the rest of the Australian population for particular causes of death provides an indication of the prevention, prevalence and management of particular diseases for Aboriginal and Torres Strait Islander peoples. This provides a useful indication of the diseases that have a greater impact on Aboriginal and Torres Strait Islander peoples. However, some significant health problems will not be reflected in mortality statistics; many conditions that cause serious health problems may not be fatal (such as depression, arthritis and disability) and so do not appear as common causes of death. As health status and health services improve for Aboriginal and Torres Strait Islander peoples, it is anticipated that premature mortality will reduce over time.
Findings
During the period 2011–15, in the five jurisdictions with adequate quality data (NSW, Qld, WA, SA and the NT), the most common cause of death among Aboriginal and Torres Strait Islander peoples was circulatory diseases (24% of all deaths), followed by neoplasms (including cancer) (21%) and external causes (15%). Circulatory diseases and cancer were the most common cause of death for non-Indigenous Australians. After adjusting for age, circulatory diseases accounted for the largest gap in death rates (24% of the gap), followed by endocrine, metabolic and nutritional disorders (including diabetes) (19%); neoplasms (including cancer) (15%); and respiratory diseases (12%). Deaths due to diabetes alone were 5.6 times higher for Indigenous Australians than for non-Indigenous Australians and a leading cause of the gap for females. The pattern of the leading causes of Indigenous deaths were similar across jurisdictions. The leading cause contributing to the gap was circulatory diseases in NSW, Qld, WA and the NT, while in SA it was endocrine, metabolic and nutritional disorders (including diabetes).
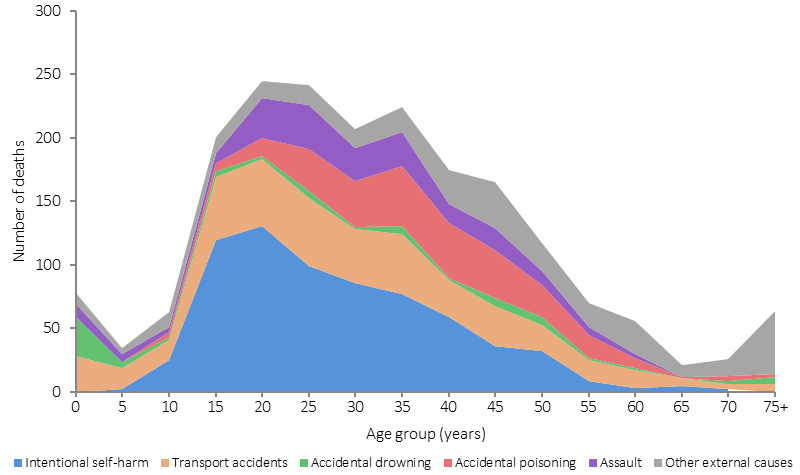
For Indigenous Australians, the leading causes of death due to external causes were suicide (35%), transport accidents (22%), accidental poisoning (14%), assault (10%) and accidental drowning (5%). Around 56% of these deaths were for people aged between 15 and 39 years. For non-Indigenous Australians external causes made up 6% of all deaths. The leading external causes of death were suicide (29%), accidental falls (19%) and transport accidents (15%).
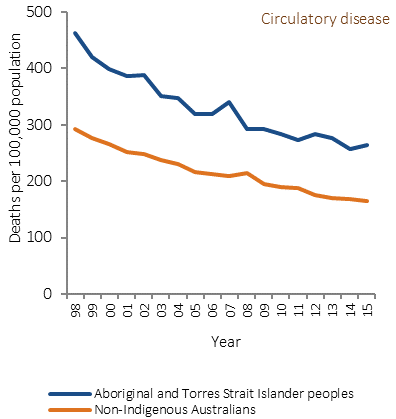
Mortality rates for circulatory diseases showed the largest decline in deaths for both Indigenous Australians and non-Indigenous Australians. Between 1998 and 2015 there was a significant decline of 43% in death rates due to circulatory diseases for Indigenous Australians. A study in the NT found that while there was an increase in incidence of acute myocardial infarction between 1992 and 2004 for Aboriginal and Torres Strait Islander peoples, at the same time there was an improvement in survival due to reductions in death both pre-hospital and after hospital admission (You et al, 2009).
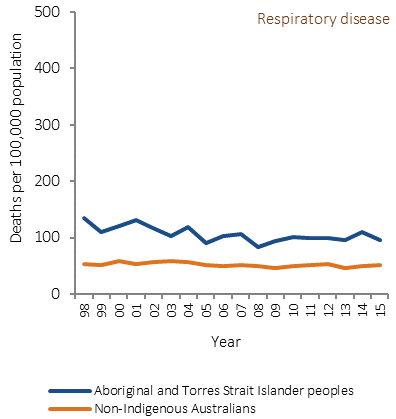
Between 1998 and 2015 there was a significant decline in mortality rates due to respiratory diseases for Indigenous Australians (by 24%).
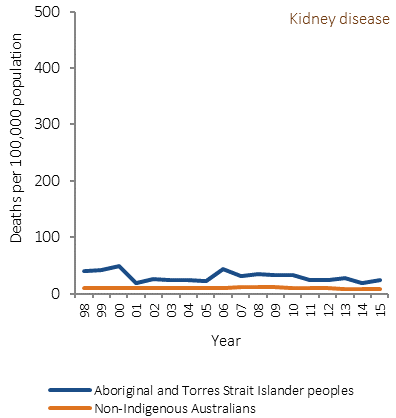
For kidney disease mortality there was a significant decrease in both the Aboriginal and Torres Strait Islander mortality rate and the gap (over the period 2006 to 2015).
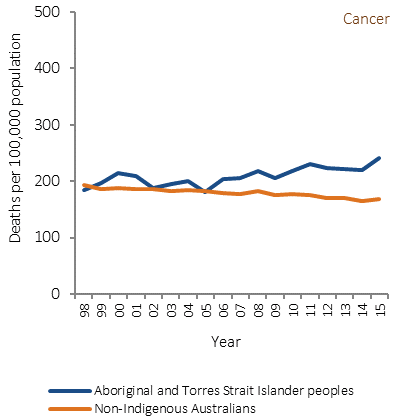
Since 2006 there has been a significant increase in the age-standardised mortality gap due to cancer, reflecting an increase in mortality rates for Indigenous Australians and a decrease in rates for non-Indigenous Australians.
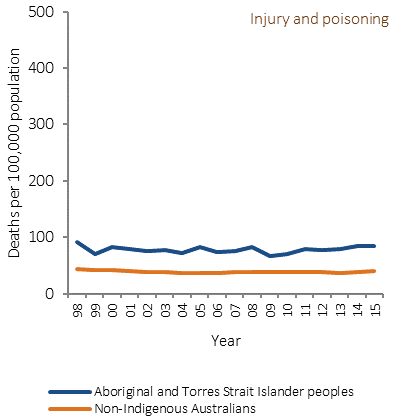
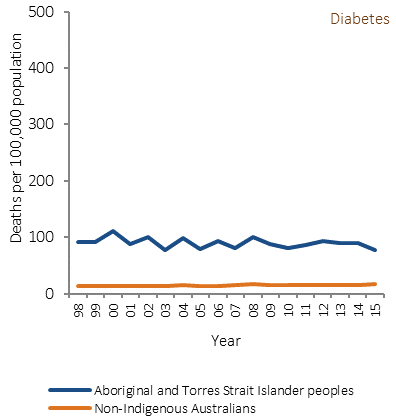
For injury deaths, there was no significant reduction in short-term trends, or in the longer-term. No significant changes were detected for diabetes mortality rates or the gap in diabetes mortality between Indigenous and non-Indigenous Australians.
Figures
Table 1.23-1
Causes of death, by Indigenous status, NSW, Qld, WA, SA and the NT, 2011–15
Underlying cause of death |
Per cent of deaths | Age-standardised deaths per 100,000 persons | Ratio | Gap | % of total gap | ||
|---|---|---|---|---|---|---|---|
| Indigenous | Non-Indigenous | Indigenous | Non-Indigenous | ||||
| Circulatory diseases | 24.0 | 30.0 | 271.4 | 173.3 | 1.6 | 98.1 | 23.8 |
| Neoplasms | 21.4 | 29.9 | 232.1 | 171.6 | 1.4 | 60.6 | 14.7 |
| External causes | 15.2 | 6.2 | 81.3 | 38.4 | 2.1 | 42.9 | 10.4 |
| Endocrine, metabolic & nutritional disorders | 8.8 | 3.9 | 100.6 | 22.5 | 4.5 | 78.1 | 19.0 |
| Diabetes | 7.6 | 2.7 | 87.3 | 15.5 | 5.6 | 71.7 | 17.4 |
| Respiratory diseases | 8.3 | 8.7 | 100.6 | 50.3 | 2.0 | 50.3 | 12.2 |
| Digestive diseases | 5.5 | 3.5 | 46.0 | 20.2 | 2.3 | 25.8 | 6.3 |
| Nervous system diseases | 2.5 | 4.9 | 26.1 | 28.6 | 0.9 | -2.5 | -0.6 |
| Infectious and parasitic diseases | 2.5 | 1.8 | 20.8 | 10.3 | 2.0 | 10.6 | 2.6 |
| Kidney diseases | 2.0 | 1.6 | 24.0 | 9.2 | 2.6 | 14.8 | 3.6 |
| Conditions originating in perinatal period | 2.0 | 0.3 | 4.7 | 2.3 | 2.0 | 2.4 | 0.6 |
| Other causes | 7.8 | 9.1 | 84.1 | 53.3 | 1.6 | 30.8 | 7.5 |
| All causes | 100.0 | 100.0 | 991.7 | 580.0 | 1.7 | 411.7 | 100.0 |
Source: ABS and AIHW analysis of National Mortality Database
Figure 1.23-1
Deaths of Indigenous Australians from external causes of injury and poisoning, by age, NSW, Qld, WA, SA and the NT, 2011–15
Source: ABS and AIHW analysis of National Mortality Database
Table 1.23-2
Detailed causes of death for circulatory disease, cancer and respiratory disease, by sex, Aboriginal and Torres Strait Islander peoples, NSW, Qld, WA, SA and the NT, 2011–15
| Underlying cause of death | Males | Females | Total | |||
|---|---|---|---|---|---|---|
| Deaths | % | Deaths | % | Deaths | % | |
| Circulatory diseases | ||||||
| Ischaemic heart disease | 1,135 | 64.0 | 607 | 44.2 | 1,742 | 55.3 |
| Acute myocardial infarction | 406 | 22.9 | 271 | 19.7 | 677 | 21.5 |
| Cerebrovascular disease | 225 | 12.7 | 301 | 21.9 | 526 | 16.7 |
| Stroke | 180 | 10.1 | 249 | 18.1 | 429 | 13.6 |
| Other heart disease | 251 | 14.1 | 271 | 19.7 | 522 | 16.6 |
| Hypertension disease | 70 | 3.9 | 75 | 5.5 | 145 | 4.6 |
| Rheumatic heart disease | 38 | 2.1 | 70 | 5.1 | 108 | 3.4 |
| Other | 55 | 3.1 | 50 | 3.6 | 105 | 3.3 |
| Total circulatory diseases | 1,774 | 100.0 | 1,374 | 100.0 | 3,148 | 100.0 |
| Neoplasms (includes cancer, by site of neoplasm) | ||||||
| Digestive organs | 470 | 32.4 | 315 | 23.3 | 785 | 28.0 |
| Bowel | 106 | 7.3 | 91 | 6.7 | 197 | 7.0 |
| Pancreatic | 73 | 5.0 | 71 | 5.3 | 144 | 5.1 |
| Respiratory and intrathoracic organs | 403 | 27.8 | 351 | 26.0 | 754 | 26.9 |
| Trachea, Bronchus and Lung | 372 | 25.7 | 341 | 25.3 | 713 | 25.5 |
| Breast | 3 | np | 168 | 12.4 | 170 | 6.1 |
| Lymphoid, haematopoietic and related tissue | 90 | 6.2 | 74 | 5.5 | 164 | 5.9 |
| Female genital organs | - | 0.0 | 155 | 11.5 | 155 | 5.5 |
| Cervix | - | 0.0 | 59 | 4.4 | 59 | 2.1 |
| Lip, oral cavity and pharynx | 110 | 7.6 | 41 | 3.0 | 151 | 5.4 |
| Male genital organs | 88 | 6.1 | - | 0.0 | 88 | 3.1 |
| Non-malignant neoplasms | 18 | 1.2 | 31 | 2.3 | 49 | 1.8 |
| Other | 105 | 7.2 | 95 | 7.0 | 200 | 7.1 |
| Total neoplasms | 1,449 | 100.0 | 1,350 | 100.0 | 2,799 | 100.0 |
| Respiratory diseases | ||||||
| Chronic lower respiratory diseases | 386 | 68.1 | 371 | 70.7 | 757 | 69.3 |
| COPD | 336 | 59.3 | 312 | 59.4 | 648 | 59.3 |
| Asthma | 14 | 2.5 | 28 | 5.3 | 42 | 3.8 |
| Pneumonia and influenza | 105 | 18.5 | 82 | 15.6 | 187 | 17.1 |
| Other | 76 | 13.4 | 72 | 13.7 | 148 | 13.6 |
| Total respiratory diseases | 567 | 100.0 | 525 | 100.0 | 1,092 | 100.0 |
Source: ABS and AIHW analysis of National Mortality Database
Figure 1.23-2
Age-standardised mortality rates for selected causes of death, by Indigenous status, NSW, Qld, WA, SA and NT, 1998 to 2015
Source: ABS and AIHW analysis of National Mortality Database
Implications
In 2015, chronic conditions accounted for approximately 70% of Indigenous deaths and 77% of the gap in mortality between Indigenous and non-Indigenous Australians (including circulatory diseases, diabetes, cancer, kidney and respiratory diseases). In the period 1998–2015 there was a significant decline in Indigenous mortality due to chronic diseases. Non-Indigenous chronic disease mortality rates also declined over this period, so there was no significant change in the gap. External causes such as suicide and transport accidents are also important contributors to the gap in mortality; however, there have been no significant changes in these deaths since 1998.
The health system can contribute to sustained improvements, in partnership with Aboriginal and Torres Strait Islander peoples, through identification of Indigenous clients, health promotion, early detection, chronic disease management and specialist and acute care to treat the more severe health outcomes. A recent study of the gap in life expectancy between Indigenous and non-Indigenous Australians in the NT found socio-economic disadvantage was the leading factor accounting for one-third to one-half of the gap (Zhao et al, 2013a). Another recent study found chronic disease mortality increased with remoteness, reflecting differentials in health care and socio-economic status across areas. This finding was consistent across Australia and within most states and territories (Chondur et al, 2014).
Improved management of chronic diseases can prevent the development of life-threatening complications but cannot cure these diseases. For example, a study of incidence and survival of acute myocardial infarction found improvements in survival for the NT Indigenous population associated with pre-hospital management of conditions. Also within-hospital specialised coronary care services and greater emphasis on post-hospital management was a factor in improved survival rates (You et al, 2009). Another study in the NT found the largest gains for the Indigenous population in avoidable mortality were for conditions amenable to medical care, but only marginal change for potentially preventable conditions such as lung cancer, chronic liver disease and cirrhosis, and motor vehicle accidents (Li, SQ et al, 2009).
The 20–24 year age group had the highest number of deaths from suicide while deaths due to transport accidents were highest in the 25–29 year age group. Acute care services can save the lives of seriously injured people, and there is scope for improvements in timely access to life-saving emergency care for Indigenous Australians. High levels of intentional self-harm highlight the need for cross-sectoral approaches to healing, self-esteem and social and emotional wellbeing (see measure 1.18).
Closing the gap in life expectancy between Aboriginal and Torres Strait Islander peoples and other Australians within a generation has been adopted as a target by COAG. In the nine years since the target was set there have been some improvements for Aboriginal and Torres Strait Islander peoples (decline in mortality rates and life expectancy has increased). However, this target is not on track to be met. Some health interventions which are targeted at closing the gap take time to have measurable impacts upon populations, including interventions aimed at reductions in population level smoking rates, which take five years to impact on heart disease and up to 30 years for cancer. Improvements in educational attainment will take 20 to 30 years to impact on early deaths from chronic disease in the middle years.
The results signal the need for significant and concerted efforts to continue improving Indigenous health outcomes, both directly through health interventions and by addressing the cultural and social determinants of health.
A description of policies and strategies relating to this measure are included in the Policies and Strategies section.