2.07 Employment
Page content
Why is it important?
Participation in employment has important consequences for health, social and emotional wellbeing and living standards for individuals, families and communities (Bambra, 2011; Gray, M et al, 2014). Conversely, being sick or disabled, or looking after someone in poor health acts as a barrier to labour force participation (Belachew & Kumar, 2014).
Studies of the social gradient of health demonstrate that characteristics of employment (such as occupation, job security and control) affect health outcomes (Marmot, 2015). Health risks from being unemployed include the impact on a person’s mental health and stress related health impacts such as heart disease (Wilkinson & Pickett, 2009); material deprivation for necessities such as food security, safe neighbourhoods and adequate housing (Bambra, 2011) and the effects from adopting unhealthy coping behaviours (Dooley et al, 1996). Experiencing extended and/or repeated periods of unemployment compound these effects. International studies highlight the poorer health and lower life expectancy experienced by populations experiencing high unemployment following economic slowdown (Taulbut et al, 2013).
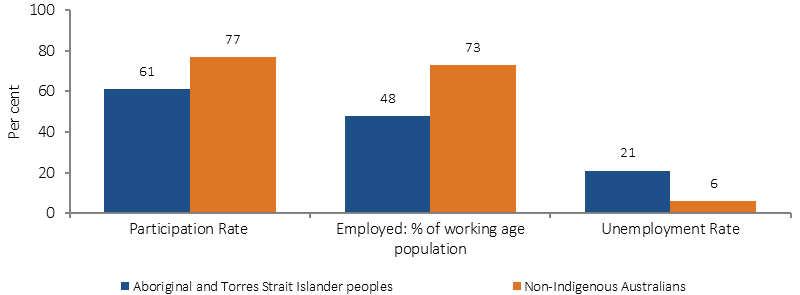
The ‘labour force’ comprises all people who are either ‘employed’ or ‘unemployed’ (see Glossary). The ‘labour force participation rate’ is the number of people in the labour force as a proportion of the working age population (15–64 years). The ‘unemployment rate’ is the number of unemployed people as a proportion of the labour force. The ‘employment rate’, is employed people as a proportion of people aged 15–64 years.
Findings
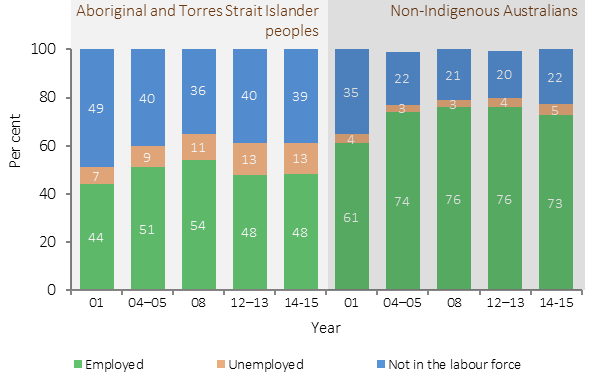
In the 2014–15 Social Survey, 61% of Indigenous Australians of working age (15–64 years) were in the labour force; compared with 77% of non-Indigenous Australians (from the 2014 Survey of Education and Work). The proportion of Indigenous Australians of working age who were not in the labour force has increased from 36% in 2008 to 39% in 2014–15.
In 2014–15, 48% of the Indigenous working age population were employed. This was a decline from 2008 where the employment rate peaked at 54% but an overall increase from 1994 (38%). The non-Indigenous employment rate also declined between 2008 and 2014 (from 75% to 73%) and the gap has not changed significantly (21 percentage points in 2008 and 24 percentage points in 2014–15). The declines since 2008 occurred in the context of a general softening in the Australian labour market.
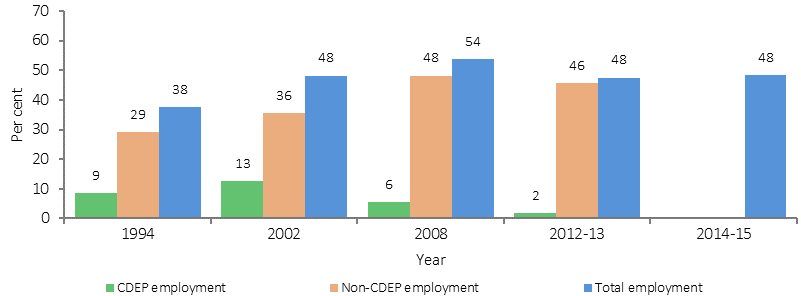
Trend data are also impacted by Indigenous Australians participating in the Community Development Employment Program (CDEP), which accounted for almost half of all employment in very remote areas in 2008, but by 2012–13 accounted for just over one-quarter of the total, and has now ceased. When CDEP is excluded, there is no significant change in the Indigenous employment rate nationally between 2008 and 2014–15 (48.2% and 48.4% respectively).
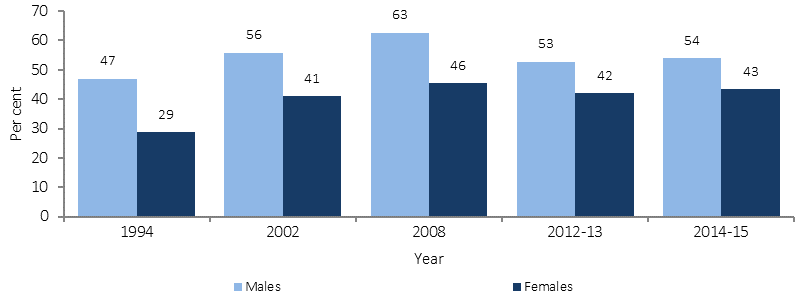
The employment rate for Indigenous males of working age (15–64 years) fell from 63% to 54% between 2008 and 2014–15. However, when CDEP is excluded, there was no change (55% to 54%). Over the same period, there was no change in the employment rate for Indigenous females (46% compared with 43%; and excluding CDEP: 42% compared with 43%). Employment rates were higher for Indigenous males (54%) than females (43%) in 2014–15, though the difference between Indigenous men and women has declined (from 17 percentage points in 2008 to 11 percentage points in 2014–15).
There was a decrease in employment for males in the 15–17 year old age group (from 36% in 2008 to 21% in 2014–15). The proportion of Indigenous youth aged 17–24 years who were fully engaged in study or work was 42% in 2014–15; about half the non-Indigenous rate (74%). Rates of Indigenous youth fully engaged ranged from 58% in major cities to 15% in very remote areas. There is a strong link between education and employment—at high levels of education there is virtually no employment gap between Indigenous and non-Indigenous Australians.
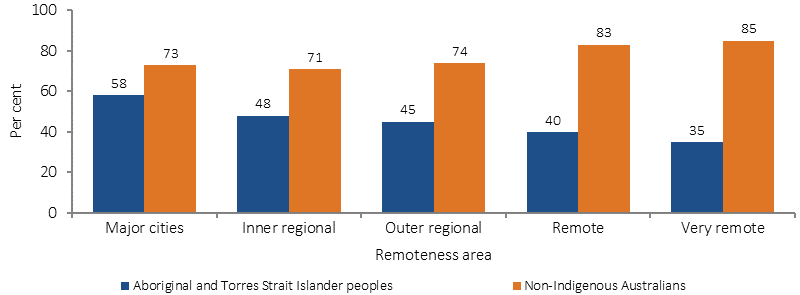
In 2014–15, the employment rate for Indigenous Australians was highest in major cities (58%), followed by 48% in inner regional areas. The lowest rate was in very remote areas (35%). Compared with non-Indigenous Australians, the highest overall employment gap in 2014–15 was in the NT (46 percentage points) followed by WA (37 percentage points). These jurisdictions also had the lowest Indigenous employment rates.
In 2012–13, Indigenous Australians were less likely to be employed as professionals (13% of those employed) compared with 23% of non-Indigenous; and were more likely to work as labourers (19%) or as community and personal service workers (18%). Nearly 26% of employed Indigenous Australians worked in the public sector compared to 16% of non-Indigenous Australians. Conversely, Indigenous Australians were less likely to be employed in the private sector (74% compared with 84%), accounting for essentially all of the gap. The largest employment gaps for Indigenous Australians were in the retail and manufacturing sectors. In 2014–15, 60% of employed Indigenous Australians were employed full-time.
The unemployment rate for Indigenous Australians was 21% in 2014–15, an increase of 4 percentage points from 2008, and 3.6 times the non-Indigenous unemployment rate of 6%. Of Indigenous Australians aged 18–64 years who were unemployed in 2014–15, 37% had been unemployed long-term (12 months or more). In 2014–15, 92% of unemployed Indigenous Australians aged 15-64 years reported having difficulties finding work. Main issues reported were no jobs in local area or line of work (41%), transport problems/distance (32%), not having a driver’s licence (31%) and insufficient education/training skills (30%). For those not looking for work, the main reasons given were childcare (22%), studying or returning to study (20%) and having a long-term health condition or disability (18%). In 2014–15, 40% of unemployed Indigenous Australians reported high/very high levels of psychological distress; a higher rate than those who were employed (24%). Many of those not in the labour force are still engaged in productive activities supporting their community (Altman et al, 2005). The unemployment rate for Indigenous Australians aged 15–64 years who provided unpaid assistance to a person with a disability (24%) was almost 4 times that for non-Indigenous carers (6%).
Figures
Figure 2.07-1
Labour force status of persons aged 15–64 years by Indigenous status, 2014–15
Source: AIHW and ABS analysis of 2014–15 NATSISS and 2014 SEW
Figure 2.07-2
Employment rate by Indigenous status persons aged 15–64 years, by remoteness, 2014–15
Source: AIHW and ABS analysis of 2014–15 NATSISS and 2014 SEW
Figure 2.07-3
Employment rate, Indigenous Australians aged 15–64 years, by sex, 1994 to 2014–15
Source: ABS and AIHW analysis of NATSIS 1994, NATSISS 2002, 2008 and 2014–15, AATSIHS (core component) 2012–13
Figure 2.07-4
Employment rate, Indigenous Australians aged 15–64 years, 1994 to 2014–15
Source: ABS and AIHW analysis of NATSIS 1994, NATSISS 2002, 2008 and 2014–15, AATSIHS (core component) 2012–13
Table 2.07-1
Labour force status of Indigenous Australians aged 15–64 years, by remoteness, 2014–15
| Labour force status | Non-remote | Remote | Australia |
|---|---|---|---|
| Per cent | |||
| In the labour force (participation rate) | 64 | 51 | 61 |
| Total employed | 52 | 37 | 48 |
| Employed Full-time | 31 | 22 | 29 |
| Employed Part-time | 21 | 15 | 19 |
| Unemployed (% of total population) | 13 | 14 | 13 |
| Unemployment rate (% of labour force) | 20 | 28 | 21 |
| Not in the labour force | 36 | 49 | 39 |
| Total | 100 | 100 | 100 |
Source: ABS and AIHW analysis of 2014–15 NATSISS
Figure 2.07-5
Labour force status of persons aged 15–64 years, by Indigenous status, 2001, 2004–05, 2008, 2012–13 and 2014–15
Source: ABS and AIHW analysis of NHS/NATIHS/AATSIHS 2001, 2004–05, 2007–08, 2012–13; NATSISS, 2008, 2014–15; SEW 2012 and 2014
Implications
A review of available evidence found that approaches with potential to increase Indigenous employment include: a strong macro economy supporting jobs growth; increasing skill levels; pre-employment assessment and training; intensive assistance for job seekers; non-standard recruitment strategies; support for retention; wage subsidies and Indigenous employment goals in government programmes (Gray, M et al, 2012; Gray, M & Hunter, 2016).
Detailed descriptions of the following mainstream and Indigenous specific employment strategies are in the Policies and Strategies section of the report.
Mainstream employment services, in urban and regional locations, provide support and assistance to around 88,000 Indigenous job seekers through: Jobactive, DES, Transition to work and the Community Development Programme.
The Jobs, Land and Economy Program complements mainstream employment services and programs, increasing employment, business and economic development through the Vocational Training and Employment Centres initiative, the Employment Parity Initiative, and the Tailored Assistance Employment Grants. The programme also provides continued support of Indigenous rangers; Indigenous cadetships; and Indigenous Enterprise Development. The Indigenous Procurement Policy, supports increased Government contracts with majority-owned Indigenous businesses.