3.21 Expenditure on Aboriginal and Torres Strait Islander health compared to need
Page content
Why is it important?
A basic principle of equity is that health expenditure should reflect the relative needs for health services (Whitehead 1992; Braveman 2003). Health expenditure for population groups with higher levels of need should be proportionately higher. A broad assessment of how well this principle is implemented is provided by comparing differentials in health status with differences in per capita health expenditure.
Findings
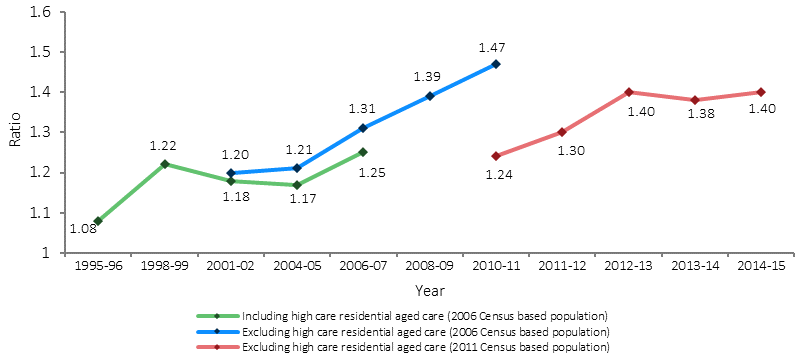
From 2010–11 to 2014–15 Australian governments’ health expenditure per Indigenous Australian grew by 23%. Detailed expenditure data is available for 2013-14. On a per person basis, average health expenditure for Aboriginal and Torres Strait Islander peoples in 2013–14 was estimated to be $8,515, which was $1.38 for every $1.00 spent per non-Indigenous Australian.
During 2013–14, Australian governments provided an estimated 77% of the funding used to pay for health goods and services for Aboriginal and Torres Strait Islander peoples compared with 68% for non-Indigenous Australians. Those on lower incomes rely more on publicly provided services and spend less money on private services than people with higher incomes, and are much more likely to present to hospitals, even for primary health care (Deeble 2009). For Indigenous Australians, expenditure on hospitals was 6 times the expenditure for medical services (e.g. MBS services provided by a medical practitioner) compared with 2 times for non-Indigenous Australians. This reflects different usage patterns and costs.
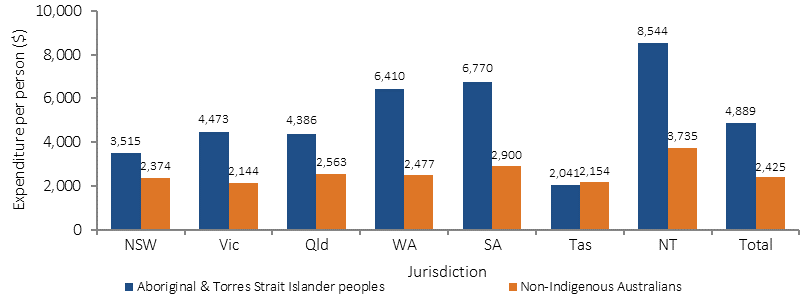
In 2013-14, the proportion of total Australian Government health funding for Indigenous Australians use of medical services and medication was low compared to non-Indigenous Australians and higher for community health services. Per-person funding provided by the Australian Government for Aboriginal and Torres Strait Islander peoples was $3,261 compared with $2,698 for non-Indigenous Australians, a ratio of 1.21 to 1. Per-person expenditure provided by state and territory governments for Aboriginal and Torres Strait Islander peoples was $4,889 compared with $2,425 for non-Indigenous Australians, a ratio of 2.0:1, with the greatest expenditure in public hospitals followed by community health services.
Estimated expenditure per Aboriginal and/or Torres Strait Islander person by state and territory governments varies across jurisdictions, with the highest expenditures per person in the NT. Most variation between jurisdictions may be explained by differences in the proportion of Indigenous Australians within the jurisdiction living in remote and very remote areas. For the main health programmes, in 2013–14, expenditures were an estimated $7,604 per Indigenous Australian in remote and very remote areas compared with $3,991 in outer and inner regional areas and $3,987 in major cities. The higher expenditures in rural and remote areas are largely related to hospital services and grants to Indigenous health services, and partly reflects higher costs of delivering health care services in those areas (AIHW 2013d).
In 2013-14, MBS and PBS expenditure per person was higher for non-Indigenous Australians than for Indigenous Australians across all remoteness areas. The gap for expenditure between Indigenous and non-Indigenous Australians was greatest in outer and inner regional areas and was smallest in remote and very remote areas. (see measure 3.15).
Hospitals separations expenditure by disease is available for 2012–13. The Indigenous per person expenditure was higher than non-Indigenous for hospital separations due to mental and behavioural disorders; endocrine, nutritional and metabolic diseases; and injuries. However, expenditure for non-Indigenous Australians was higher than for Indigenous Australians for treatment of musculoskeletal and connective tissue disorders; and neoplasms (including cancer). For expenditure on potentially preventable hospital separations, the greatest difference is attributable to diabetes, cellulitis, chronic obstructive pulmonary disease and convulsions and epilepsy.
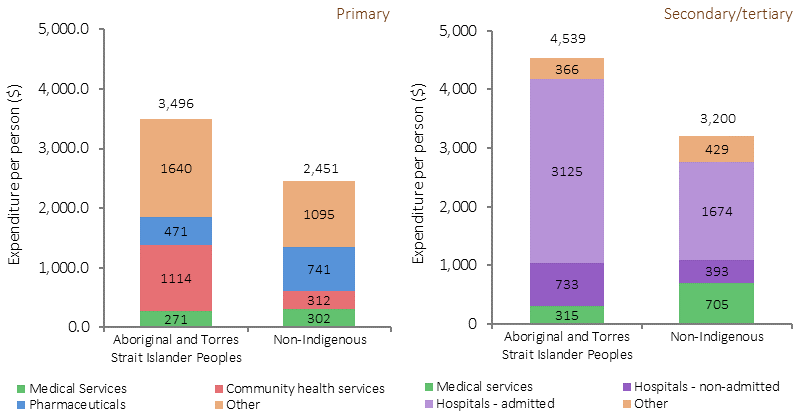
In 2013–14, expenditure for primary health care services was $3,496 per person for Aboriginal and Torres Strait Islander peoples compared with $2,451 for non-Indigenous Australians. Primary health care expenditure on medical services, including those paid through the MBS, was $271 per person for Aboriginal and Torres Strait Islander peoples compared with $302 for non-Indigenous Australians. Per person expenditure on pharmaceuticals in the primary care sector was also much lower for Aboriginal and Torres Strait Islander peoples ($471 versus $741). Per person expenditure on community health services was 3.6 times higher for Indigenous Australians—$1,114 per person compared with $312 per person for non-Indigenous Australians. Community health expenditure accounted for $786 million in 2013–14 or 32% of total primary health care expenditure for Indigenous Australians.
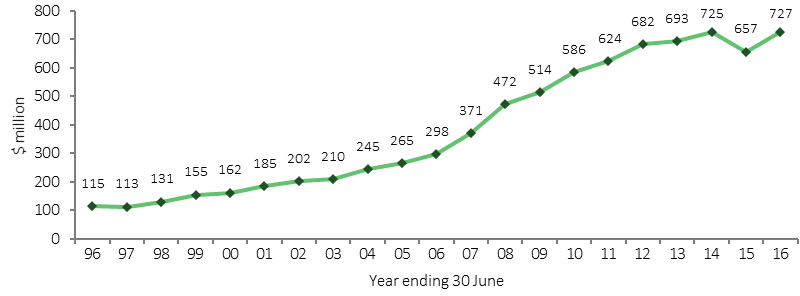
Australian Government Indigenous specific health programme expenditure through the Department of Health has increased from $115 million in 1995–96 to $727 million in 2015–16, a growth in real terms of 284%.
In 2013–14, expenditure for secondary and tertiary health care services was $4,539 per person for Indigenous Australians compared with $3,200 for non-Indigenous Australians. Hospital expenditure is the largest single expenditure item in secondary/tertiary health care services, accounting for $3,858 per Indigenous Australian. Expenditure on secondary/tertiary care medical services (mainly specialist care) was estimated to be $315 per person for Aboriginal and Torres Strait Islander peoples compared with $705 per person for non-Indigenous Australians.
Figures
Figure 3.21-1
Estimated per person health expenditure ratio of Indigenous to non-Indigenous Australians, 1995–96 to 2014-15
Source: AIHW Indigenous health expenditure database
Figure 3.21-2
Estimated state and territory health expenditure per person, by Indigenous status, 2013–14
Source: AIHW Indigenous health expenditure database
Figure 3.21-3
Expenditure by the Australian Government on Indigenous specific health programs, nominal $m, 1995–96 to 2015–16
Source: Australian Government Department of Health
Figure 3.21-4
Average health expenditure per person for primary health care and secondary/tertiary health care services, by Indigenous status, 2013–14
Source: AIHW Indigenous health expenditure database
Figure 3.21-5
MBS expenditure per person, Indigenous and non-Indigenous Australians, by remoteness areas of patient’s residence, 2013–14
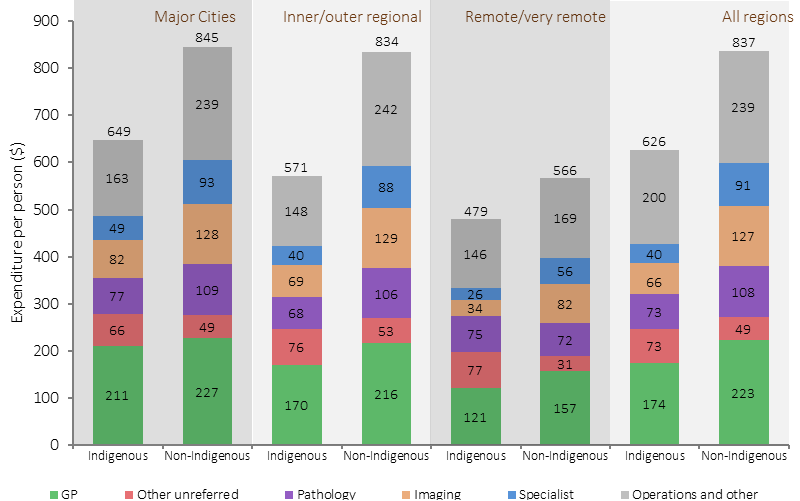
Note: excludes allied health services, optometry and dental services.
Source: AIHW Indigenous health expenditure database
Figure 3.21-6
Health expenditure per person on selected health services(a), Indigenous and non-Indigenous Australians, by remoteness area of patient’s residence, 2013–14
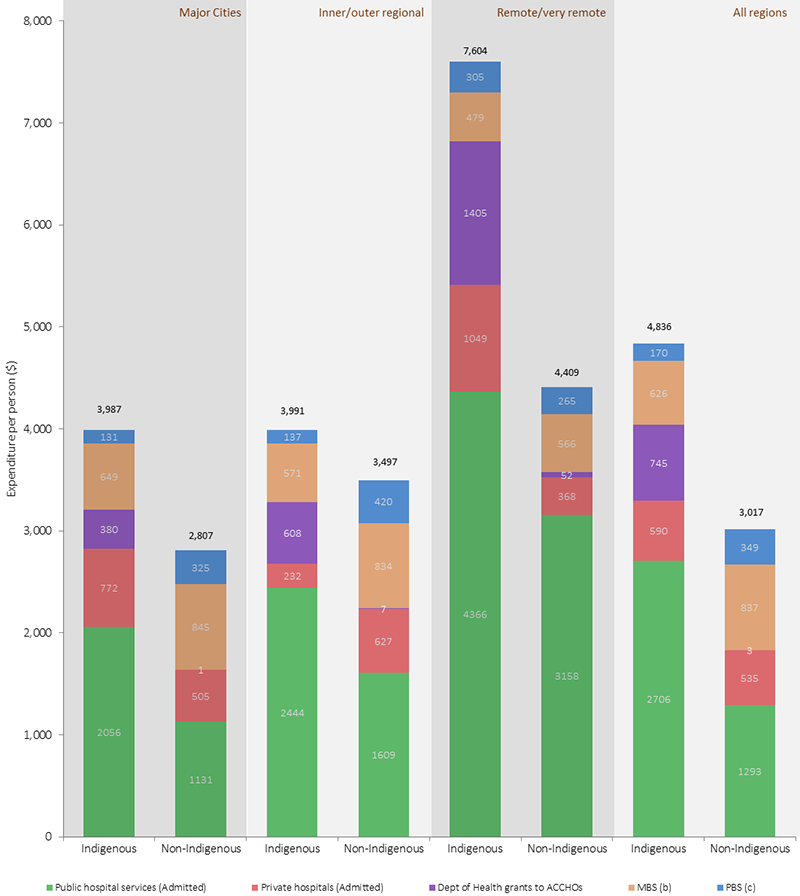
(a) Excludes health expenditure on non-admitted patient services, patient transport, dental services, community health services other than ACCHOs, other professional services, public health, aids and appliances, research and health administration.
(b) MBS excludes allied health services, optometry and dental services.
(c) PBS includes expenditure on benefit paid pharmaceutical only and excludes highly specialised drugs dispensed from public and private hospitals.
Source: AIHW Indigenous health expenditure database
Implications
In 2013–14, 77% of Indigenous health funding was from Australian governments (39% state and territory and 38% Australian Government). On a per person basis, average health expenditure for Indigenous Australians in 2013–14 was 1.38 times that for non-Indigenous Australians. However, Indigenous Australians are currently experiencing a burden of disease and illness 2.3 times the rate of non-Indigenous Australians.
Funding levels for Indigenous health care will continue to grow over the next four years. From 2016–17 to 2019–20, the Australian Government will invest $3.4 billion in Indigenous specific health programmes and activities—an increase of over $600 million compared with 2012–13 to 2015–16. In 2016–17 more than $780 million will be spent on the provision of health programmes specifically for Aboriginal and Torres Strait Islander people.