3.02 Immunisation
Page content
Why is it important?
Immunisation is highly effective in reducing morbidity and mortality caused by vaccine-preventable diseases. Childhood vaccination for diphtheria was introduced in Australia in 1932 and use of vaccines to prevent tetanus, pertussis (whooping cough) and poliomyelitis became widespread in the 1950s, followed by vaccines for measles, mumps and rubella in the 1960s. In more recent years, vaccines have been introduced for hepatitis B, Haemophilus influenza type b, varicella (chicken pox), pneumococcal disease, meningococcal C, rotavirus, human papillomavirus (HPV) and influenza.
Since the introduction of childhood vaccination, deaths from vaccine-preventable diseases have fallen for the general population by 99%. Vaccinations are estimated to have saved some 78,000 lives (Burgess, M, 2003) and have been effective in reducing the disease disparities between Indigenous and non-Indigenous populations, despite differences in the socio-economic circumstances of these populations (Menzies & Singleton, 2009).
Findings
Children
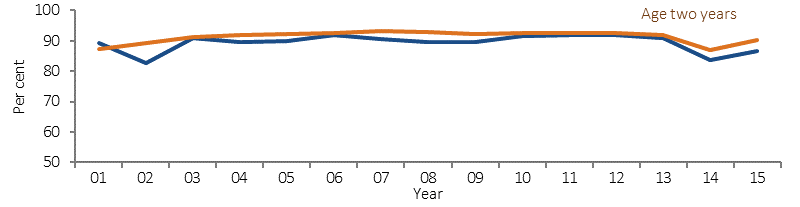
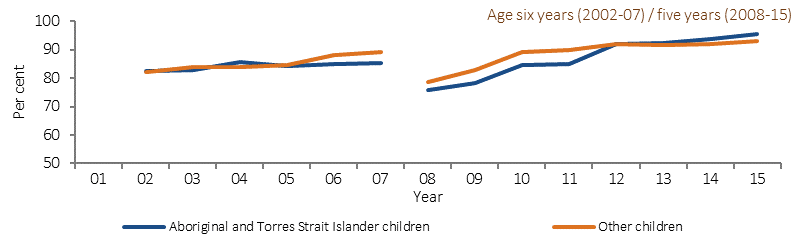
According to the National Immunisation Program (NIP) Schedule, Australian children are expected to have received specific immunisations by 1, 2 and 5 years of age. As at 31 December 2015, vaccination coverage for Aboriginal and Torres Strait Islander children at 1 year of age was 3.7 percentage points lower than other Australian children (89.5% compared with 93.2%). By 2 years of age, the difference was 3 percentage points (87% of Indigenous children compared with 90% for other children). By 5 years of age the Indigenous rate (95%) was slightly higher than for other children (93%). Coverage rates for Indigenous children did not vary greatly by state/territory, particularly by 5 years of age.
Between 2001 and 2015 there was a significant increase in the proportion of fully immunised Aboriginal and Torres Strait Islander 1-year-olds (from 82% to 90%). Over the same period, there was no change detected for 2-year-old children; though this is impacted by a recent increase in the number of vaccines scheduled for this age group. Between 2008 and 2015, there was an increase in the proportion of fully immunised Indigenous children aged 5 years (from 76% to 95%) and also other children that age (from 79% to 93%). Note that the age at which older children are assessed changed from 6 years to 5 years in 2007and comparisons of trends over time are affected by the introduction of new vaccines on the schedule.
Adults
The target group for adult influenza vaccines for the general population is those aged 65 years and over. Due to higher risks, Indigenous Australians are eligible for free vaccines at younger ages (see Implications). In 2012–13, an estimated 57% of Aboriginal and Torres Strait Islander peoples aged 50 years and over had been vaccinated against influenza in the previous 12 months.
Proportions were higher for those living in remote areas compared with non-remote areas (68% and 54% respectively). For the general population, the 2009 Adult Vaccination Survey showed that 75% of those aged 65 years and over had been immunised (AIHW, 2011c).
In 2012–13, 29% of Indigenous Australians aged 50 years and over had been vaccinated against invasive pneumococcal disease in the last 5 years. Again rates were higher for those living in remote compared with non-remote areas (35% and 27% respectively). Coverage in the target group for all Australians aged 65 years and over was 54% in 2009.
Adult vaccinations are also targeted at younger Indigenous Australians who have various risk factors, such as chronic medical conditions. In 2012–13, 28% of Indigenous Australians aged 15–49 years were vaccinated for influenza in the previous year and 10% had received a pneumococcal vaccination in the previous five years. Indigenous adults who had diabetes or circulatory disease were more likely to have had recent vaccinations than those without those diseases.
Figures
Figure 3.02-1
Proportion of children fully vaccinated at age 1 year, 2 years and 5/6 years, NSW, Vic, SA, WA and the NT combined, by Indigenous status, 2001 to 2015
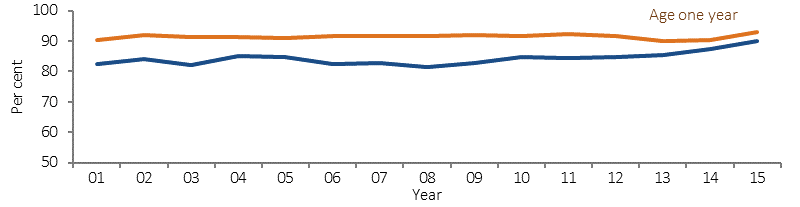
Source: AIHW analysis of Australian Childhood Immunisation Register (ACIR) Medicare Australia data
Table 3.02-1
Proportion of children fully vaccinated at age 1 year, 2 years and 5 years, by Indigenous status and state/territory, at 31 December 2015
| Age 1 Year | Age 2 Years | Age 5 Years | ||||
|---|---|---|---|---|---|---|
| Indigenous | Other | Indigenous | Other | Indigenous | Other | |
| NSW | 92.6 | 93.0 | 88.7 | 89.9 | 95.2 | 93.3 |
| Vic | 91.0 | 93.0 | 86.3 | 90.6 | 95.8 | 93.6 |
| Qld | 87.4 | 93.5 | 88.3 | 91.3 | 94.8 | 92.9 |
| WA | 82.2 | 93.3 | 82.7 | 90.0 | 94.3 | 92.0 |
| SA | 86.3 | 93.8 | 83.4 | 90.5 | 95.1 | 91.8 |
| Tas | 94.7 | 93.0 | 87.7 | 89.4 | 95.0 | 93.7 |
| ACT | 97.9 | 94.9 | 82.9 | 91.9 | 94.1 | 93.4 |
| NT | 94.6 | 91.7 | 88.4 | 89.6 | 96.4 | 90.8 |
| Australia | 89.5 | 93.2 | 87.2 | 90.4 | 95.1 | 93.1 |
Source: AIHW analysis of Australian Childhood Immunisation Register (ACIR) Medicare Australia data
Figure 3.02-2
Immunisation status: Indigenous Australians aged 50 years and over (2012–13) and total persons aged 65 years and over (2009)
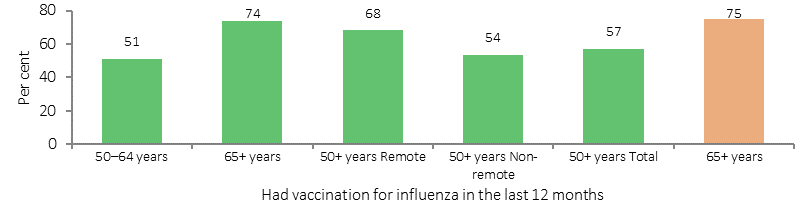
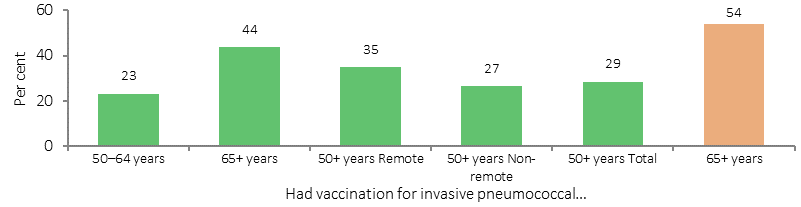
Source: ABS and AIHW analysis of 2012–13 AATSIHS and 2009 Adult Vaccination Survey
Implications
Achieving good immunisation coverage reflects the strength and effectiveness of primary health care. Immunisation coverage rates for Indigenous children are high. While slightly below that of all children at 1 or 2 years of age, by 5 years of age, coverage rates for Aboriginal and Torres Strait Islander children are above that of the general population.
Vaccinations have contributed to reductions in vaccine-preventable diseases in the Indigenous population, such as hepatitis A, invasive pneumococcal disease (IPD), Meningococcal C and Haemophilus influenza type B. However, higher rates of IPD in Indigenous Australians aged 45 years and over, high hospitalisation rates for rotavirus in the NT and higher rates of hepatitis B for Indigenous Australians remain areas for focus (Naidu et al, 2013).
The NIP provides free childhood vaccines to eligible Australians. In addition to the standard childhood schedule, the NIP provides free supplementary vaccines to Indigenous Australians:
- pneumococcal vaccine and hepatitis A vaccine for children in high-risk areas;
- pneumococcal vaccine for persons aged 15–49 years who are medically at risk, and adults aged 50 years and over;
- seasonal influenza vaccine for children aged six months to less than five years, and adults aged 15 years and over.
The National Human Papillomavirus (HPV) Vaccination Program commenced in 2007 for females and was extended to males in February 2013. It is delivered through an ongoing, school-based program to students aged 12–13 years.
Communication activities to support the NIP and HPV include specific components for Indigenous Australians, including tailored resources and social media about the vaccines and eligibility.
Since 2009, the National Partnership Agreement on Essential Vaccines (NPEV) has facilitated incentive payments to state and territory governments upon meeting agreed performance benchmarks. The incentive payments encourage jurisdictions to maintain or increase vaccine coverage for Indigenous Australians.
The Indigenous Australians’ Health Programme has allocated $12 million over two years (from July 2016) to support the implementation of integrated early childhood services: Connected Beginnings, as recommended in Creating Parity—the Forrest Review. The Department of Education has also allocated $30 million over three years to support the program. The funding will support integrated health and education services for children (from pregnancy through to school age) and support family and community engagement for both service streams.
The New Directions: Mothers and Babies Services provide Indigenous children and their mothers with access to antenatal care; information about baby care; practical advice and assistance with breastfeeding, nutrition and parenting; monitoring of developmental milestones, immunisation status and infections; and health checks for Indigenous children before starting school. The 2014–15 Budget allocated $54 million from July 2015 to expand the service.
In WA, Wirraka Maya allocated funding to primary prevention in Aboriginal communities, which included the development of an outreach service to surrounding communities resulting in almost 400 child health checks and 1,000 immunisations per annum.
In SA, the Immunisation Program Strategy was reoriented in 2013 to encompass a state-wide focus on improving coverage rates for Indigenous children in all three cohorts (1, 2 and 5 years of age). Since the programme changes were implemented, immunisation rates for Indigenous children have improved.