2.04 Literacy and numeracy
Page content
Why is it important?
There is a two-way association between health and education. People with low educational attainment tend to have poorer health, fewer opportunities, lower incomes and reduced employment prospects (Johnston et al, 2009). In turn, poor health is associated with lower educational attainment (Conti et al, 2010). Vision and hearing loss (measures 1.15 and 1.16) are associated with linguistic, social and learning difficulties and behavioural problems in school. These problems can lead to reduced educational performance (Hopkins, 2014) and have lifelong consequences for employment, income, and contact with the criminal justice system (Wilkinson & Pickett, 2009) (see measure 2.11).
Early education experiences and school readiness are important as they influence future academic performance. The Australian Early Development Census measures how children are faring as they enter school. Key findings from the 2015 collection indicate that Indigenous children are more than twice as likely as non-Indigenous children to be developmentally vulnerable. In 2015, 42% of Indigenous children were vulnerable on one or more domains, a decline from 2012 (43%) (Dept. of Education & Training, 2016).
Guthridge et al.(2015) investigated the association between early life risk factors and NAPLAN results in a large cohort study of children in the NT. They found that low birthweight is associated with poorer numeracy results for Indigenous children. NAPLAN test results decline with any absence from school and this accumulates over time (Hancock et al, 2013). Low-performing students have a propensity for poor attendance in later years, and are also less likely to complete Year 12 (Hancock et al, 2013).
In December 2007, COAG agreed to a target of halving the gap between the proportion of Indigenous and non-Indigenous students achieving reading, writing and numeracy benchmarks within a decade. In May 2014, COAG agreed to a five-year target of Closing the Gap between Indigenous and non-Indigenous school attendance. School attendance is key to school outcomes for Indigenous students. Around 20% of the gap in school performance between Indigenous 15-year-olds is explained by poorer school attendance by Indigenous students (Biddle, 2014b).
The NAPLAN Minimum Standard represents a performance standard in literacy and numeracy, below which students will have difficulty progressing satisfactorily at school. A recent study found that if Indigenous and non-Indigenous students reach the same level of academic achievement by the time they are 15, there is no significant difference in subsequent educational outcomes such as completing Year 12 and participating in university or vocational training (Mahuteau et al, 2015).
Findings
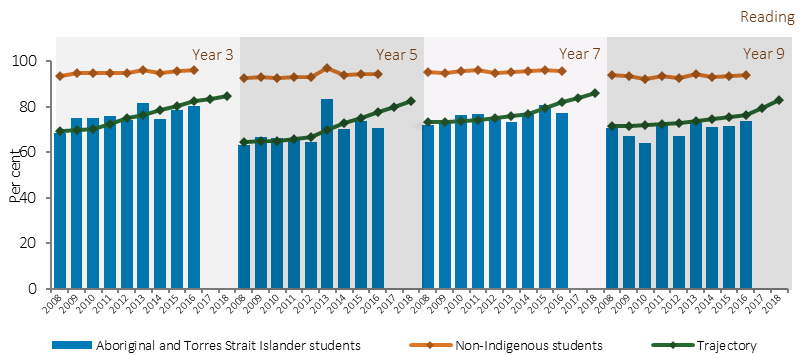
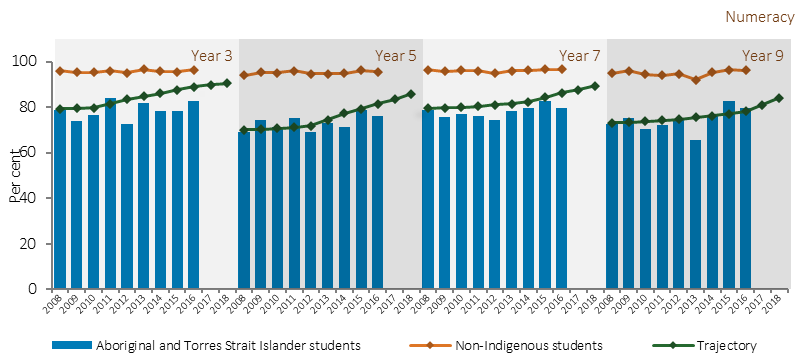
Between 2008 and 2016, the proportion of Indigenous students meeting the National Minimum Standards improved significantly across four of the eight areas (reading and numeracy in Years 3, 5, 7 and 9). Improvements are evident for Years 3 and 5 reading and Years 5 and 9 numeracy.
Another way to assess progress is to see whether the latest results are consistent with the agreed trajectory points for the target. In 2016, NAPLAN results at the national level showed one of the eight areas (Year 9 numeracy) was consistent with the required trajectory points. In the other seven areas, 2016 results were below the required trajectory points.
Around 81% of Indigenous students met the Year 3 national minimum standard in reading, 71% in Year 5, 77% in Year 7, and 74% in Year 9. Around 85% of Indigenous students met the national minimum standard for writing in Year 3, 74% in Year 5, 64% in Year 7, and 53% in Year 9. Around 83% of Indigenous students met the national minimum standard for numeracy in Year 3, 76% in Year 5, 79% in Year 7, and 80% in Year 9. Around 78% of Indigenous students met the national minimum standard for spelling in Year 3, 74% in Year 5, 75% in Year 7, and 70% in Year 9. Around 82% of Indigenous students in Year 3 met the national minimum standard for grammar and punctuation, 74% in Year 5, 70% in Year 7, and 67% in Year 9. The proportion of Aboriginal and Torres Strait Islander students achieving the national minimum standards for each of these areas in all school years tested remain below corresponding proportions for non-Indigenous students.
Proportions of Aboriginal and Torres Strait Islander students achieving literacy and numeracy benchmarks remain lower for students living in remote and very remote areas. This relationship was also evident for non-Indigenous students, but was much less marked, resulting in a much larger gap between Indigenous and non-Indigenous results in remote areas than in metropolitan areas. For example, in 2016, 84% of all Indigenous students in major city areas met or exceeded the national minimum standard for Year 5 numeracy compared with only 42% of Indigenous students in very remote areas.
The 2015 Programme for International Student Assessment (PISA) is an international survey of 15-year-olds. Across mathematical, scientific and reading literacy, Indigenous Australian students had a mean score that equated to around 2–2.5 years of schooling below non-Indigenous students. Around two-thirds of Indigenous students did not reach the national proficiency standard in scientific and reading literacy and three-quarters did not reach the standard in mathematical literacy. There was no significant change in Indigenous students’ scores between 2012 and 2015 in any domain (Thomson, S et al, 2016).
The gap in school attendance rates between Indigenous and non-Indigenous students also widens throughout high school and is significantly greater in remote and very remote areas. In Semester 1 2016, national Indigenous attendance rates were 83.4%, compared with 93.1% for non-Indigenous students. There has been little change in the Indigenous school attendance rate from 2014 (83.5%). All of the changes at the state and territory level were less than one percentage point, apart from the NT (1.6 percentage point fall). In 2014–15, Indigenous parents of children aged 4–14 years reported that their child’s school attendance was affected by bullying—9% of children in Years 1–3, 14% of children in Years 4–6 and 20% of children in Years 7–10. Around 85% of Indigenous parents stated that they were very well/well advised on their child’s progress at school.
Hearing and vision loss due to high rates of otitis media and trachoma also impact on literacy outcomes for Indigenous students. Regardless of ear health status, Indigenous students’ literacy skills remain consistently poorer compared with non-Indigenous peers (Timms et al, 2014). Poor literacy achievement is more common among students who do not speak Standard Australian English at home, while poorer numeracy is more evident among students with parents in less skilled occupations (Purdie et al, 2011) (see measure 2.07). While the 2011 Census reports 83% of Indigenous Australians speak English at home, many Indigenous Australians use a distinctly Aboriginal form of English that differs from the Standard Australian English used in educational settings (Hall, J, 2013; Eades, D, 2013). In 2014–15, 11% of Indigenous Australians aged 15 years and over spoke an Indigenous language as their main language.
Figures
Figure 2.04-1
Proportion of Year 3, 5, 7 and 9 students at or above the national minimum standards for reading, writing, numeracy, and spelling, grammar and punctuation, by Indigenous status, 2016
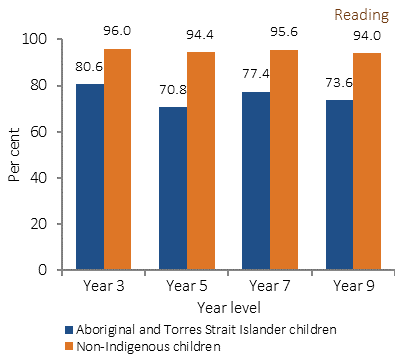
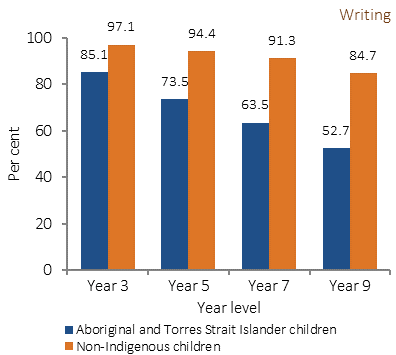
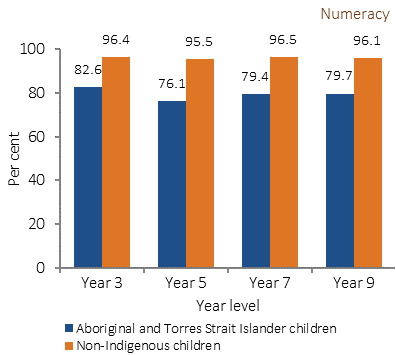
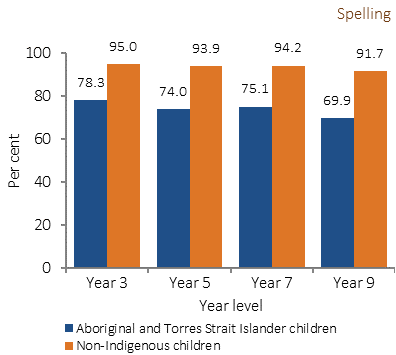
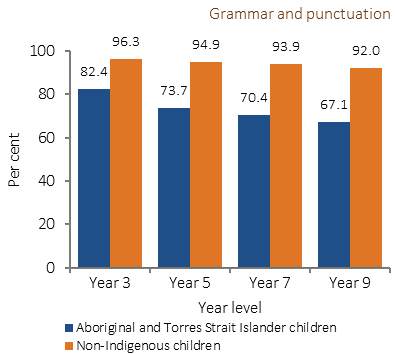
Source: ACARA 2016
Figure 2.04-2
Proportion of Year 3, 5, 7 and 9 students at or above the national minimum standards for reading, writing and numeracy, by remoteness area and Indigenous status, 2016
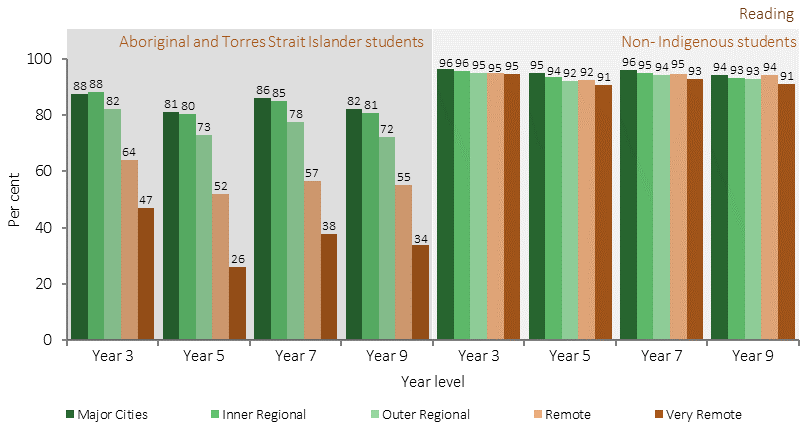
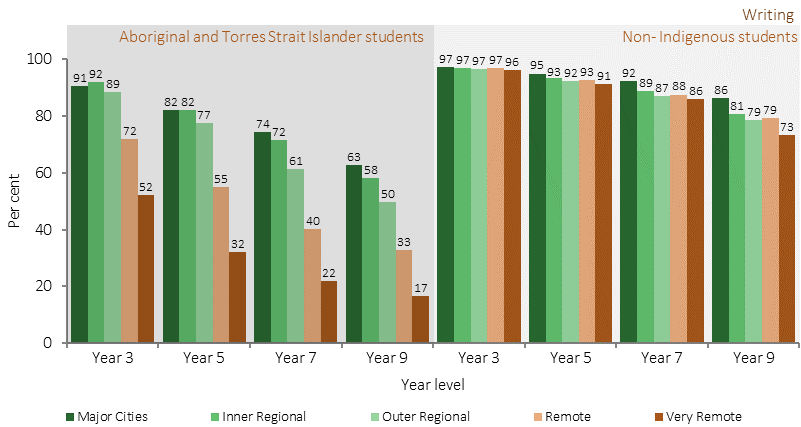
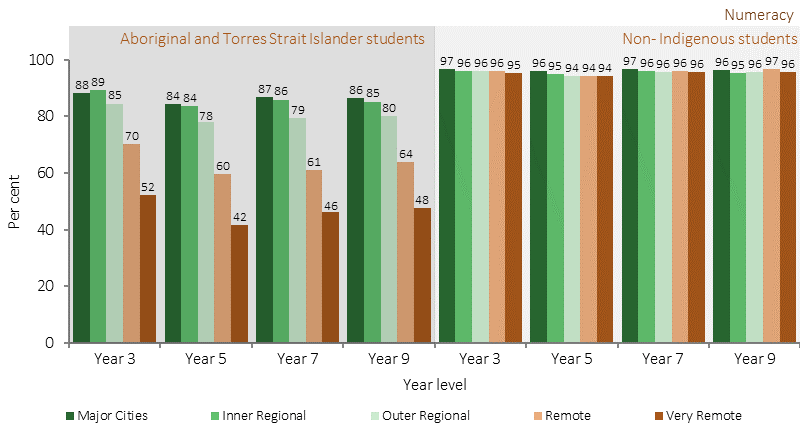
Source: ACARA 2016
Figure 2.04-3
Proportion of Year 3, 5, 7 and 9 students at or above the national minimum standards for reading and numeracy, and trajectory to COAG target, by Indigenous status, 2008 to 2016
Source: ACARA 2016
Implications
Developing strong links between early childhood services, schools, parents and communities to improve attendance; providing culturally competent and quality teaching; and ensuring schools help Indigenous students to feel included and supported provides a foundation for improving literacy and numeracy outcomes of Indigenous children. The disparities in NAPLAN achievement between Indigenous and non-Indigenous students are widespread across remoteness areas and schools. Therefore, a ‘one size fits all’ approach is unlikely to be effective (Productivity Commission, 2016b).
Progress against the Closing the Gap target to halve the gap for Indigenous children in reading, writing and numeracy by 2018 continues to be mixed. The proportion of Indigenous students achieving national minimum standards for reading and numeracy is on track in one out of eight areas (Year 9 numeracy). Although the literacy and numeracy gap remains, the numbers required to halve the gap are within reach. If an additional 440 Indigenous Year 3 students had achieved national minimum standards in reading and 800 in numeracy, the target would have been met for Year 3 in 2016. Queensland has shown the largest improvements, with significant improvement in six of the eight areas from 2008 to 2016.
In 2015, Commonwealth, State and Territory Education Ministers endorsed the National Aboriginal and Torres Strait Islander Education Strategy. The Strategy sets the principles and priorities to guide jurisdictions in developing and implementing localised policies to improve Aboriginal and Torres Strait Islander outcomes, with a focus on attendance and engagement; transition points including pathways to post-school options; early childhood transitions; standards to build a culturally competent teacher workforce; and improvements to the Australian curriculum to provide greater guidance on the consideration of Aboriginal and Torres Strait Islander perspectives.
In December 2015, the Framework for Aboriginal Languages and Torres Strait Islander Languages was added to the Australian Curriculum. The Framework is intended to play an important part in the development of a strong sense of identity, pride and self-esteem for all Australian students. The Framework outlines principles and protocols for respectful engagement with Aboriginal and Torres Strait Islander communities.
The Australian Government is providing $22 million over 2013–14 to 2016–17 for the Flexible literacy for remote primary schools programme. The programme aims to increase literacy levels amongst students attending remote schools. There are currently 37 schools participating in the programme. The funding will support schools to implement two proven explicit teaching approaches—Direct Instruction (DI) and Explicit Direct Instruction (EDI).
The Home Interaction Program for Parents and Youngsters (HIPPY) is a home based early learning and parenting program that empowers parents and carers to be their child’s first teacher and to support children to transition to school and beyond. HIPPY is now operating in 100 sites across Australia, of which half are located in predominantly Indigenous communities.
The Australian Government is supporting the Northern Territory to expand its Families as First Teachers Programme (FAFT) through the National Partnership on Northern Territory Remote Aboriginal Investment. Since the FAFT commenced, the proportion of Indigenous children in very remote communities being assessed as developmentally vulnerable has fallen by 5.7 per cent.