2.05 Education outcomes for young people
Page content
Why is it important?
Higher levels of education are associated with improved health outcomes through greater health literacy and better prospects for socio-economic status (including income and employment) which supports increased access to safe and healthy housing (see measures 2.01 & 2.02); healthy lifestyle choices such as regularly eating fruit and vegetables; and not smoking (see measures 2.15 & 2.19) (Clark & Utz, 2014). Research in the US (Wong, MD et al, 2002) found that mortality has declined at a faster pace for those with more education, with a 7-year increase in life expectancy for college-educated students. International literature also documents improvements in child mortality associated with increased levels of maternal education and attributed this to a variety of factors, including improved understanding of and greater willingness to access health services (Gakidou et al, 2010).
The ‘retention rate’ measures the extent to which students stay on at school until Year 10, and until Year 12. Another measure is the ‘attainment rate’, the extent to which students are awarded a certificate at the end of Year 10 or Year 12. Historically, Aboriginal and Torres Strait Islander students have had lower retention and attainment rates compared with non-Indigenous students. It is also important to note that retention and completion do not reflect quality of education; NAPLAN results suggest a considerable proportion of Indigenous students are not reaching minimum standards (see measure 2.04).
Findings
Data for 2015 show that the apparent retention rate of full-time Aboriginal and Torres Strait Islander students from Years 7/8 to Year 10 was 99% compared with full retention for other students. In the same year, the apparent retention rate of full-time Aboriginal and Torres Strait Islander students from Years 7/8 to Year 12 was 59% compared with 85% for other students. The apparent retention rate of full-time Aboriginal and Torres Strait Islander students from Year 11 to Year 12 was 73% compared with 89% for other students. The apparent retention rate for Aboriginal and Torres Strait Islander females was higher than for males across all year groups of school retention.
Between 1999 and 2015 there have been significant increases in Indigenous student apparent retention rates for all year groups. The largest increase was from Year 7/8 to Year 12 (75%) and from Year 7/8 to Year 11 (54%).
Between 2014 and 2015, the number of students identifying as Aboriginal and Torres Strait Islander increased by 4.2%. In 2015, Aboriginal and Torres Strait Islander students made up 5.3% of total enrolments in schools (totalling over 200,500). The majority of these students (84%) attended government schools. The largest proportion of Indigenous students were in NSW (32%) followed by Qld (30%). In the NT, 41% of all students identify as Aboriginal and/or Torres Strait Islander (ABS, 2016d).
In 2015, the majority of jurisdictions had full retention rates of Aboriginal and Torres Strait Islander students from Year 7/8 to Year 10, with the exceptions being WA (89%) and the NT (74%). Retention rates of Indigenous students from Year 7/8 to Year 12 were highest in the ACT (88%) and SA (86%) and were lowest in the NT (32%). Rates for Tasmania and the ACT should be interpreted with caution, due to small numbers.
Between 2008 and 2014–15, the gap in the Year 12 or equivalent attainment rate for those aged 20–24 years narrowed by 14.7 percentage points and the COAG target to halve the gap by 2020 is currently on track. Nationally, the proportion of Indigenous 20–24 year olds who had attained Year 12 or equivalent increased from 45.4% in 2008 to 61.5% in 2014–15. In 2014–15, Year 12 or equivalent attainment rates for Indigenous 20–24 year olds were highest in inner regional areas (69%) and lowest in remote areas (42%). The gap in attainment rates between Indigenous and non-Indigenous was smallest in regional areas.
In the 2014–15 Social Survey, Indigenous Australians aged 15–19 years identified the types of assistance that would support them completing Year 12, such as: support from family, friends and school (38%); career guidance (21%); individual tutoring (14%); greater access to apprenticeships (12%); schools being suitable for culture and/or beliefs (9%); and subsidies or grants to help affordability (8%).
Figures
Figure 2.05-1
Apparent Year 10 retention rates, by Indigenous status, 1999 to 2015
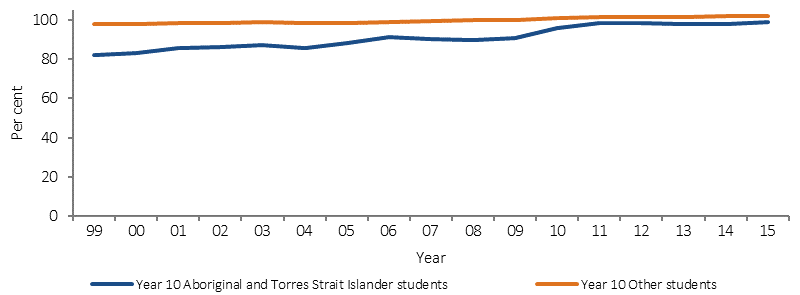
Source: AIHW analysis of ABS National Schools Statistics Collection
Figure 2.05-2
Apparent Year 12 retention rates, by Indigenous status, 1999 to 2015
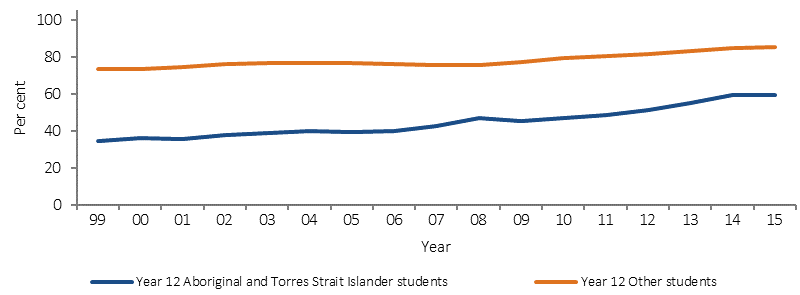
Source: AIHW analysis of ABS National Schools Statistics Collection
Figure 2.05-3
Year 12 or equivalent attainment, Indigenous Australians aged 20–24 years, by remoteness area, 2008 and 2014–15
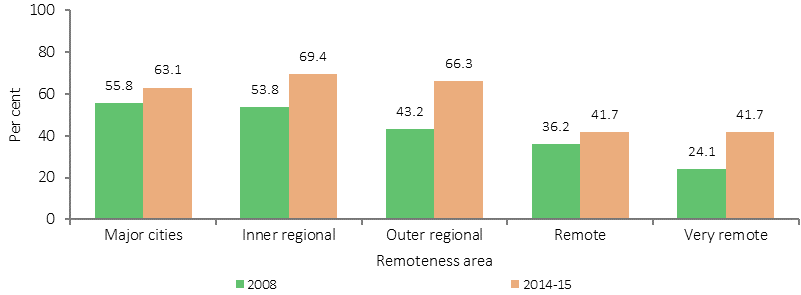
Source: ABS and AIHW analysis of 2008 and 2014–15 NATSISS
Table 2.05-1
Apparent retention rates, by Indigenous status, jurisdiction and sex, 2015
| Aboriginal and Torres Strait Islander peoples | Other | ||||||||||
|---|---|---|---|---|---|---|---|---|---|---|---|
| NSW | Vic | Qld | WA | SA | Tas | ACT | NT | Australia | Australia | ||
| Per cent | |||||||||||
| Year 7/8 to 10—Apparent retention rates | |||||||||||
| Males | 100.0 | 99.8 | 100.0 | 89.3 | 97.7 | 100.0 | 100.0 | 70.4 | 98.0 | 100.0 | |
| Females | 100.0 | 100.0 | 100.0 | 89.4 | 100.0 | 100.0 | 100.0 | 77.0 | 99.9 | 100.0 | |
| Persons | 100.0 | 100.0 | 100.0 | 89.3 | 100.0 | 100.0 | 100.0 | 73.6 | 98.9 | 100.0 | |
| Year 7/8 to 12—Apparent retention rates | |||||||||||
| Males | 46.7 | 65.1 | 70.0 | 48.8 | 76.8 | 48.8 | 77.6 | 27.0 | 54.9 | 82.0 | |
| Females | 57.8 | 73.8 | 75.4 | 52.3 | 94.4 | 59.6 | 100.0 | 36.6 | 64.1 | 88.6 | |
| Persons | 52.1 | 69.7 | 72.7 | 50.4 | 85.9 | 54.0 | 88.2 | 31.6 | 59.4 | 85.2 | |
| Year 11 to 12—Apparent retention rates | |||||||||||
| Males | 63.1 | 72.3 | 82.5 | 63.9 | 77.6 | 73.3 | 71.4 | 52.6 | 70.9 | 86.7 | |
| Females | 69.3 | 76.2 | 81.6 | 65.1 | 88.3 | 83.1 | 73.2 | 67.4 | 75.2 | 90.3 | |
| Persons | 66.3 | 74.4 | 82.0 | 64.5 | 83.4 | 78.2 | 72.4 | 59.9 | 73.1 | 88.5 | |
Note: results over 100% have been set to 100%.
Source: AIHW analysis of ABS National Schools Statistics Collection
Implications
Various strategies are required to address the multiple and interrelated issues affecting education outcomes. These include education access and participation, family and community engagement, home learning environments, mentors and culturally inclusive support strategies. There are some gaps in the evidence on education, but the largest gap is in the evaluation of policies, programs and teaching practices to identify what works best, for whom, and in what circumstances (Productivity Commission, 2016a).
The Australian Government works collaboratively with states and territories to develop national priorities for schooling based on the best evidence of what works to improve student outcomes and close gaps. Through COAG, governments have agreed to strategies relating to improving the quality of schools and education standards. Governments are also working to increase progress against the Closing the Gap targets for early childhood education, school attendance, literacy and numeracy achievement and Year 12 attainment.
The Australian Government provides additional recurrent funding to states and territories, which they are responsible for allocating to government schools and for passing on to approved authorities for non-government schools, to support improved service delivery and reform to meet nationally agreed outcomes. From 2014 to 2017, funding is transitioning under the Australian Education Act 2013 from levels under the previous funding arrangements towards the Schooling Resource Standard funding arrangement levels. Funding is calculated with reference to a base amount plus loadings to target student and school disadvantage. This funding must be used for the purpose of supporting the in-school costs associated with providing education. In 2015, 84% of Indigenous students attended government schools across primary and secondary levels.
The Indigenous Advancement Strategy includes funding for Indigenous communities to support a range of childhood and schooling activities designed to improve children and young people’s education engagement and outcomes. Funding is largely used to support activities ‘outside the school gate’, which aim to further build children and young people’s learning capabilities. In remote Australia, the Australian Government’s Remote School Attendance Strategy operates in 77 schools, supporting around 14,000 students to get to school every day.