1.19 Life expectancy at birth
Page content
Why is it important?
Life expectancy at birth is widely used internationally as a measure of the general health of populations. Over the last 125 years, life expectancy at birth for the Australian population has increased by more than 30 years (from 47 years for males and 51 years for females in 1885) (ABS, 2014f). here is currently a large gap in life expectancy between Indigenous and non-Indigenous Australians. A recent study in the NT estimated that socio-economic disadvantage accounted for one-third to one-half of the gap in life expectancy (Zhao et al, 2013a). Social and economic factors such as poverty, racism, stressors, educational exposure and employment status impact on the individual’s propensity to engage in health risk behaviours and on their access to the health system. These factors combined lead to increased risk of circulatory disease (Dong et al, 2004) and cancer (Kelly-Irving et al, 2013), the leading causes of death.
Findings
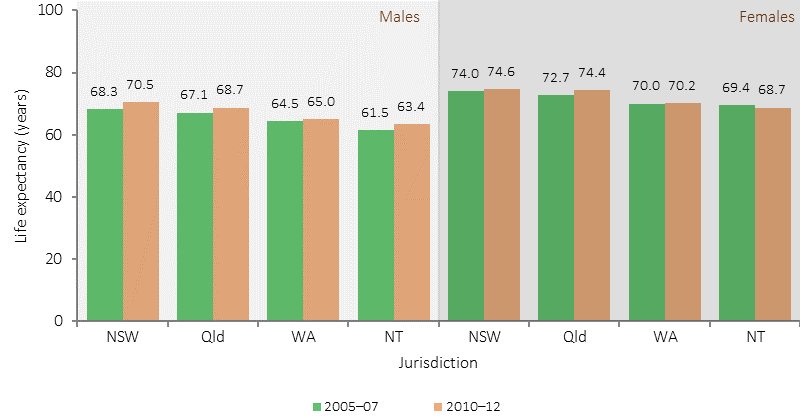
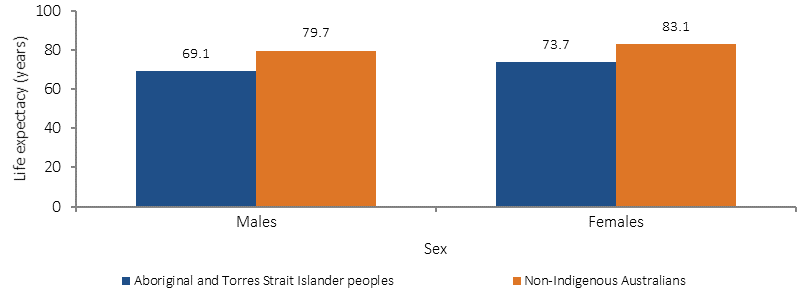
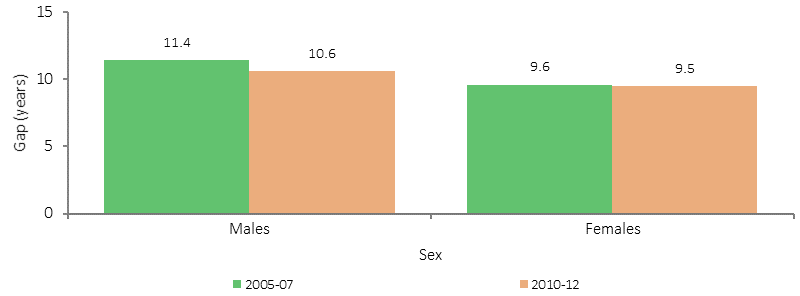
In 2010–12, life expectancy for Aboriginal and Torres Strait Islander males was estimated to be 10.6 years lower than that for non-Indigenous males (69.1 years compared with 79.7 years) and 9.5 years lower for females (73.7 compared with 83.1 years). For the first time, the ABS has published trend data by revising the 2005–07 estimate to provide comparable data with 2010–12. Over this five-year period life expectancy increased for both Indigenous men and women, and the life expectancy gap between Indigenous and non-Indigenous Australians reduced slightly, by 0.8 years for males and by 0.1 years for females. Four jurisdictions have populations of sufficient size to calculate Indigenous life expectancy estimates (NSW, Qld, WA and the NT). Indigenous life expectancy is estimated to be lower in the NT than in any other jurisdiction. Life expectancy for Indigenous males in the NT was estimated to be 63.4 years compared with 70.5 years for NSW (a gap of 7.1 years). Indigenous females in the NT had a life expectancy estimate of 68.7 years compared with 74.6 years for Indigenous females in NSW (a gap of 5.9 years). Life expectancy for Aboriginal and Torres Strait Islander males living in outer regional, remote and very remote areas combined was estimated to be 0.7 years lower than that of Indigenous males living in major cities and inner regional areas combined (67.3 years compared with 68.0 years) and 0.8 years lower for females (72.3 compared with 73.1 years).
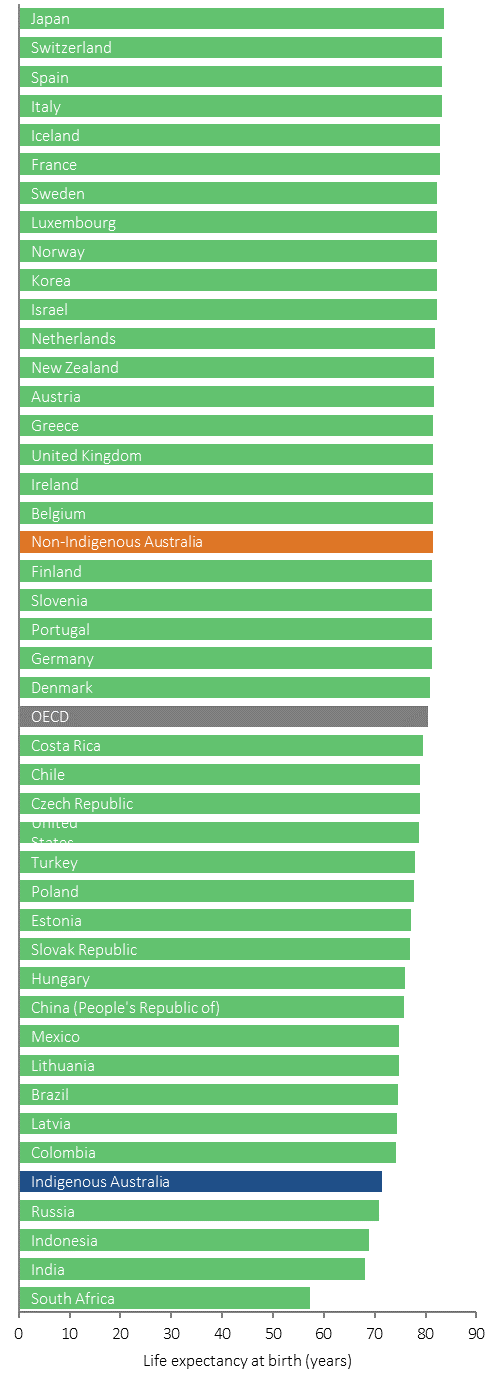
Internationally, life expectancy has increased greatly over the past few decades. The OECD average is now 80.5 years and emerging countries such as Brazil and China have also achieved large gains in longevity (OECD, 2015). Methods of calculating life expectancy vary internationally so caution is needed in making comparisons. Higher income per capita is generally associated with higher life expectancy, although there are some variations across countries, for example the US had lower life expectancy than other countries with similar incomes. Life expectancy at birth for Indigenous Australians was close to that of the general populations in Brazil and Indonesia. In New Zealand, there was a life expectancy gap between the Maori and non-Maori populations of 7.3 years for males and 6.8 years for females (Statistics NZ, 2015).
Figures
Figure 1.19-1
Trends in life expectancy for Indigenous males and females by state/territory, 2005–07 and 2010–12
Source: ABS (2013b)
Figure 1.19-2
Life expectancy at birth, Indigenous and non-Indigenous Australians by sex, 2010–12
Source: ABS (2013b)
Figure 1.19-3
Life expectancy at birth, comparison across selected countries, 2014
Source: (OECD, 2015)
Figure 1.19-4
The gap in life expectancy between Indigenous and non-Indigenous Australians by sex, 2005–07 and 2010–12
Source: ABS (2013b)
Table 1.19-1
Life expectancy at birth and the gap in life expectancy, by Indigenous status and sex, 2005–07 and 2010–12
| Males | Females | |||||
|---|---|---|---|---|---|---|
| Indigenous | Non-Indigenous | Gap | Indigenous | Non-Indigenous | Gap | |
| 2005–07 (revised) | 67.5 | 78.9 | 11.4 | 73.1 | 82.6 | 9.6 |
| 2010–12 | 69.1 | 79.7 | 10.6 | 73.7 | 83.1 | 9.5 |
| change 2005–07 to 2010–12 | 1.6 | 0.8 | -0.8 | 0.6 | 0.5 | -0.1 |
Source: ABS (2013b)
Table 1.19-2
Life expectancy at birth, by Indigenous status and sex, selected states/territories and remoteness, 2010–12
| Males | Females | |||||
|---|---|---|---|---|---|---|
| Indigenous | Non-Indigenous | Gap | Indigenous | Non-Indigenous | Gap | |
| New South Wales | 70.5 | 79.8 | 9.3 | 74.6 | 83.1 | 8.5 |
| Queensland | 68.7 | 79.4 | 10.8 | 74.4 | 83.0 | 8.6 |
| Western Australia | 65.0 | 80.1 | 15.1 | 70.2 | 83.7 | 13.5 |
| Northern Territory | 63.4 | 77.8 | 14.4 | 68.7 | 83.1 | 14.4 |
| Major cities & inner regional | 68.0 | 79.9 | 11.9 | 73.1 | 83.0 | 9.9 |
| Outer regional & remote/very remote | 67.3 | 78.5 | 11.2 | 72.3 | 82.5 | 10.2 |
Source: ABS (2013b)
Implications
Closing the gap in life expectancy between Aboriginal and Torres Strait Islander peoples and other Australians within a generation has been adopted as a target by COAG.
Life expectancy estimates move slowly, currently around 0.25 years of life per year for the Australian population. The ABS estimates that life expectancy at birth for Indigenous males has increased by 0.32 years per year since 2005–07, and by 0.12 years per year for Indigenous females. To meet the target by 2031, Indigenous life expectancy needs to increase by 0.6 to 0.8 years per year. In the nine years since the target was set there have been some improvements for Aboriginal and Torres Strait Islander peoples (decline in mortality rates and life expectancy has increased). However, some health interventions which are targeted at closing the gap take time to have measurable impacts upon populations. These include interventions aimed at reductions in population level smoking rates, which take five years to impact on heart disease and up to 30 years for cancer, and improvements in educational attainment will take 20 to 30 years to impact on early deaths from chronic disease in the middle years. Most deaths for Indigenous Australians occur in the middle years. Indigenous mortality rates are 4 times the non-Indigenous rate between the ages of 35–44 years. The leading causes of death for Indigenous Australians are circulatory disease, cancer, injury, diabetes and respiratory disease. The results signal the need for significant and concerted efforts to continue improving Indigenous health outcomes, both directly through health interventions and by addressing the cultural and social determinants of health.