Key Findings
Page content
Introduction
This is the sixth report against the Aboriginal and Torres Strait Islander Health Performance Framework (HPF)—see Figure 1. The HPF monitors progress in Aboriginal and Torres Strait Islander health outcomes, health system performance and the broader determinants of health. The health of Aboriginal and Torres Strait Islander peoples is improving for a number of measures, although there remain many areas where further concerted effort will be needed to achieve improvements in health outcomes.
This report includes updates for all administrative data collections and also the new ABS National Aboriginal and Torres Strait Islander Social Survey (‘Social Survey’, NATSISS) results for 2014–15. Data quality limitations and the small size of many estimates affect our ability to effectively monitor Indigenous health and the performance of the health system (see Technical Appendix).
There is a clear gap in robust evaluation evidence on effective interventions across a range of programme areas covered in this report. High quality evaluation evidence is vital for informing policy and programme development and planning.
Council of Australian Governments (COAG) Targets
Council of Australian Governments (COAG) has set seven targets on closing the gap between Aboriginal and Torres Strait Islander peoples and non-Indigenous Australians:
- Closing the life expectancy gap within a generation (2006 to 2031)—Indigenous life expectancy has improved slightly, but progress will need to accelerate if the target is to be met by 2031. Official Indigenous life expectancy estimates are only available every five years. Annual progress for this target is tracked using mortality rates. While long-term Indigenous mortality rates have declined, the rate of change will need to accelerate to reach the target (see Figure 2).
- Halving the gap in mortality rates for Indigenous children under five within a decade (2008 to 2018)—there has been progress for infants but the 2015 Indigenous child mortality rate is not within the range required (see Figure 3).
- The original target for 95% of Indigenous four-year-olds in remote communities to be enrolled in early childhood education expired unmet in 2013 at 85%. In December 2015, COAG renewed the early childhood education target, aiming for 95% of all Indigenous four year olds enrolled by 2025. The baseline Indigenous enrolment rate in 2015 was 87%.
- Closing the gap between Indigenous and non-Indigenous school attendance within five years (2014 to 2018)—progress will need to accelerate for this target to be met.
- Halving the gap for Indigenous students in reading, writing and numeracy within a decade (2008 to 2018)—mixed progress has been made on this target. Of the eight areas (Year 3, 5, 7 and 9 for reading and numeracy), four have seen significant improvements and one (Year 9 numeracy) is on track in 2016.
- Halving the gap for Indigenous Australians aged 20–24 in Year 12 attainment or equivalent attainment rates (by 2020)—this target is on track to be met. Between 2008 and 2014–15, Indigenous Year 12 or equivalent attainment rates increased from 45.4% to 61.5% and the gap narrowed by 14.7 percentage points.
- Halving the gap in employment outcomes between Indigenous and non-Indigenous Australians within a decade (2008 to 2018)—this target is not on track and there has been no progress on the employment target since 2008.
Figure 2
Overall mortality rates by Indigenous status, NSW, Qld, WA, SA and the NT combined, 1998 to 2031
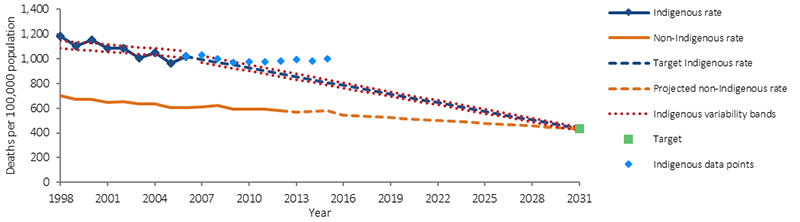
Source: ABS and AIHW analysis of National Mortality Database
Figure 3
Child mortality rates by Indigenous status: NSW, Qld, WA, SA and the NT combined, 1998 to 2018
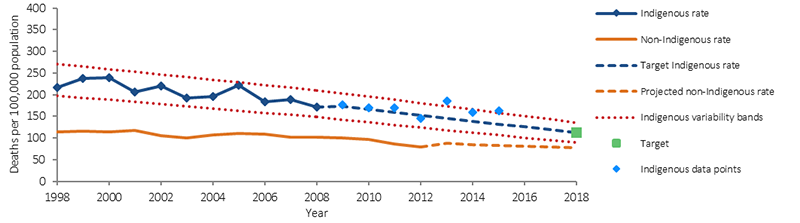
Note: In part, the Indigenous mortality trend has changed for this reporting period due to an improvement in the quality of Indigenous identification. This means that caution should be used in interpreting the trends (see Technical Appendix for more detail).
Source: ABS and AIHW analysis of National Mortality Database.
Tier 1: Health Status and Outcomes
Improvements
Burden of disease
There was a 5% reduction in the Indigenous burden of disease rate between 2003 and 2011 with most of this improvement in fatal burden, particularly in cardiovascular diseases (AIHW, 2016f).
Mortality
Between 1998 and 2015 there was a significant decline in both the Indigenous mortality rate (15%) and the non-Indigenous rate (17%) (for people living in jurisdictions with adequate data quality—NSW, Qld, WA, SA and the NT combined). There has been no significant change in the absolute or relative gaps.
Avoidable mortality
There was a significant decline in Indigenous deaths due to avoidable causes, down 32% between 1998 and 2015. An NT study of avoidable mortality between 1985 and 2004 found major declines in conditions amenable to medical care, but only marginal change for potentially preventable conditions such as lung cancer, chronic liver disease and car accidents (Li, SQ et al., 2009).
Circulatory disease
Circulatory disease death rates—the most common cause of death for Indigenous Australians—declined by 43% between 1998 and 2015.
Kidney disease
Kidney disease death rates decreased significantly from 2006 to 2015 (by 47%) for Indigenous Australians and the gap also narrowed with non-Indigenous Australians.
Respiratory disease
Respiratory disease death rates decreased significantly from 1998 to 2015 (by 24%) for Indigenous Australians.
Disability
There has been a decline in the proportion of Indigenous Australians aged 15 years and over reporting a disability or restrictive long-term health condition, from 50% in 2008 to 45% in 2014–15.
As at June 2016, 6% of those with approved plans under the National Disability Insurance Scheme were Indigenous Australians (1,831 people).
Social and emotional wellbeing
In 2014–15, 53% of Indigenous Australians aged 15 years and over reported an overall life satisfaction rating of 8 or above (out of 10). Most Indigenous adults (67%) reported low/moderate levels of psychological distress. In 2014–15, 62% of Indigenous Australians aged 15 years and over reported they identified with a clan or language group and 97% reported that they had been involved in sporting, social or community activities in the last 12 months.
Infant and child mortality
There was also a significant decline in the mortality rate for Indigenous children aged 0–4 years (33%) between 1998 and 2015. There was a 66% decline in the mortality rate for Indigenous infants and a significant narrowing of the absolute gap (84%) and the relative gap (92%) between 1998 and 2015.
Concerns
Chronic diseases—two-thirds of the health gap
Chronic diseases were responsible for 64% of the total disease burden for Indigenous Australians, and 70% of the gap in 2011 (AIHW, 2016f). The diseases causing the most burden included mental and substance use disorders (19%), injuries (including suicide) (15%), cardiovascular diseases (12%), cancer (9%), respiratory diseases (8%) and musculoskeletal conditions (7%). While the overall burden declined between 2003 and 2011, there was a 4% increase in the rate of non-fatal burden mainly due to increases in people living with chronic diseases.
During 2011–15 the leading causes of Indigenous deaths were circulatory diseases (24%); neoplasms (including cancer) (21%); external causes (including suicide and transport accidents) (15%); endocrine, metabolic and nutritional disorders (including diabetes) (9%); and respiratory diseases (8%).
In 2014–15, 29% of Indigenous Australians aged 15 years and over had three or more long-term health conditions. In the 2012–13 Health Survey, 20% of Indigenous adults had high blood pressure and most (79%) had not previously been diagnosed with the condition.
Cancer
There has been a 21% increase in cancer mortality rates for Indigenous Australians and a 13% decline for non-Indigenous Australians between 1998 and 2015. It will take up to 30 years for the reductions in Indigenous smoking rates to flow through to reduced cancer deaths. Research has found disparities in cancer screening rates, stage at diagnosis, treatment rates (including lower rates of surgery, chemotherapy and radiotherapy) and lower survival rates for Indigenous Australians.
Diabetes
There has been no improvement in the mortality rate for diabetes between 1998 and 2015. In 2012–13, 11% of Indigenous adults had diabetes (3 times the non-Indigenous rate). Of those with diagnosed diabetes, 61% had high blood sugar levels.
Kidney disease
There has been no significant change in the Indigenous rate of treated end stage kidney disease between 1996 and 2014. The Indigenous rate was 7 times the non-Indigenous rate in 2012–14.
Injury
External causes such as suicide and transport accidents accounted for 15% of Indigenous deaths over the period 2011–15. Indigenous Australians died from suicide and transport accidents at 2.1 and 2.6 times the rate for non-Indigenous Australians respectively. There has been no improvement in the mortality rate due to external causes between 1998 and 2015. Injury was the second most common reason for hospital admissions for Indigenous Australians (after dialysis), 1.8 times the non-Indigenous rate.
Social and emotional wellbeing
There has been a significant increase in the Indigenous suicide rate between 1998 and 2015 (32%). There has also been an increase in the proportion of Indigenous adults reporting high/very high levels of psychological distress (from 27% in 2004–05 to 33% in 2014–15).
Low birthweight
In 2014 nationally, 10.5% of babies born to Indigenous mothers were low birthweight, twice the non-Indigenous rate (4.7%). There is a strong relationship between low birthweight and smoking during pregnancy.
Tier 2: Determinants of Health
Improvements
Smoking
There has been a significant decline in smoking rates for Indigenous Australians aged 15 years and over between 2002 and 2014–15 (9 percentage points), including a significant improvement since 2008. From 2002 to 2014–15, the greatest decreases in smoking rates have been in the younger age groups—from 58% to 41% for 18–24 year olds and from 33% to 17% among 15–17 year olds.
For those who continue to smoke, there has been a decline in the average number of cigarettes smoked daily (from 15 in 2008 to 13 in 2014–15), although there is no safe level of smoking.
There has also been a decline between 2006 and 2014 in the rate of smoking among Indigenous women during pregnancy (from 54% to 46%).
Alcohol
Between 2008 and 2014–15, the proportion of Indigenous Australians aged 15 years and over drinking at risky levels declined for both single occasion (from 38% to 31%) and for lifetime risk (from 19% to 15%).
The proportion of Indigenous children aged 0–3 years with a birth mother who drank alcohol during pregnancy halved from 20% in 2008 to 10% in 2014–15, with the largest decline in non-remote areas (10 percentage points).
Education
Between 2008 and 2014–15, the gap in the Year 12 or equivalent attainment rate for those aged 20–24 years narrowed by 14.7 percentage points and the COAG target to halve the gap by 2020 is on track to be met. In 2014–15, 47% of Aboriginal and Torres Strait Islander peoples aged 20–64 years reported they either had a Certificate III or above or were studying; a 21 percentage point increase from 2002. The gap narrowed in comparison to non-Indigenous Australians over this period.
Housing
Nationally, between 2008 and 2014–15, the proportion of Indigenous Australians living in overcrowded households declined by 6.8 percentage points (from 27.5% to 20.7%). The rate of homelessness among Indigenous Australians fell by 14% between 2006 and 2011 (AIHW, 2014i).
Concerns
Employment
There has been little change in Indigenous employment rates since 2008 and the target to halve the gap within a decade is not on track.
Education
In Semester 1 2016, the Indigenous school attendance rate was 83.4%, compared with 93.1% for non-Indigenous students. There has been little change in the Indigenous school attendance rate from 2014 (83.5%).
In 2016, NAPLAN results were below the required trajectory points in seven of the eight areas for the target.
Risk factors
Around 37% of the Indigenous burden of disease was attributable to the 29 risk factors included in the study and they accounted for 51% of the gap with non-Indigenous Australians in 2011 (AIHW, 2016f). Key risk factors included tobacco use (12% of the Indigenous burden), alcohol use (8%), high body mass (8%), physical inactivity (6%), high blood pressure (5%) and high blood plasma glucose (5%). Dietary factors together accounted for approximately 10% of the burden. Tobacco use accounted for 23% of the health gap.
In 2014–15, 42% of Indigenous Australians aged 15 years and over reported being a current smoker, 2.7 times the non-Indigenous rate. Indigenous smoking rates in remote areas have not improved and are still 53%. In 2014, 46% of Indigenous women smoked during pregnancy, 3.6 times the non-Indigenous rate.
In 2012–13, 66% of Indigenous Australians aged 15 years and over were overweight or obese (29% overweight and 37% obese). Indigenous Australians were 1.6 times as likely to be obese as non-Indigenous Australians.
In 2014–15, 5% of Indigenous Australians aged 4–14 years and 4% of those aged 15 years and over reported adequate daily fruit and vegetable intake (NHMRC, 2013a).
In 2014–15, 31% of Indigenous Australians aged 15 years and over had used drugs and other substances in the last 12 months (up from 23% in 2008).
Low income and the distribution of income
In 2014–15, 36% of Indigenous adults were living in households in the bottom income quintile compared with 17% of non-Indigenous adults. In comparison, only 6% were in the top quintile compared with 22% of non-Indigenous adults.
Community safety
Indigenous Australians were more likely to experience exposure to violence, child abuse and neglect, and contact with the criminal justice system than other Australians.
In 2014–15, 22% of Indigenous Australians aged 15 years and over reported experiencing physical or threatened violence in the last 12 months (no significant change from 24% in 2002).
Between 2006 and 2016, the Indigenous imprisonment rate increased by 53%; and in 2016 the Indigenous imprisonment rate was 13 times the non-Indigenous rate (age-standardised).
In 2014–15, the rate of Indigenous 10–17 year olds under juvenile justice supervision was 15 times the non-Indigenous rate.
Housing
In 2014–15, 21% of Indigenous Australians lived in overcrowded households, 3.8 times the non-Indigenous rate.
Around 26% of Indigenous households were living in dwellings with major structural problems.
In 2011, Indigenous Australians accounted for 28% of the homeless population (AIHW, 2014i).
Tier 3: Health System Performance
Improvements
Chronic disease detection and management
There has been a significant increase in a range of Medicare services claimed by Indigenous Australians since the introduction of the Indigenous chronic disease initiatives in 2009–10:
- Health assessment rates for Indigenous Australians more than tripled between July 2009 and June 2016.
- There has also been an increase in the Indigenous rate of Medicare GP management plans and team care arrangements claimed between July 2009 and June 2016. For GP management plans the Indigenous rate (129 per 1,000) is now higher than the non-Indigenous rate (86 per 1,000) (age-standardised). This is also the case for team care arrangements (112 and 72 per 1,000 respectively, age-standardised).
- There has also been a significant increase in overall GP Medicare items claimed by Indigenous Australians between 2003–04 and 2015–16. The Indigenous rate (6,623 per 1,000) is now higher than the non-Indigenous rate (5,840 per 1,000) (age-standardised).
The national Key Performance Indicators monitor the performance of over 200 Commonwealth-funded Indigenous primary health care organisations. In May 2015, around 32,900 regular clients of these organisations had Type 2 diabetes. In the six months to May 2015, 52% of these clients had their blood glucose levels tested, with 35% of those tested reporting a blood sugar result in the recommended range; 68% had their blood pressure assessed, with 43% reporting a result in the recommended range; and 67% reported a kidney function test, with 81% reporting a result in the normal range.
Access to prescription medicines
Between 1 July 2010 and 30 June 2016, 407,861 eligible Indigenous patients have benefited from the Closing the Gap Pharmaceutical Benefits Scheme (PBS) Co-payment Measure, subsidising 17.9 million PBS prescriptions.
Health Workforce
Between 1996 and 2011 the rate of Indigenous Australians employed in the health workforce increased from 96 per 10,000 to 155 per 10,000.
Increased availability of Indigenous specific services
Australian Government Indigenous specific health programme expenditure through the Department of Health has increased from $115 million in 1995–96 to $727 million in 2015–16, a growth in real terms of 284%. The episodes of care delivered through Aboriginal and Torres Strait Islander primary health care services have almost tripled (from 1.2 million in 1999–2000 to 3.5 million in 2014–15).
Usual source of care
In 2012–13, 86% of Indigenous Australians had a usual place to go for health problems/advice.
In 2014–15, most Indigenous Australians aged 15 years and over who saw a GP or specialist in the previous 12 months reported feeling their doctor always or usually: listened carefully to them (80%); showed them respect (85%); and spent enough time with them (79%).
Antenatal care
The proportion of Indigenous women accessing antenatal care during the first trimester increased by 13%, from 47% in 2011 to 52% in 2014 (age-standardised, excluding New South Wales).
Immunisation coverage for children
By 5 years of age the Indigenous immunisation rate (95%) was slightly higher than for other children (93%) in 2015.
Concerns
Barriers to accessing health care
In 2012–13, 30% of Indigenous Australians reported that they needed to, but didn’t, go to a health care provider in the previous 12 months. This varied by type of service with 21% not going to a dentist, 14% to a doctor, 9% to a counsellor, 9% to other health professionals and 6% to hospital when needed. Indigenous Australians living in non-remote areas (32%) were more likely to report not seeking care when needed than those living in remote areas (22%).
Selected potentially preventable hospitalisation rates for Indigenous Australians were 3 times the non-Indigenous rate during the period July 2013 to June 2015.
Indigenous Australians had lower rates of hospitalisations with a procedure recorded (62%) compared with non-Indigenous Australians (81%). Indigenous Australians also had lower rates of elective surgery and lower wait times.
Discharge from hospital against medical advice was 7 times the rate for Indigenous Australians compared with non-Indigenous Australians.
Health workforce
In 2011, 1.6% of the Indigenous Australian population was employed in health-related occupations compared with 3.4% of the non-Indigenous population. Aboriginal and Torres Strait Islander peoples are also currently under-represented in training for various health professions.
The supply of clinical doctors was not uniform across the country, being greater in major cities (421 FTE per 100,000 population) than in remote/very remote areas (251 FTE per 100,000) in 2015.
Antenatal care
Antenatal care for Indigenous women occurs later and less frequently than for non-Indigenous women. In 2014, 54% of Indigenous mothers had their first antenatal session in the first trimester of pregnancy. However, in 2014 the age-standardised proportion of Indigenous mothers who attended antenatal care in the first trimester was still lower than for non-Indigenous mothers (by 7 percentage points).
Private health insurance cover
In 2012–13, in non-remote areas, only 20% of Indigenous Australians were covered by private health insurance. The most common reason that Indigenous Australians did not have private health insurance was that they could not afford it (72%).
In the two years to June 2015, 7% of procedures recorded for Indigenous Australians occurred in private hospitals compared with 42% for non-Indigenous Australians.
Cost
The cost of the Indigenous health gap in the NT has been estimated at $16.7 billion, including: higher health expenditure, lost productivity and lost life-years (Zhao et al, 2016).