2.09 Index of disadvantage
Page content
Why is it important?
There is strong evidence from Australia and other developed countries that low socio-economic status is associated with poor health (Turrell & Mathers, 2000; Marmot, 2015) and that people of lower socio-economic status bear a significantly higher burden of disease (AIHW, 2016f). The links between different forms of socio-economic disadvantage such as poverty, unemployment, poor education and consequent social dysfunction, stress, social exclusion, racism and poor health are well documented (Marmot, 2015; Paradies, 2006; Saunders & Davidson, 2007; Sassi, 2009).
It has been estimated that in the NT, socio-economic status contributes to 30% to 50% of the gap in life expectancy between Indigenous and non-Indigenous Australians (Zhao et al, 2013c).
Socio-economic indexes for areas bring together a composite measure of advantage and disadvantage at the regional level. They provide a broad basis for tracking progress in addressing Indigenous disadvantage across the spectrum of determinants of health.
The ABS has developed a number of Socio-Economic Indexes for Areas (SEIFA). This measure uses the Index of Relative Socio-Economic Advantage/Disadvantage (IRSAD) which summarises a range of variables relating to people’s access to material and social resources and ability to participate in society as related to advantage/disadvantage (e.g. the proportion of families with high incomes, people with a tertiary education and employees in skilled occupations). Scores for each geographic area are produced by weighting these variables. All areas are then ordered from lowest to highest score and divided into equal-sized groups from most disadvantaged to most advantaged. The limitation with the ABS indexes is that the rankings of regions are based on the whole population in the area and will not necessarily reflect the profile for Indigenous Australians.
To address these shortcomings, Biddle (Biddle, 2009; 2013) over the last few years has constructed a number of Indigenous indexes of socio-economic outcomes. The results from this work are also included here.
Findings
In 2011, Aboriginal and Torres Strait Islander peoples were over-represented in the three most disadvantaged deciles, ranked according to the ABS IRSAD SEIFA. Thirty-seven per cent of Indigenous Australians lived in areas in the most disadvantaged decile (the bottom 10%), compared with 9% of the non-Indigenous population. Only 1.8% of Indigenous Australians lived in areas in the most advantaged decile (the top 10%).
Analysis at the jurisdictional level suggests that in all states and territories a greater proportion of the Indigenous Australian population lived in the most disadvantaged quintile (bottom 20%) compared with the non-Indigenous population. The NT had the highest proportion (74%) and the ACT the lowest proportion (2.6%) of Aboriginal and Torres Strait Islander peoples living in the most disadvantaged quintile areas. Tasmania had the lowest proportion (1%) and the ACT the highest proportion (35%) of Indigenous Australians living in the most advantaged quintile areas (top 20%).
These results need to be interpreted with caution. Indigenous Australians often represent a small proportion of the population in each area and therefore the socio-economic status of the area as a whole will not always reflect the socio-economic status of the Indigenous residents (the ‘ecological fallacy’). One study found that Indigenous Australians consistently had a lower socio-economic status than the SEIFA score for the area (Kennedy & Firman, 2004).
Biddle (2009; 2013) has constructed a number of Indigenous indexes of socio-economic outcomes based on Indigenous data from the 2001, 2006 and 2011 Censuses. These studies have consistently found that for Indigenous Australians there is a clear gradient of disadvantage by remoteness. Capital city regions ranked relatively well while remote regions ranked relatively poorly. Income, employment and education correlated geographically while other areas of wellbeing showed more complex patterns.
Within each region there was substantial variation across the smaller, underlying Indigenous Areas. For example, while Sydney was the highest ranking Indigenous Area across all of Australia, the Indigenous population in areas such as Blacktown and Campbelltown had outcomes that were closer to those found in remote Australia. Similar variation was found in remote Indigenous areas, demonstrating that any geographic strategy for addressing Indigenous disadvantage must be targeted below the regional level (Biddle, 2009).
The analysis based on the 2011 Census found that in every area, Indigenous Australians had higher levels of socio-economic disadvantage compared with the non-Indigenous population of the area. There was no single area in Australia where the Indigenous population had better or even relatively equal outcomes compared with the non-Indigenous population. The gap between the two populations was smallest in city and regional rural areas (37–38 percentage points) and highest in Indigenous towns (89 percentage points) and remote dispersed settlements (81 percentage points) (Biddle, 2013). This study found that, over time, the ranking for most Indigenous areas remained similar, particularly for the top and bottom-ranked areas. City areas, large regional towns and remote towns remained relatively stable. There was a relative worsening of outcomes in small regional towns and rural areas and a relative improvement in Indigenous towns and remote dispersed settlements (Biddle, 2013).
Any regional level analysis of complex social and economic issues using Census data will be affected by the scope of the questions included in the Census, the ‘ecological fallacy’ and data quality issues. However, this type of analysis does provide useful insights into regional variations in outcomes and comparisons between Indigenous and non-Indigenous population groups.
Figures
Figure 2.09-1
Population distribution by SEIFA advantage/disadvantage decile, by Indigenous status, 2011
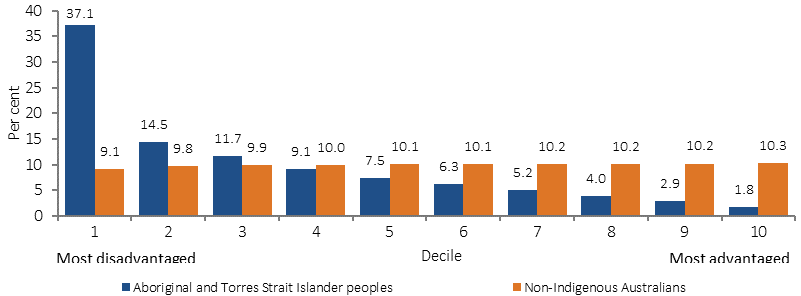
Source: AIHW analysis of ABS 2011 Census
Figure 2.09-2
Population distribution by SEIFA advantage/disadvantage quintiles, Indigenous population by state/territory and total population, 2011
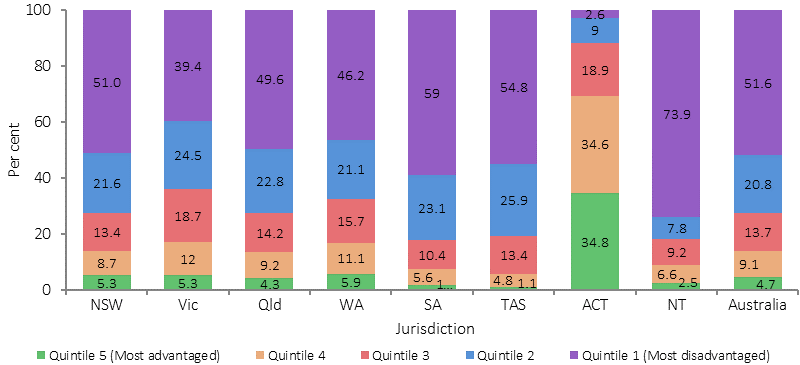
Source: AIHW analysis of ABS 2011 Census
Figure 2.09-3
Indigenous-specific index socio-economic percentile rank and standard deviation by location type, 2011
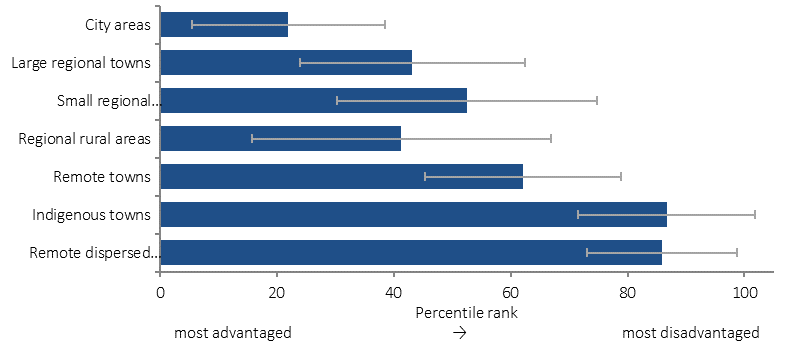
Source: (Biddle, 2013) Indigenous Relative Socio-economic Outcomes index
Figure 2.09-4
Indigenous and non-Indigenous pooled socio-economic percentile ranks and standard deviations, by location type, 2011
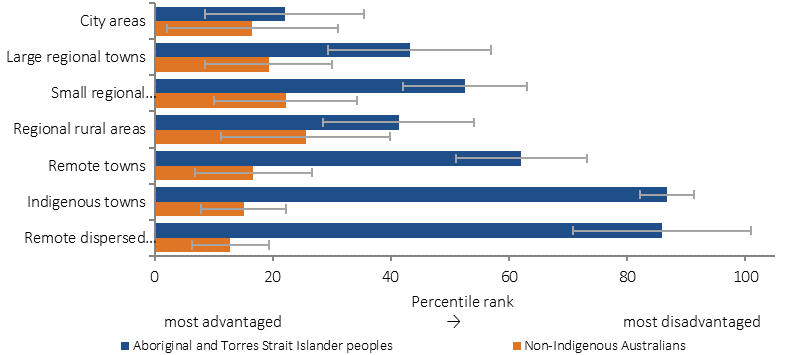
Source: (Biddle, 2013) Pooled Indigenous and Non-Indigenous Relative Socio-economic Outcomes index
Implications
COAG has set targets to reduce the gap in Indigenous disadvantage across health, education and economic participation. This summary measure supplements what is known and reported in other measures about the relative disadvantage that Indigenous Australians experience across a wide spectrum of social and economic issues. This may help in identifying areas of high need.
Among Indigenous Australians, education, location, discrimination, health, disability, labour market discrimination and social norms all play a role in explaining disadvantage with no single factor dominating (Biddle, 2015b).