Regional analysis
Remoteness area of residence influences the social and environmental context, including factors ranging from cultural identification and social networks through to educational and employment opportunities. Connectedness to family and community, land and sea, culture and identity have been identified as integral to health from Aboriginal and Torres Strait Islander perspectives (NAHSWP, 1989).
In 2011, around 79% of Indigenous Australians lived in regional and metropolitan areas and 21% lived in remote and very remote areas. While only 14% of Indigenous Australians lived in very remote areas, they made up a large proportion of those living in very remote areas (45%) and this pattern varies by jurisdiction (see Demographic context).
The Indigenous burden of disease study found a gradient in the burden of disease and injury by remoteness (AIHW, 2016f). Remote areas had the highest rate of Indigenous burden in 2011, followed by very remote areas. Inner regional areas had the lowest rate of total burden for Indigenous Australians. Remote areas also had the largest gap in the burden between Indigenous and non-Indigenous Australians (see Figure 17). Mental and substance use disorders was the leading contributor to overall Indigenous burden in major cities, inner regional and outer regional areas, contributing 25%, 23% and 21% of the burden respectively. Injuries were the leading contributor to overall Indigenous burden in remote and very remote areas contributing 19% of the burden. The study notes data quality concerns with the non-fatal estimates (AIHW, 2016l) page 284).
Figure 17
Age-standardised disability-adjusted life year rates (per 1,000 people) by Indigenous status and remoteness, 2011
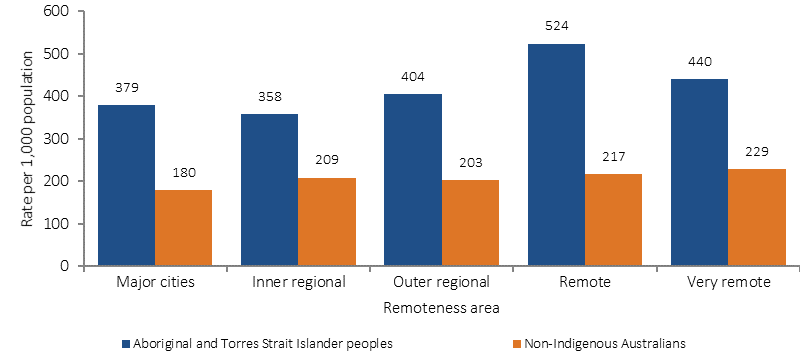
Source: AIHW (2016)
There is also a gradient by remoteness across a range of diseases. For example, measured rates of diabetes for Indigenous adults were higher in remote areas (21%) than in non-remote areas (9%) in 2012–13 (see Figure 18).
Figure 18
Proportion of Indigenous adults with diabetes by remoteness, 2012–13
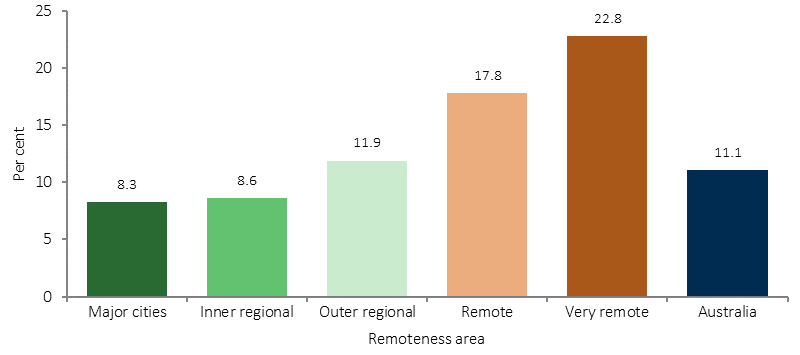
Source: ABS analysis of 2012–13 AATSIHS
The incidence of patients commencing ongoing kidney replacement therapy (dialysis or kidney transplantation) for end stage kidney disease was higher for Indigenous Australians in remote (132 per 100,000) and very remote areas (133 per 100,000) than for those in major cities (29 per 100,000). For non-Indigenous Australians, rates were similar across all regions (see Figure 19).
Figure 19
Age-standardised incidence of treated end stage kidney disease by Indigenous status and remoteness, 2012–14
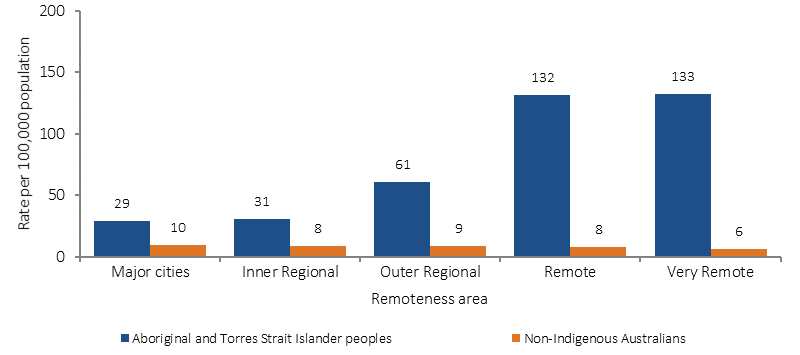
Source: AIHW analysis of ANZDATA
There are also variations by region on a number of health risk factors. In 2014–15, Indigenous Australians aged 15 years and over living in major cities had lower current smoking rates (36%) than those living in very remote areas (53%).
Rates of overweight/obesity also vary by remoteness. In 2012–13, the proportion of Indigenous Australians aged 15 years and over who were obese ranged from 40% in inner regional areas to 32% in very remote areas.
Indigenous Australians aged 15 years and over living in remote areas were more likely to rate their overall life satisfaction with the highest overall score (27%) than those in non-remote areas (14%).
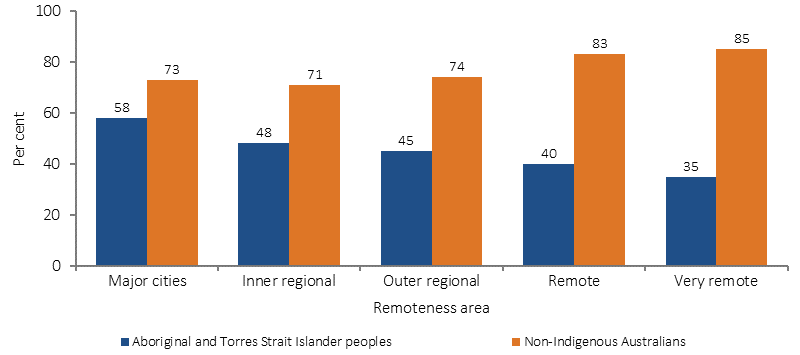
In 2014–15, Indigenous Australians aged 15 years and over living in remote/very remote areas were more likely to report their health as being good/excellent (80%) compared with those living in non-remote areas (73%). Note that interpretation of the self-assessed health question will be influenced by the person's view of 'health' and whether the concept is perceived holistically to include social, cultural, emotional and spiritual wellbeing, or as a biomedical concept linked to the absence of disease and incapacity (NAHSWP, 1989; Vass et al, 2011).
In 2014–15, Indigenous Australians who lived in remote areas (89%) were more likely than those in non-remote areas (70%) to recognise homelands/traditional country, and more likely to live on homelands/traditional country (44% compared with 17% respectively).
Those living in remote areas were more likely to speak an Australian Indigenous language (55%) than those living in non-remote areas (8%) and to be involved in selected cultural events, ceremonies or organisations in the last 12 months (82% and 57% respectively). Those in remote areas were more likely to report face to face contact with family and friends living outside the household every day (66%) compared with those in non-remote areas (37%); were more likely to provide support to relatives living outside the household (60% compared with 47%); and also more likely to have attended a funeral (81% compared with 55%).
In 2014–15, Indigenous Australians adults living in very remote areas were more likely to be in the lowest income quintile (61%) than those in major cities (25%).
Access to appropriate housing is also more difficult in remote areas. In 2014–15, half (50%) of Indigenous Australians in very remote areas lived in overcrowded households, compared with 15% in major cities. In very remote areas 37% of Indigenous households were living in dwellings with major structural problems compared with 25% of households in major cities.
In 2015, proportions of Aboriginal and Torres Strait Islander students achieving literacy and numeracy benchmarks were lower for students living in remote and very remote areas compared with metropolitan and provincial areas (see Figures 22 and 23). This relationship was also evident for non-Indigenous students, but was much less marked, resulting in a much larger gap between Indigenous and non-Indigenous results in remote areas than in metropolitan areas. For example, in 2015, 82% of all Indigenous students in metropolitan areas met or exceeded the National Minimum Standards for Year 5 reading compared with only 38% of Indigenous students in very remote areas.
Figure 22
Proportion of Indigenous Year 3 students at or above the national minimum standard in Reading, by Indigenous Area, 2015
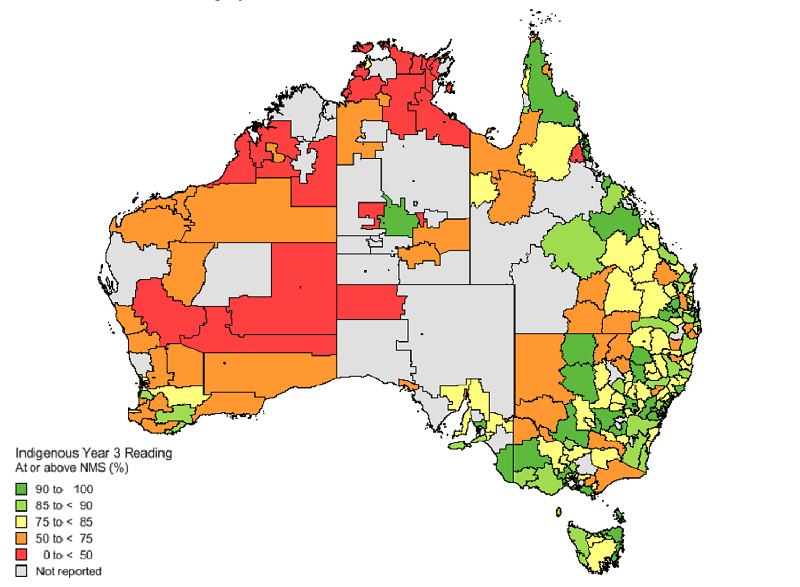
Source: ACARA 2015
Figure 23
Proportion of Year 3, 5, 7 and 9 Indigenous students at or above the national minimum standards for reading, by remoteness area, 2016
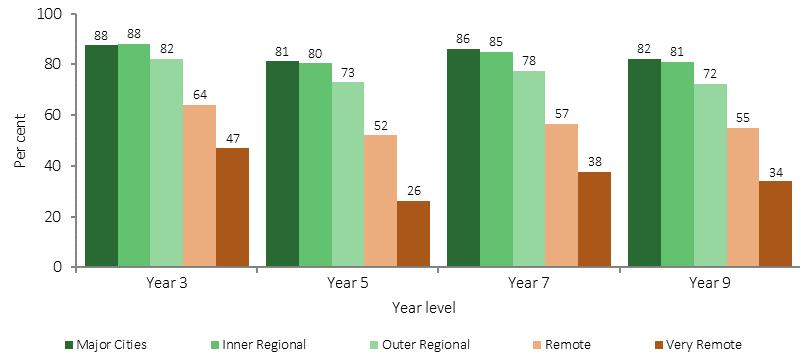
Source: ACARA 2016
The gap in school attendance rates between Indigenous and non-Indigenous students is also significantly greater in remote and very remote areas than urban areas. In 2014–15, Indigenous Australians aged 18 years and over living in non-remote areas were more likely than those living in remote areas to have completed Year 12 or equivalent (30% compared with 20%). In 2014–15, Indigenous Australians aged 15 years and over living in non-remote areas were also more likely to have completed a non-school qualification (50%) than those in remote areas (34%).
In 2014–15, the employment rate for Indigenous Australians aged 15–64 years was highest in major cities (58%), followed by 48% in inner regional areas. The lowest rate was 35% in very remote areas (see Figure 24). The proportion of Indigenous youth aged 17–24 years who were fully engaged in study or work was 42% in 2014–15; about half the non-Indigenous rate (74%). Rates of Indigenous youth fully engaged ranged from 58% in major cities to 15% in very remote areas. There is a strong link between education and employment—at high levels of education there is virtually no employment gap between Indigenous and non-Indigenous Australians.
Figure 24
Employment rate by Indigenous status persons aged 15–64 years, by remoteness, 2014–15
Source: ABS and AIHW analysis of 2014–15 NATSISS and 2014 SEW
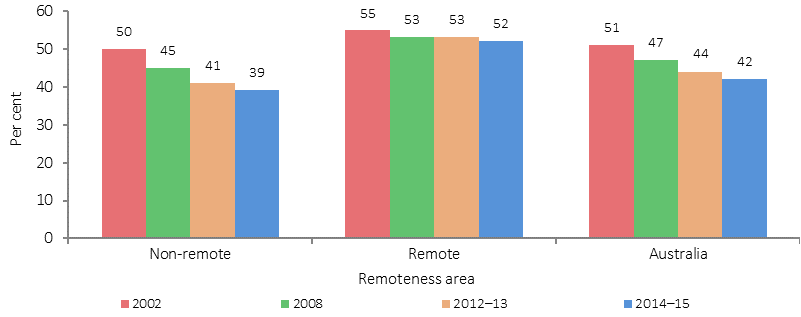
In 2014–15, Indigenous Australians aged 15 years and over who lived in very remote areas were more likely to be current smokers (53%) than those living in major cities (36%). This is reflective of the large declines in smoking rates for Indigenous Australians living in non-remote areas (from 50% in 2002 to 39% in 2014–15); while in remote areas rates have remained steady (55% in 2002 and 52% in 2014–15) (see Figure 25).
Figure 25
Proportion of current smokers, Aboriginal and Torres Strait Islander peoples aged 15 years and over, 2002, 2008, 2012–13 and 2014–15
Source: ABS and AIHW analysis of the 1994 NATSISS, 2002, 2008 and 2014–15 NATSISS and 2012–13 AATSIHS
The 2012–13 Health Survey data, based on 24-hour recall, shows that the median amount of alcoholic beverages consumed by Indigenous adults was higher in remote areas (1,717 grams) than non-remote areas (1,007 grams). In 2014–15, substance use in the last 12 months was higher for those in non-remote areas (33%) compared with remote areas (21%) for Indigenous Australians aged 15 years and over. The nutrition component of the 2012–13 Health Survey found that Indigenous Australians in non-remote areas were more likely than those in remote areas to consume: fruit (49% compared with 35%) and soft drinks (39% compared with 32%); and less likely to consume meat dishes (74% in non-remote compared with 81% in remote areas). In 2012–13, Indigenous obesity rates varied geographically for those aged 15 years and over. Obesity was highest in inner regional areas (40%) and lowest in very remote areas (32%). Rates were similar in major cities (37%) and in outer regional and remote areas (38%).
The 2014–15 Social Survey included questions on neighbourhood/community problems. Indigenous Australians living in remote areas were more likely to report problems involving youth (51%) than those living in non-remote areas (26%); alcohol (65% and 31% respectively); family violence (48% and 19% respectively); and assault (46% and 14% respectively).
During the two years to June 2015 Indigenous hospitalisation rates for assault were highest in remote and very remote areas (22 and 21 per 1,000 respectively) compared with inner regional areas (3 per 1,000) and major cities (4 per 1,000). Hospitalisation rates for assault for Indigenous females were lower than for Indigenous males in non-remote areas, but were higher than for males in remote areas (25.7 per 1,000 and 18 per 1,000 respectively) and very remote areas (25.2 per 1,000 for females and 17.1 per 1,000 for males). The non-Indigenous female rate was lower than the rate for non-Indigenous males in all remoteness areas. After adjusting for differences in the age structure of the two populations, the Indigenous female rate was 53 times the non-Indigenous female rate in remote areas (and 38 times in very remote areas).
Availability of health care services varies across Australia. In 2012–13, 95% of Indigenous Australians living in major cities reported GPs being available compared with 31% in very remote areas. Aboriginal Medical Services were reported as being locally available by 61% of those living in outer regional areas and 26% of those in very remote areas. In 2012–13, 77% of Indigenous Australians living in very remote areas reported that there were community clinics available compared with 33% of those living in major cities) (see Figure 26).
In 2015, full-time equivalent rates for medical practitioners working as clinicians declined by remoteness (from 442 FTE per 100,000 in major cities to 263 in remote/very remote areas), particularly for specialists (AIHW, 2016m).
Figure 26
Available sources of health care by type, reported by Indigenous Australians, by remoteness, 2012–13
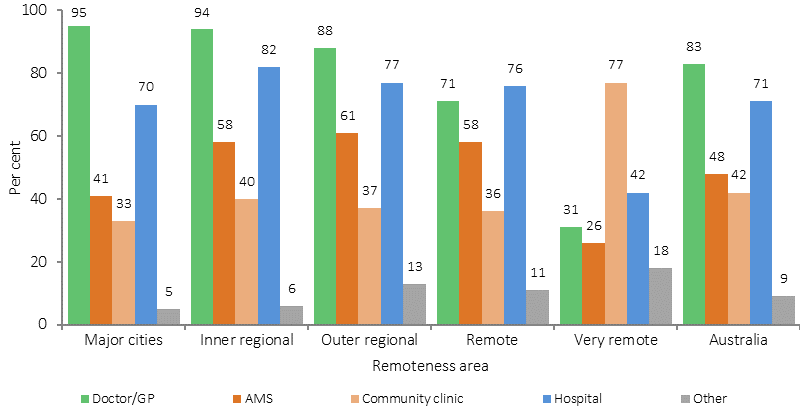
Source: ABS and AIHW analysis of 2012–13 AATSIHS
AIHW (2016p) analysis of the distribution of the clinical health workforce in relation to the Aboriginal and Torres Strait Islander population found that a higher proportion of Indigenous Australians live in areas with lower health workforce access scores than non-Indigenous Australians. It was estimated that approximately 46,200 Indigenous Australians live in areas of low relative supply of GPs (6.9% of the Indigenous population compared with 0.5% of the non-Indigenous population). The map in Figure 27 shows the areas with lowest relative supply of GPs in the dark blue and those within one hour drive time in yellow.
Figure 27
GP availability score and drive time boundaries, by SA2, 2014
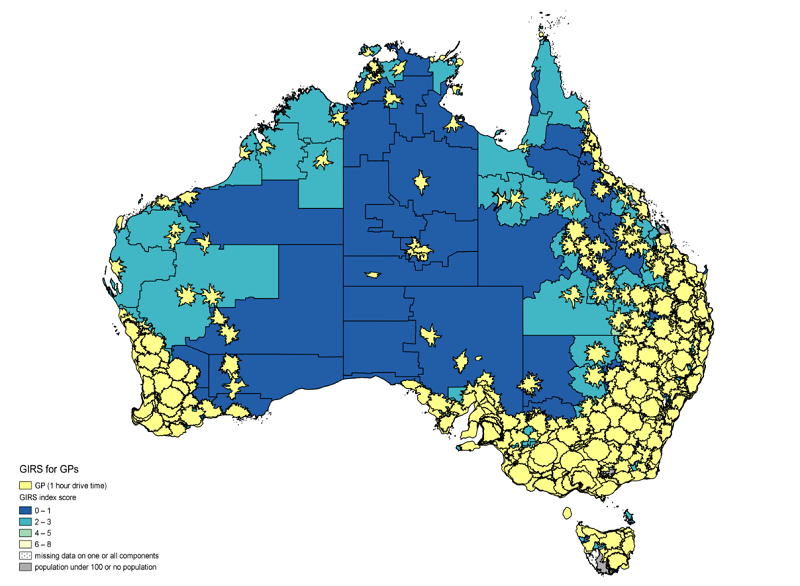
Source: AIHW (2016p)
In 2012–13, Indigenous Australians living in non-remote areas (32%) were more likely to report not seeking care when needed than those living in remote areas (22%).
Medicare data shows that in 2015–16, Indigenous Australians living in remote areas had a lower rate of services claimed than those living in non-remote areas. This gradient was clear for Medicare service claim rates for GP, allied health and specialist services for both Indigenous and non-Indigenous Australians. See Figure 28 for the GP pattern. Medicare claims by Indigenous Australians for after-hours services were also highest in major cities (656 per 1,000), and lowest in remote areas (169 per 1,000). On the other hand, rates of claims for nurse/allied health services increased by remoteness for Indigenous Australians. This also reflects the types of services that are available in remote areas.
Figure 28
Age-standardised rate of GP MBS services claimed through Medicare, by Indigenous status and remoteness area, 2015–16
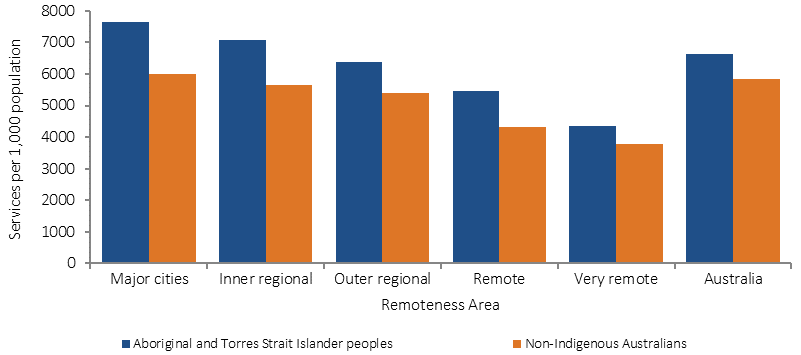
Source: Medical Benefits Division, Department of Health
Medicare claim rates for private specialist care among Indigenous Australians were highest in major cities (582 per 1,000) and lowest in very remote areas (140 per 1,000). For GP services, Indigenous Australians claimed at a higher rate across all remoteness areas compared with non-Indigenous Australians (with the greatest difference in major cities and the smallest in very remote areas) (see Figure 29).
Figure 29
Age-standardised rate of specialist MBS services claimed through Medicare, by Indigenous status and remoteness area, 2015–16
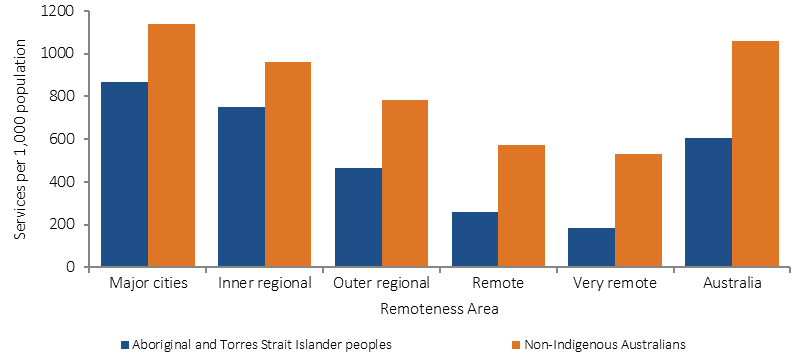
Source: Medical Benefits Division, Department of Health
In contrast, the hospitalisation data shows a different pattern. During the two years to June 2015, data from hospital records show that the hospitalisation rates for Indigenous Australians were highest in remote areas followed by very remote areas (and lowest in major cities) (see Figure 30). For non-Indigenous Australians, rates were similar across geographic areas except in very remote areas where rates were lower. The largest differences between rates for the two populations were in remote and very remote areas. Discharges from hospital against medical advice were most common for Indigenous Australians living in remote and very remote areas.
Figure 30
Age-standardised hospitalisation rates (excluding dialysis) by Indigenous status and remoteness, July 2013–June 2015
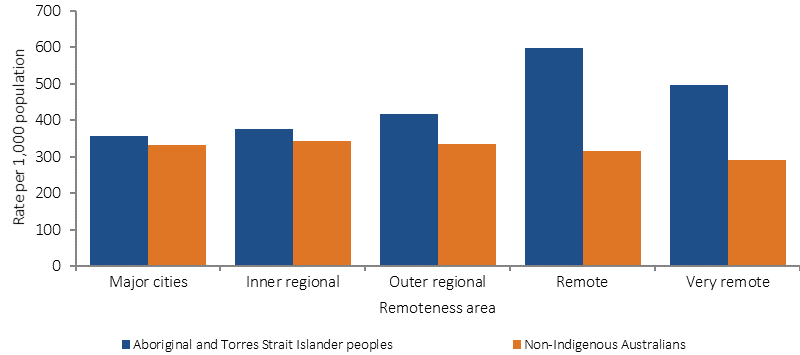
Source: AIHW analysis of National Hospital Morbidity Database