1.12 HIV/AIDS, hepatitis and sexually transmissible infections
Page content
Why is it important?
Aboriginal and Torres Strait Islander peoples currently experience a relatively high number of notifications for bacterial sexually transmissible infections (STIs), relative to their representation in the total population (3%). In 2013–15, 13%–31% of new STI cases were for Indigenous Australians, and there were high notification rates for hepatitis B and C. Each of these infections can have potentially serious consequences if left untreated. Chronic hepatitis causes serious illness and can also progress to cirrhosis of the liver, cancer, and premature death (ASHA, 2017). It is estimated that of the 1% of the Australian population that is living with chronic hepatitis B, 9% are Aboriginal and Torres Strait Islander peoples (MacLachlan et al, 2013).
Indigenous Australians experience disease burden from unsafe sex 3.9 times that of non-Indigenous Australians (AIHW, 2016f). STIs can have serious long-term consequences, such as chronic abdominal pain or infertility in women after gonorrhoea and chlamydia, and heart and brain damage caused by syphilis (Bowden et al, 2002; Department of Health, 2014; Guy et al, 2012). Several of these infections can cause miscarriage (Campbell, S et al, 2011). The impact of HIV is well documented.
Notification data includes cases that have been tested, diagnosed and notified to health authorities, representing only a proportion of the total incidence of disease. Changes in notification rates over time are influenced by a range of factors including access to health care, improved screening programmes for Indigenous Australians and improved accuracy of tests. For Indigenous Australians, the accuracy of Indigenous identification in the data is also an issue and varies by jurisdiction. Improved primary health care can lead to increased testing and a corresponding increase in notification rates.
Findings
During the three years 2013 to 2015 there were approximately 19,500 notifications among Aboriginal and Torres Strait Islander peoples for chlamydia (in Qld, WA, SA and the NT combined). After adjusting for differences in age structure, the notification rate was 4 times as high as for other Australians. Between 1996–97 and 2013–15, in WA, SA and the NT combined, the notification rate for chlamydia doubled for Indigenous Australians. While rates for other Australians also increased, they did so at a slower pace and so the gap widened.
For the period 2013–15, there were approximately 11,000 notifications of gonorrhoea among Aboriginal and Torres Strait Islander peoples (for all jurisdictions combined excluding NSW). After adjusting for differences in age structure, rates were 14 times higher than for other Australians. Between 1996–97 and 2013–15 in WA, SA and the NT combined, there was no significant change in rates for Indigenous Australians and no change in the gap. For other Australians there was a significant increase for males but no significant change for females.
There were also 1,500 notifications for syphilis among Indigenous Australians over this period (all jurisdictions). After adjusting for differences in age structure, rates were 5 times as high as for other Australians.
Between 1996–97 and 2013–15 in WA, SA and the NT combined, the notification rate for syphilis declined for Indigenous Australians. However, between 2011 and 2016, there has been an outbreak of syphilis across northern Australia, resulting in four reported deaths among Indigenous Australians (MSOWG, 2016).
During the three years 2013 to 2015 there were 308 new notifications for hepatitis B and 1,021 for hepatitis C among Indigenous Australians. Rates were 3.9 times other Australian rates for hepatitis C and 1.7 times for hepatitis B. Between 2007–09 and 2013–15 there was a decline in the hepatitis B notification rate for Indigenous Australians in WA, SA and NT combined. As at December 2015, hepatitis B vaccination rates were at 96% and 95% for Indigenous and non-Indigenous children aged two years respectively.
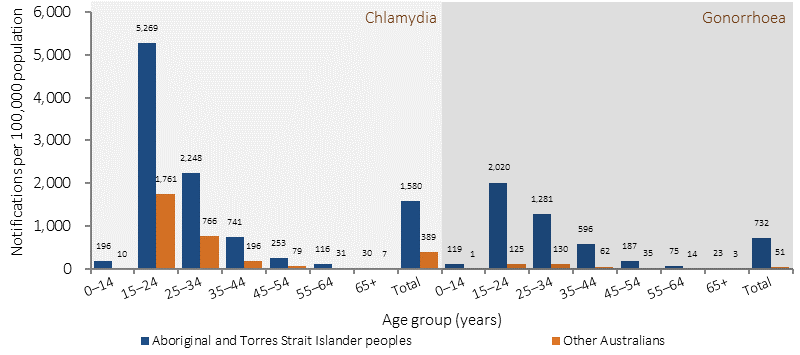
In 2013–15 for hepatitis C, notifications were highest in the 25–44 age groups for both populations. There has been a significant increase over time in hepatitis C notification rates for Indigenous Australians while over the same period there was a decline for other Australians and an increase in the gap (1996–97 to 2013–15 in WA, SA and the NT combined). The pattern of infection by age groups varies by disease. Those aged 15–24 years have the highest rates for chlamydia and gonorrhoea while the other diseases extend into the middle years.
There have been no significant changes detected in the notification rate of HIV infection for Aboriginal and Torres Strait Islander peoples and other Australians between 2001–03 and 2013–15. For the period 2013–15, the notification rate of HIV was 5.5 per 100,000 for Indigenous Australians and 4.5 per 100,000 for other Australians. Sexual contact between men was the highest HIV risk for both populations; however, injecting drug use represented 22% of Indigenous risk exposure, compared with 2% for other Australians. AIDS is no longer a notifiable disease.
Figures
Figure 1.12-1
Age-standardised notification rate for 5 infectious diseases, Aboriginal and Torres Strait Islander peoples, WA, SA and the NT, 1996–97 to 2013–15
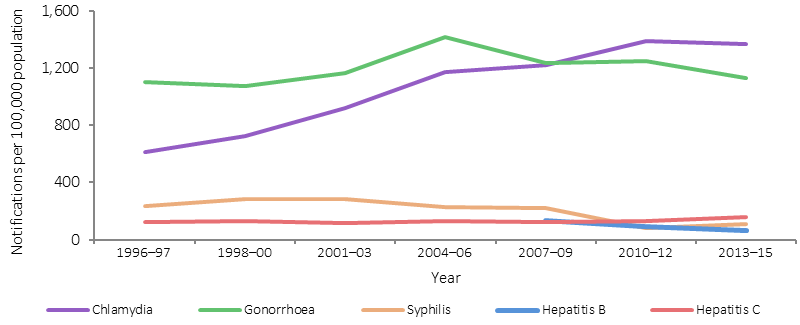
Source: AIHW analysis of National Notifiable Diseases Surveillance System
Figure 1.12-2
Age-standardised notification rates for HIV, by Indigenous status, 2001–03 to 2013–15
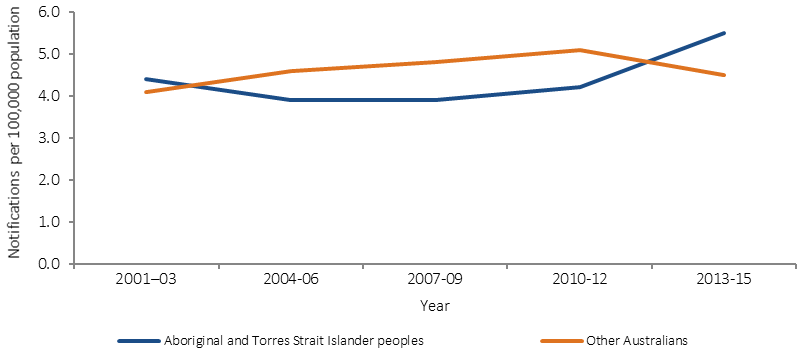
Source: AIHW analysis of National HIV Registry
Figure 1.12-3
Notification rates for chlamydia and gonorrhoea by Indigenous status and age, selected states(a), 2013–15

(a) Totals are age-standardised. Data are reported for Qld, WA, SA and the NT for chlamydia and for Vic, WA, SA, Tas, ACT and NT for gonorrhoea.
Source: AIHW analysis of National Notifiable Diseases Surveillance System
Figure 1.12-4
Notification rates for hepatitis B and C by Indigenous status and age, selected states(a), 2013–15
(a)Totals are age-standardised. Data are reported for WA, SA, NT, ACT and Tas for hepatitis B and for WA, SA, NT and Tas for hepatitis C.
Source: AIHW analysis of National Notifiable Diseases Surveillance System
Implications
STIs are a major health problem for Aboriginal and Torres Strait Islander peoples. Bacterial STIs are treatable through antibiotics, but if left untreated can have significant health consequences (ASHA, 2017). A range of access issues have been identified for health care (see measure 3.14) and shame has been found to be an additional factor for STIs (MacPhail & McKay, 2016). Risky sexual behaviours, along with illicit drug use and alcohol use are important risk factors for STIs (Wand et al, 2016). Social determinants have also been linked to patterns of risky sexual behaviour (MacPhail & McKay, 2016).
High rates of infection for Indigenous Australians and disparity with rates for non-Indigenous Australians highlight the need for targeted prevention and information, along with opportunistic testing (Graham, S et al, 2015; Fairley & Hocking, 2012; O'Connor et al, 2014). Evidence suggests that comprehensive strategies including community education and health promotion are most effective in reducing STIs (Strobel & Ward, 2012). Peer education has also been noted as a potential strategy for prevention (MacPhail & McKay, 2016).
The Indigenous rate of HIV in 2013–15 was 1.2 times the non-Indigenous rate. Nevertheless, Indigenous Australians remain disproportionately vulnerable to HIV due to factors such as high rates of STIs, poorer general health, high levels of injecting drug use and also unique challenges in accessing HIV treatment and care (Templeton et al, 2015; Ward et al, 2016). A recent study found no difference in HIV clinical outcomes between Indigenous and non-Indigenous Australians, however Indigenous patients had lower rates of testing for HIV and lipid/glucose measurements at half the recommended frequency (Templeton et al, 2015).
Notification rates for chlamydia and gonorrhoea are highest in the 15–24 year age group. The value of youth having a voice in the delivery of health services, programmes and policies that affect them, is recognised in the Implementation Plan for the National Aboriginal and Torres Strait Islander Health Plan 2013–2023. A deliverable of the Implementation Plan is the development of a national health policy for Aboriginal and Torres Strait Islander young people by 2018. This policy will be developed alongside Aboriginal and Torres Strait Islander young people, and will include appropriate strategies to address STI and blood-borne viruses.
The Fourth National Aboriginal and Torres Strait Islander Blood Borne Viruses and Sexually Transmissible Infections Strategy 2014–17 is one of a set of five national strategies aimed at reducing the transmission of STIs and blood-borne viruses and the associated morbidity, mortality, personal and social impacts. Priority action areas include improving vaccination coverage for hepatitis B and HPV in adults, increasing provider initiated testing, increasing treatment rates for people with blood-borne viruses, supporting Aboriginal community controlled health services, reducing racism, stigma and discrimination in community and health-care settings and improving prevalence and incidence data. Previous strategies have increased testing and may account for improvements in detection and increased rates. However, under-identification of Indigenous Australians and the volatility in small numbers means that caution should be used in interpreting trends in these data.