Social determinants
Page content
Introduction
The origins of health behaviours are located in a complex range of environmental socio-economic, family and community factors. 'Inequities in health, avoidable health inequalities, arise because of the circumstances in which people grow, live, work, and age, and the systems put in place to deal with illness. The conditions in which people live and die are, in turn, shaped by political, social, and economic forces' (Nettleton et al, 2007).
Connectedness to family and community, land and sea, culture and identity have been identified as integral to health from Aboriginal and Torres Strait Islander perspectives (NAHSWP, 1989).
Studies have found that between one-third and one-half of the health gap between Aboriginal and Torres Strait Islander peoples and non-Indigenous Australians is associated with differences in socio-economic status (Booth & Carroll, 2005; DSI Consulting Pty Ltd & Benham, 2009).
Analysis by the AIHW of the 2011–13 Health Survey has found that selected social determinants such as education, employment status, overcrowding and household income accounted for 34% of the gap in health outcomes between Indigenous and non-Indigenous Australians; selected risk factors such as smoking, obesity, alcohol, and diet accounted for 19% of the gap; and that there was also overlap between social determinants and risk factors (11% of the gap) (see Figure 31). The relationships are complex and mediated by interactions with other factors. The remaining 47% are other factors that could not be explained by the model.
A recent study in the NT, of life expectancy at birth for Indigenous and non‑Indigenous Australians using data from the period 1986 to 2005, found that socio-economic disadvantage was the leading risk factor accounting for one-third to one-half of the gap in life expectancy between Indigenous and non‑Indigenous Australians (Zhao et al, 2013a).
Figure 31
Proportions of the health gap explained by social determinants and behavioural risk factors, 2011–13
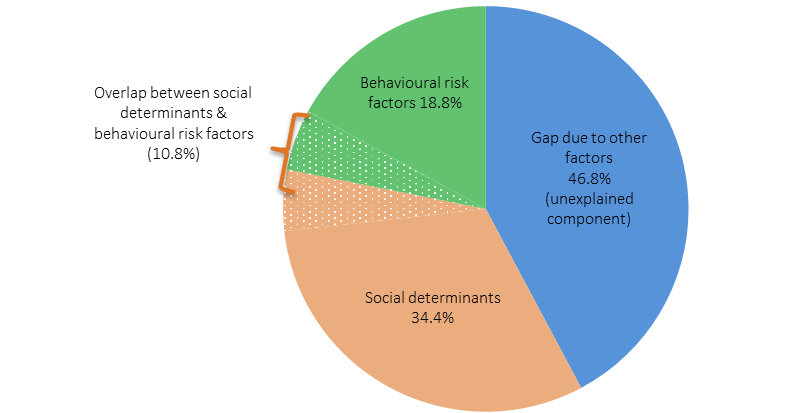
Source: AIHW (unpublished), 2016
Social determinants and health risk behaviours
Factors such as education and employment interact with other social determinants of health in ways which overlap, and either grow or diminish opportunities to move along the social gradient (Marmot, 2015).
Those who have completed year 12 are more likely to be employed, and those who are employed have a regular source of income which means they are more likely to be able to afford to live in a house in good repair: these factors combined contribute to a positon of relative inequality on the health gradient (Marmot, 2015).
These determinants of health are known to be associated with modifiable risk factors, which act in various combinations, to either increase the risks for adverse health outcomes or have a protective impact on health. For example, not smoking or not smoking within the house are both examples of reducing the health risks for children’s exposure to tobacco smoke (see measure 2.03).
The burden of disease study found that the risk factors causing the most Indigenous burden were tobacco use (12% of the total burden), alcohol use (8%), high body mass (8%), physical inactivity (6%), high blood pressure (5%) and high blood plasma glucose (5%). Dietary factors together accounted for 10% of the total burden (see Figure 32). Together, the 29 risk factors included in the study accounted for 51% of the gap in disease burden between Indigenous and non-Indigenous Australians. Tobacco use was the biggest contributor to this, accounting for 23% of the gap.
Figure 32
Proportion of burden attributable to leading risk factors, Indigenous Australians, 2011
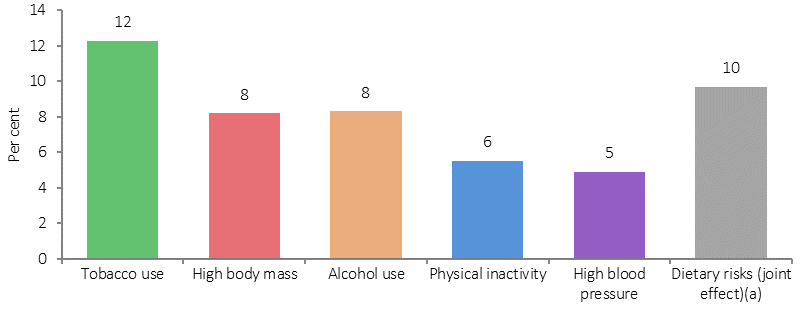
(a) Joint effect of 13 dietary risk factors.
Source: AIHW, 2016
Figure 33 shows that a higher proportion of Aboriginal and Torres Strait Islander peoples who complete Year 12 are non-smokers (72%) compared with those whose highest year of schooling was Year 10 or below (52%).
Figure 33
Relationship between highest year of school completed and health risk factors, Indigenous Australians aged 15 years and over, 2014–15
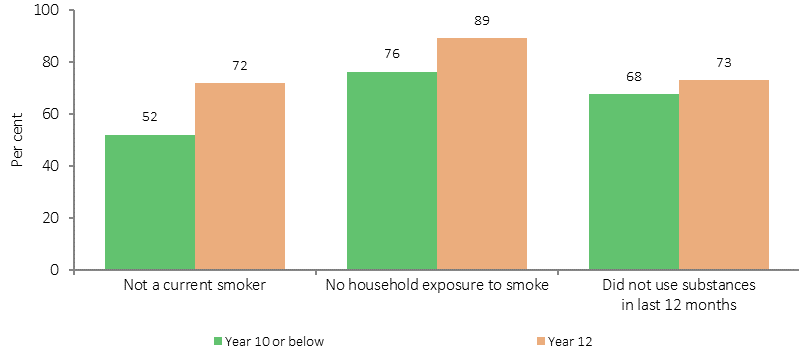
Source: ABS and AIHW analysis of 2014–15 NATSISS
Those who have completed Year 12 are also less likely to live in a household where smoking occurs indoors (89%) compared with those with schooling to Year 10 or below (76%). Similarly, those who were employed were more likely to be non-smokers (65%) than those who were unemployed (47%) (see Figure 34).
Figure 34
Relationship between employment and risk factors, Indigenous Australians aged 15 years and over, 2014–15
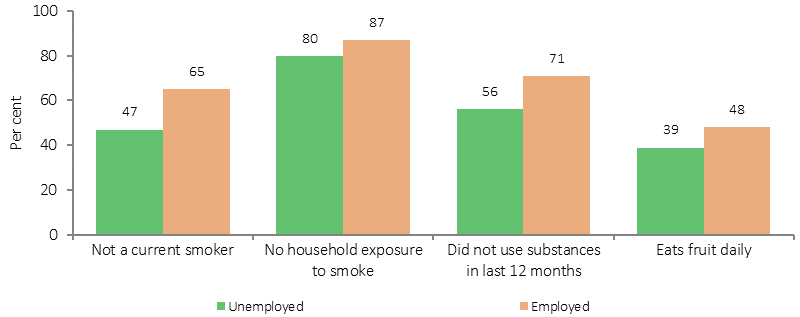
Source: ABS and AIHW analysis of 2014–15 NATSISS
In 2014–15, 36% of Indigenous adults were living in households in the lowest income quintile; while 6% were in the top income quintile and 14% in the second highest. Indigenous Australians in the top two income quintiles were less likely to smoke (29%) than those in the bottom income quintile (53%). In 2014–15, 50% of Indigenous Australians aged 15 years and over were living in households that could not raise $2,000 within a week in an emergency.
Social determinants and health outcomes
Alongside increased health risk behaviours, social determinants also directly affect health outcomes.
The Aboriginal and Torres Strait Islander burden of disease study found a trend of increasing rates of disease burden as socio-economic disadvantage increased (AIHW, 2016f). Figure 35 shows that Indigenous Australians living in areas with the most socio-economic disadvantage experienced the highest rate of disease burden (453 per1,000 people), more than twice the rate of burden in areas with the least socio-economic disadvantage (187 per 1,000 people) (based on the Indigenous-specific index of socio-economic disadvantage) in 2011. A gradient of increasing burden with increasing socio-economic disadvantage was observed in most disease groups. The greatest relative differences by socio-economic group were for kidney and urinary diseases, cardiovascular diseases, mental and substance use and endocrine disorders (including diabetes).
Figure 35
Age-standardised disability-adjusted life year rates (per 1,000), by socio-economic disadvantage quintile, Indigenous Australians, 2011
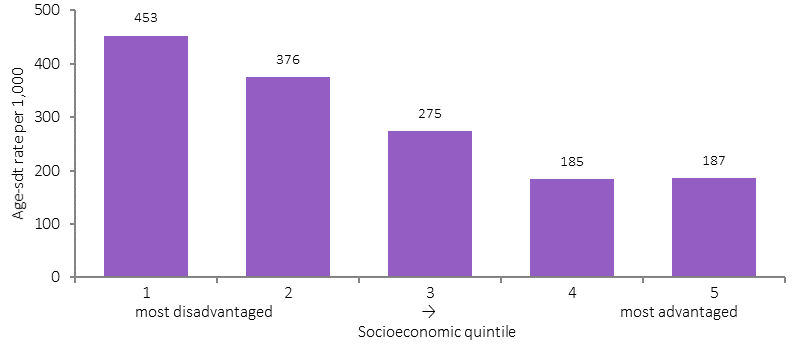
Source: AIHW (2016)
A study of the NT population also found a linear relationship between increased risk of mortality and socio-economic disadvantage (see Figure 36) (Zhao et al, 2013c).
Figure 36
Mortality rate ratios by socio-economic quintiles, NT
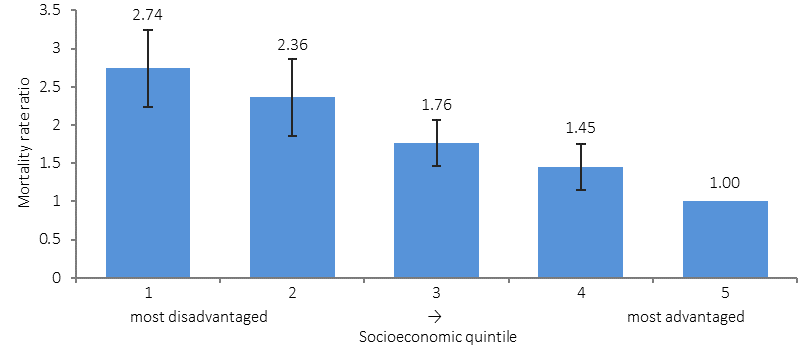
Source: Zhao et al. 2013b
In 2012–13, rates of high blood pressure (measured and/or self-reported) were lower for Indigenous Australians who completed school in Year 12 (18%) compared with those who completed school before Year 10 (38%). Rates were also lower for those living in the most advantaged areas (22%) compared with those in the most disadvantaged areas (28%) (see Figure 37). Rates of diabetes were also lower for those in the most socio-economically advantaged areas (9%) compared with disadvantaged areas (16%) and also for those who finished school in Year 12 (7%) compared with Year 9 or below (23%).
Figure 37
Relationship between high blood pressure and social factors, Indigenous Australians, 2012–13
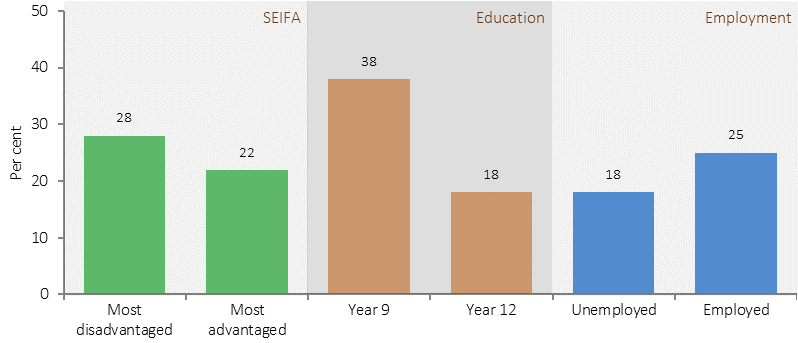
Source: ABS and AIHW analysis of 2012–13 AATSIHS
In 2014–15, Indigenous Australians aged 15 years and over in the top two income quintiles had higher rates of self-reported excellent/very good health status (52%) compared with those in the bottom quintile (37%). Rates were also higher for those who had completed Year 12 (50%) than for those who had finished school at Year 10 or below (34%) (see Figure 38).
In 2014–15, 76% of Indigenous Australians in the highest household income quintiles reported low/moderate psychological distress, compared with 60% of those in the lowest quintile. Those who had not experienced being without a permanent place to live were more likely to have low/moderate psychological distress (73%) compared with those who had experienced being without a permanent place to live (59%).
Figure 38
Relationship between excellent/very good self-assessed health status and social factors, Indigenous Australians, 2014–15
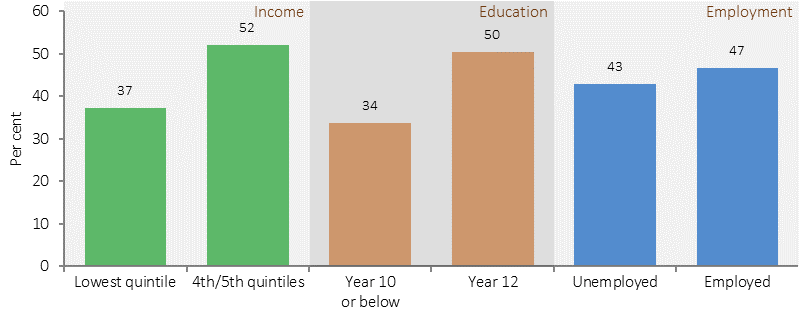
Source: ABS and AIHW analysis of 2014–15 NATSISS
While smoking, drug, alcohol, and high sugar consumption are risk factors for periodontal disease, there is also strong evidence that compromised early childhood development, lower income and living in poor housing conditions contribute to oral health inequalities (Moeller & Quiñonez, 2016). Oral health can be improved through regular health checks, however cost is a major barrier for Aboriginal and Torres Strait Islander peoples, which result in patterns of dental service use to address pain rather than preventable health practices (Durey et al, 2016). Poor dental health can in turn limit success in employment outcomes (Moeller & Quiñonez, 2016), and can create additional health complications in chronic health conditions such as diabetes (Leite et al, 2013) and kidney disease (Akar et al, 2011).
Social determinants also affect use of health services. In 2012–13, Aboriginal and Torres Strait Islander peoples in the highest income quintiles were less likely than those in the lowest income quintile to visit casualty/outpatients in the last 2 weeks.
Health as a determinant of social outcomes
A wide range of literature has shown evidence of the influence of health on educational and employment outcomes.
Analysis of the Longitudinal Study of Indigenous Children has found that 83% of Indigenous children with better health attended school at least 80% of the time compared with 65% of the time for children with poorer health (Arcos Holzinger & Biddle, 2015). In 2012–13, 20% of Indigenous children aged 5–14 years had days away from school in the last 2 weeks due to illness/injury. Analysis by the AIHW using 2004–05 Health Survey and 2008 Social Survey data has found that the odds of an Indigenous child aged 5–17 years with poor self-assessed health status currently studying were one-fifth that of an Indigenous child with excellent self-assessed health status (odds ratio of 0.225) (see AIHW Detailed Analyses).
Similarly, poor health adversely affects employment. In 2014–15, 54% of Indigenous Australians aged 15 years and over with excellent/very good health status were employed compared with 31% of those with fair/poor health. Those with fair/poor health status were more likely to not be in the labour force (59%) than those with excellent/good health status (33%). Those with no long-term health conditions were more likely to be employed (50%) than those with three or more long-term health conditions (35%). In 2014–15, the main reasons Indigenous Australians aged 15 years and over outside of the labour force were not looking for a job included childcare (22%), studying or returning to study (20%) and having a long-term health condition or disability (18%).
Analysis of pooled National Health Survey data has shown a strong negative relationship between major chronic diseases and fair/poor self-assessed health status with participation in the labour force (Belachew & Kumar, 2014).
Analysis of the 2004–05 Health Survey found significant associations between most measures of health (self-assessed health, having circulatory conditions, diabetes, arthritis, disability) and employment outcomes for Indigenous Australians. For example, Indigenous Australians aged 15–64 who reported poor or fair self-assessed health were less likely to be working full-time than those not in the labour force (odds ratios of 0.110 and 0.305, respectively). Similarly, people with disability were less likely to be working full-time (odds ratio of 0.154) (see AIHW Detailed Analyses for details).
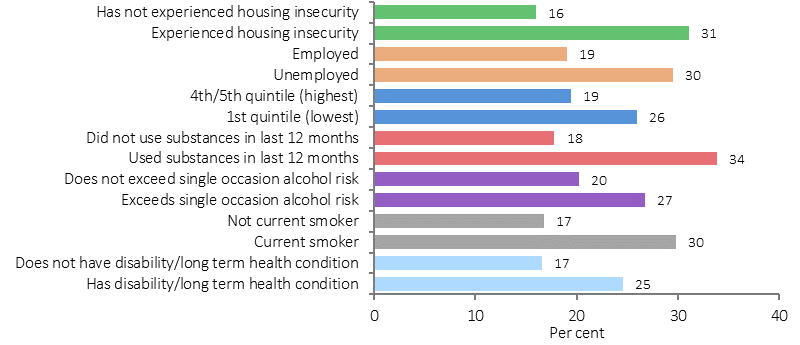
In 2014–15, 22% of Indigenous Australians aged 15 years and over reported they were a victim of physical or threatened violence in the last 12 months, 2.8 times the rate for non-Indigenous Australians (8%). Figure 39 shows the relationship between health and the experience of physical or threatened violence. Indigenous Australians with a disability/restrictive long-term health condition; those who exceeded the single occasion alcohol risk; and those who used substances in the last 12 months were more likely to have experienced physical or threatened violence in the last 12 months than those who had not experienced these conditions and risk factors. In addition, those in the lowest income quintile; those who were unemployed and those who had experienced housing insecurity were also more likely to have experienced physical or threatened violence than those without these social issues (see measure 2.10 for details).
Figure 39
Indigenous Australians aged 15 years and over, selected factors and experience of physical or threatened violence in previous 12 months, 2014–15
Source: ABS and AIHW analysis of NATSISS 2014-15