1.22 All causes age-standardised death rates
Page content
Why is it important?
The mortality rate of a population provides a summary measure of the overall health status of that population. However, it has some well-known limitations. There may be delays for many years before improvements in health status lead to reductions in mortality, and mortality statistics do not reflect the burden of illness in a population for diseases that do not necessarily result in death, such as arthritis and depression. Despite these limitations, mortality rates are a useful measure with which to compare the overall health status of different populations and to monitor changes in overall health status of populations over time. The all causes mortality rate for Aboriginal and Torres Strait Islander peoples is 1.7 times that for non-Indigenous Australians, indicating that the overall health status of Aboriginal and Torres Strait Islander peoples is worse than that of non-Indigenous Australians.
Findings
During the period 2011–15, in those jurisdictions with adequate quality data (NSW, Qld, WA, SA, and the NT), 13,106 deaths were identified as those of Aboriginal and Torres Strait Islander peoples. After adjusting for age differences between the two populations, the all causes mortality rate was 1.7 times as high for Aboriginal and Torres Strait Islander peoples as the rate for non-Indigenous Australians (992 versus 580 deaths per 100,000 population).
There was a 15% reduction in all cause mortality rates for Aboriginal and Torres Strait Islander peoples in the time period 1998 to 2015 (in NSW, Qld, WA, SA, and the NT). Non-Indigenous death rates also declined over this period and there was no significant change in the gap. There was no change in the relative gap.
Most deaths for Aboriginal and Torres Strait Islander peoples occur in the middle age groups, while most deaths for the non-Indigenous population occur in the older age groups. This partly reflects the younger age profile of the Indigenous population. In 2011–15, 64% of Aboriginal and Torres Strait Islander deaths occurred before the age of 65 years. The largest gaps were in the 45–64 year age groups (based on the sum of years of life lost due to premature mortality). In the 35–44 year age group the Indigenous mortality rate was 4 times the non-Indigenous rate. Within the Indigenous population males and females had different patterns of mortality by age. Indigenous males aged 15–34 years had mortality rates around twice that of Indigenous females. For males, deaths were highest in the 45–74 years age group, while for females deaths were highest in the 55–74 years age group. In the period 2011–15, Indigenous mortality rates ranged from 810 deaths per 100,000 in NSW to 1,520 per 100,000 in the NT. Between 2001 and 2015 there has been a significant decrease in mortality rates in remote areas (remote and very remote combined) for young children and middle age groups and an increase in the 75 years and over group.
Mortality rates are also available for other countries where Indigenous peoples share a similar history of relatively recent European colonisation, such as New Zealand and the United States. In New Zealand in 2014, the age-standardised all cause mortality rate for the Maori population was 1.6 times as high as other New Zealanders (940 per 100,000, compared with 578 per 100,000). In the United States, the mortality rate for American Indians/Alaska Natives was 50% higher than the rate for non-Hispanic whites during the period 1999–2009 (Espey et al, 2014). Caution must be used in comparing Australian data with data for other countries due to variations in data quality, methods applied for addressing data quality issues and definitions for identifying indigenous peoples.
Figures
Figure 1.22-1
Age-standardised all-cause mortality rates, by Indigenous status, 1998 to 2015
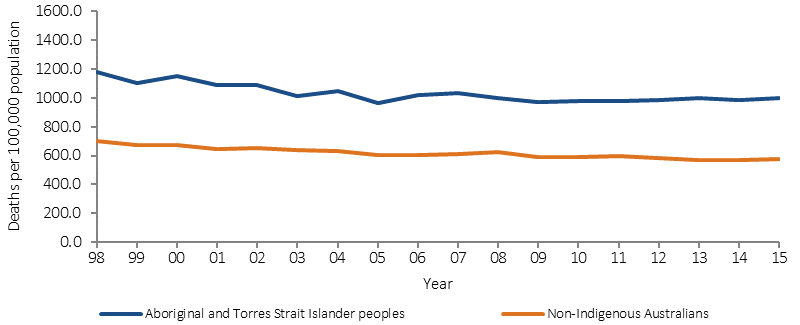
Source: ABS and AIHW analysis of National Mortality Database
Table 1.22-1
Age-standardised all-cause mortality rates, by Indigenous status, NSW, Qld, WA, SA and the NT, 2011–15
| Jurisdiction | Number of deaths | Deaths per 100,000 | Rate ratio | Rate difference | ||
|---|---|---|---|---|---|---|
| Indigenous | Non-Indigenous | Indigenous | Non-Indigenous | |||
| NSW | 3,730 | 251,226 | 810 | 585 | 1.4 | 225 |
| Qld | 3,602 | 136,486 | 960 | 581 | 1.7 | 380 |
| WA | 2,405 | 64,642 | 1,215 | 538 | 2.3 | 677 |
| SA | 805 | 64,638 | 831 | 603 | 1.4 | 228 |
| NT | 2,564 | 2,852 | 1,520 | 581 | 2.6 | 938 |
| Total | 13,106 | 519,844 | 992 | 580 | 1.7 | 412 |
Source: ABS and AIHW analysis of National Mortality Database
Figure 1.22-2
Selected age-specific mortality rates, Indigenous Australians, in remote areas, 2001 to 2015
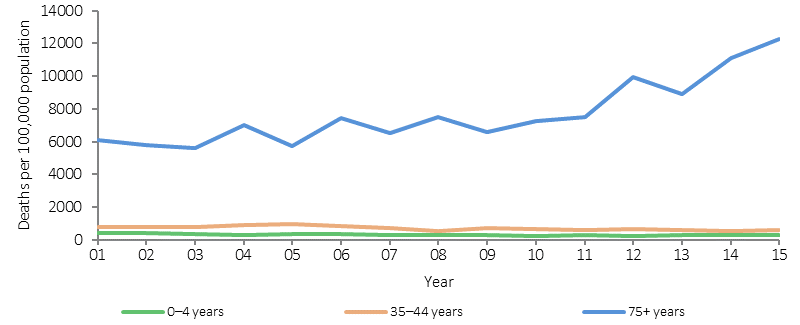
Source: ABS and AIHW analysis of National Mortality Database
Figure 1.22-3
The gap in potential years of life lost before age 75 years (PYLL) per 1,000 population between Indigenous and non-Indigenous Australians, by age and sex, 2011–15
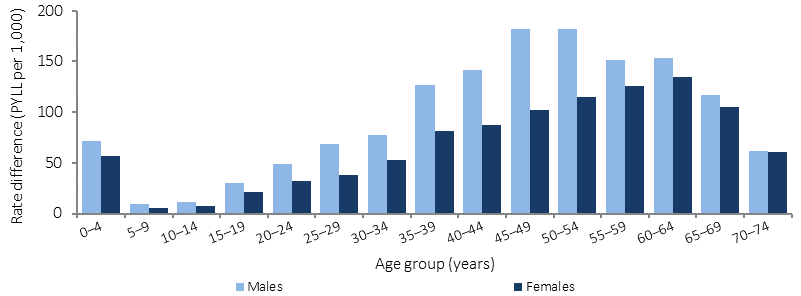
Note: PYLL is the number of additional years a person would have lived had they not died before age 75 years. The gap is the difference between the PYLL rate per 1,000 for Indigenous and non-Indigenous Australian populations.
Source: ABS and AIHW analysis of National Mortality Database
Figure 1.22-4
Age distribution of proportion of deaths, by sex and Indigenous status, NSW, Qld, WA, SA and the NT, 2011–15
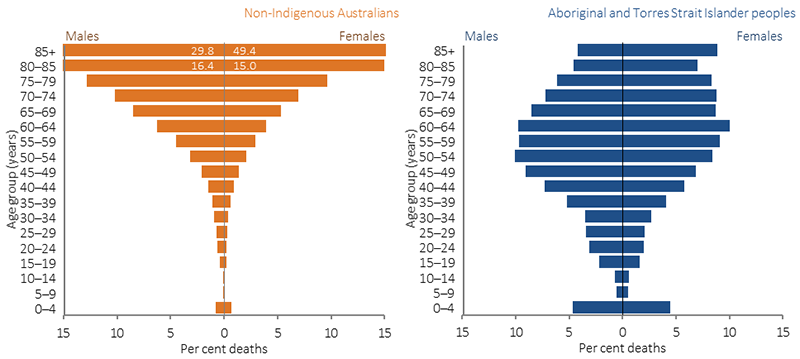
Source: ABS and AIHW analysis of National Mortality Database
Implications
The very high mortality rates for Aboriginal and Torres Strait Islander peoples, particularly in early childhood and the middle adult years, are an indication of the relatively poor overall health status of Aboriginal and Torres Strait Islander peoples and reflect the high rates of chronic disease and injury. There has been significant improvement in mortality rates for Aboriginal and Torres Strait Islander peoples in the past 15 years in the jurisdictions with adequate data for long-term analysis (NSW, Qld, WA, SA and the NT). The fact that improvements have occurred demonstrates that the severe health problems of Aboriginal and Torres Strait Islander peoples have been reduced to some extent and can be reduced further, and faster, with sustained and improved effort.
Closing the gap in life expectancy between Aboriginal and Torres Strait Islander peoples and other Australians within a generation has been adopted as a target by COAG. In the nine years since the target was set there have been some improvements for Aboriginal and Torres Strait Islander peoples (decline in mortality rates and life expectancy has increased). However, some health interventions which are targeted at closing the gap take time to have measurable impacts upon populations. These include interventions aimed at reductions in population level smoking rates, which take five years to impact on heart disease and up to 30 years for cancer, and improvements in educational attainment will take 20 to 30 years to impact on early deaths from chronic disease in the middle years.
A recent international population study collated data on Indigenous population, life expectancy at birth, infant mortality, birthweight, maternal mortality, nutritional status, educational attainment, and economic status. The study was across a broad sample of countries and provided recommendations to national governments including developing targeted policy responses to Indigenous health, improving access to health services, and having Indigenous data within national surveillance systems (Anderson, I et al, 2016). These measures could also help address the higher all causes mortality rate in Aboriginal and Torres Strait Islander peoples.
A description of policies and strategies relating to this measure are included in the Policies and Strategies section.