3.14 Access to services compared with need
Page content
Why is it important?
Data presented in this measure examine the level of access to health care for Aboriginal and Torres Strait Islander peoples compared with their need for health care. Indigenous Australians currently experience significantly poorer health status than non-Indigenous Australians. Their life expectancy at birth is 10.6 years less for males and 9.5 years less for females, and they are twice as likely to rate their health as ‘fair’ or ‘poor’ than non-Indigenous Australians.
While the causes of illness and injury for any community operate within broad environmental, social and personal factors, the health system can: assist with prevention through population health programmes (see measure 3.03); provide an immediate response to acute illness and injury (see measure 1.02); and protect good health through screening, early intervention and treatment (see measures 3.04 and 3.05) (Dwyer et al, 2004). Evidence from Australia, the United States and New Zealand indicate that health care can contribute to closing the gap in life expectancy between Indigenous and non-Indigenous populations (Griew, 2008). Inequalities in health care access and use may act to further exacerbate inequalities in health status (OECD, 2009). Access to health care when needed is therefore essential to closing the gap in life expectancy.
Findings
Self-reported use of services
The 2012–13 Health Survey provides the most recent and comprehensive picture of the whole health system. In 2012–13, 44% of Indigenous Australians accessed health care in the previous two weeks (or 12 months for hospital). In these two weeks, 22% of Indigenous Australians had consulted a doctor or specialist, 19% had consulted other health professionals, 5% had visited casualty/outpatient services and 5% had seen a dentist. In the previous 12 months, 18% had been admitted to hospital. Around 83% of Indigenous Australians had consulted a GP in the previous 12 months.
Indigenous Australians with a disability, multiple long-term health conditions and/or high/very high psychological distress were more likely to have visited a doctor/hospital than those without these conditions.
Services claimed through Medicare
In 2015–16, Indigenous Australians made nearly 8.7 million Medicare claims, of which 4.2 million were for GP services (note: not all care delivered through Indigenous primary health care (PHC) services can be claimed through Medicare). Between 2003–04 and 2015–16, the rate of GP Medicare items claimed by Indigenous Australians increased by 39% and is now higher than the non-Indigenous rate. The rate of claims for health assessment items have also increased since 2009–10, as have claims for team care arrangement (TCA) and GP management plan (GPMP) services. In 2015–16, rates for these chronic disease management items were higher for Indigenous Australians (1.5 to 1.6 times) than for non-Indigenous Australians.
In 2015–16, the two most common Medicare items claimed by Indigenous Australians were for standard GP consultations (2.4 million) and pathology (2.9 million). Out-of-pocket costs for services claimed through Medicare were lower for Indigenous Australians (8% of fees claimed) than non-Indigenous Australians (23% of fees claimed). For Indigenous Australians, out-of-pocket costs were minimal for Aboriginal Health Worker (AHW) items, Indigenous health checks, TCAs and GPMPs and higher for specialists (22%),diagnostics (9%), allied health (9%) and imaging (6%).
Indigenous Australians were more likely than non-Indigenous Australians to have long or complex GP consultations, TCAs and GPMPs. Service claims for specialist and psychologist items were lower for Indigenous Australians.
There was a clear gradient, reducing by remoteness, in rates of Medicare service claims for GP, allied health and specialist services for both Indigenous and non-Indigenous Australians. Against this gradient, rates of claims for nurse/AHW services increased by remoteness for Indigenous Australians. This also reflects types of services available in remote areas.
Medicare claim rates for private specialist care among Indigenous Australians were highest in major cities (582 per 1,000) and lowest in very remote areas (140 per 1,000). For GP services, Indigenous Australians claimed at a higher rate across all remoteness areas compared with non-Indigenous Australians (with the greatest difference in major cities and the smallest in very remote areas).
Indigenous women had higher rates of total services claimed through Medicare than Indigenous men (1.6 times).
Indigenous primary health care services
There has been an overall increase in the number of Commonwealth-funded Indigenous PHC organisations from 108 in 1999–2000 to 203 in 2014–15. Over that period, episodes of health care for clients of these organisations have almost tripled (from 1.2 million to 3.5 million) and equivalent full-time staff (both paid by the service and visiting) tripled. Organisations were asked to select the top 5 service gaps faced by their patients. Access to health services (including transport) was reported as a service gap by 28% of organisations providing PHC services, 29% providing social and emotional wellbeing services and 37% providing substance-use services.
Hospital care
During the two years to June 2015, there were an estimated 499,000 hospital separations for Indigenous Australians (excluding dialysis). After adjusting for age, Indigenous Australians were hospitalised at 1.3 times the rate of non-Indigenous Australians. Hospital separation rates for Indigenous Australians were highest in remote areas, lower in very remote areas and lowest in major cities (see measure 1.02).
Elective surgery
In the two years to June 2015, the overall rate of elective surgery for Indigenous Australians (53 per 1,000 persons) was markedly lower than for non-Indigenous Australians (85 per 1,000 persons). In 2015–16, there were 24,800 hospitalisations from public hospital elective surgery waiting lists (excluding the ACT) for patients identified as Aboriginal and/or Torres Strait Islander (representing 3.5%). The median waiting time for Indigenous Australians (43 days) was higher than for other Australians (37 days) as was the proportion of Indigenous Australians who waited more than a year for elective surgery (2.3% compared with 2.0% for other Australians) (AIHW, 2016x).
Emergency care
In 2015–16, around 6% of emergency department presentations (462,000) were reported for Indigenous Australians (excludes the ACT). The median waiting time for Indigenous Australians (18 minutes) was similar to that for other Australians (19 minutes). The proportion of Indigenous Australian presentations seen on time (75%) was also similar to that for other Australians (74%). Across triage categories, 100% of Indigenous Australians were seen on time for triage category 1 (resuscitation), 77% for category 2 (emergency), 68% for urgent and 75% for semi-urgent. For non-urgent patients, 93% were seen on time (within 2 hours) (AIHW, 2016e).
The Royal Flying Doctor Service (RFDS) provides emergency and other health care for those living in remote and very remote areas. Between July 2013 and December 2015, the RFDS conducted 17,606 aeromedical retrievals for Indigenous Australians (one-third of all retrievals) (Bishop et al, 2016).
Palliative care
Between July 2013 and June 2015, Indigenous Australians were hospitalised for palliative care at nearly twice the rate of non-Indigenous Australians (2.7 per 1,000 and 1.5 per 1,000 respectively). Indigenous patients accounted for 2% of all hospitalisations for palliative care. Around 59% of the 203 Commonwealth-funded Indigenous PHC organisations provided palliative care in 2014–15 (AIHW, 2016o).
Self-reported barriers
In 2012–13, 30% of Indigenous Australians reported that they needed to, but did not see a health care provider in the previous 12 months. This varied by type of service with 21% not going to a: dentist, 14% a doctor, 9% a counsellor, 9% other health professional and 6% to hospital when needed. Indigenous Australians living in non-remote areas (32%) were more likely to report not seeking care when needed than those living in remote areas (22%).
Reasons for not seeking health care when needed varied by type of service. Cost was the main reason for not seeking care for some services, for others waiting time was more of a barrier. Reasons for not going to a doctor included: being too busy (30%); waiting too long/service not available at time required (22%); transport/distance (14%); dislikes service/professional or is embarrassed/afraid (14%); cost of service (13%); felt service would be inadequate (9%); does not trust service provider (6%); service not available in area (5%); and discrimination/not culturally appropriate/language problem (3%).
Cost was a major barrier to accessing dentists (43% overall and 32% in relation to children). For the total population, a higher proportion of adults with insurance made a dental visit in the previous 12 months (71%) than adults without insurance (48%) (Brennan et al. 2012) (see measure 1.11).
Private health insurance
In 2012–13, in non-remote areas, 20% of Indigenous Australians were covered by private health insurance (up from 15% in 2004–05). The most common reason reported by Indigenous Australians for not having private health insurance was that they could not afford it (72%); up from 65% in 2004–05. In the two years to June 2015, 7% of procedures recorded for Indigenous Australians occurred in private hospitals compared with 42% for non-Indigenous Australians.
Service/provider availability
In 2015, full-time equivalent (FTE) rates for medical practitioners working as clinicians declined by remoteness (from 442 FTE per 100,000 population in major cities to 263 in remote/very remote areas). This reflects the pattern for specialists; for GPs, rates were highest in remote/very remote areas (135 FTE per 100,000 population) declining to 112 in major cities (AIHW, 2016g). For nurses, FTE per 100,000 population ranged from 1,219 in remote areas to 1,083 in outer regional areas (AIHW, 2016d) (see measure 3.22). AIHW (2016p) analysis of the distribution of the clinical health workforce in relation to the Indigenous Australian population found that a higher proportion of Indigenous Australians live in areas with lower health workforce access scores than non-Indigenous Australians. It was estimated that approximately 46,200 Indigenous Australians live in areas of low relative supply of GPs (6.9% of the Indigenous population compared with 0.5% of the non-Indigenous population).
Patient experience
In the 2014–15 Social Survey, 35% of Indigenous Australians reported they had been treated unfairly in the previous 12 months because they are Aboriginal or Torres Strait Islander. Around 14% of Indigenous Australians reported that they avoided situations due to past unfair treatment. Of those, 13% had avoided seeking care from doctors, nurses or other staff at hospitals or doctor’s surgeries because of previous unfair treatment.
In 2014–15, Indigenous Australians in non-remote areas reported their GP or specialist in the previous 12 months always or often: showed them respect (85%), listened carefully to them (80%), and spent enough time with them (79%).
Figures
Figure 3.14-1
Comparing mortality rate ratios (2011-15) with accessing MBS GP services rate ratio (2015–16) by age group(a)
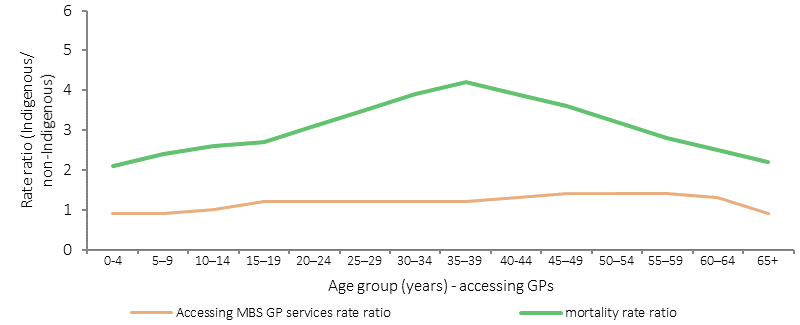
(a) mortality rate ratio includes people aged 0–74 years, NSW, Qld, WA, SA and NT.
Source: AIHW analysis of National Mortality Database and Medical Benefits Division, Department of Health
Figure 3.14-2
Age-standardised rates of GP MBS services claimed through Medicare, by Indigenous status, 2003–04 to 2015–16
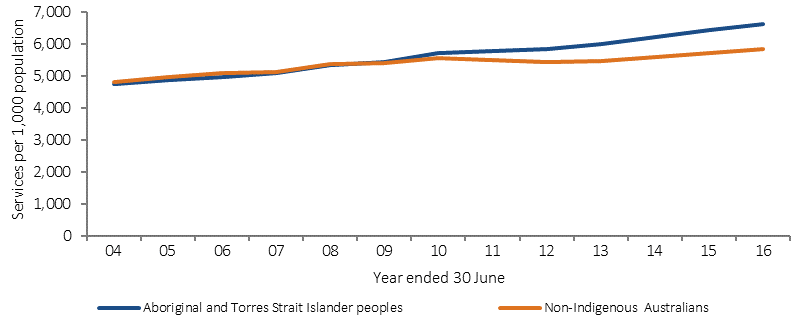
Source: Medical Benefits Division, Department of Health
Figure 3.14-3
Age-standardised rate of GP MBS services claimed through Medicare, by Indigenous status and remoteness area, 2015–16
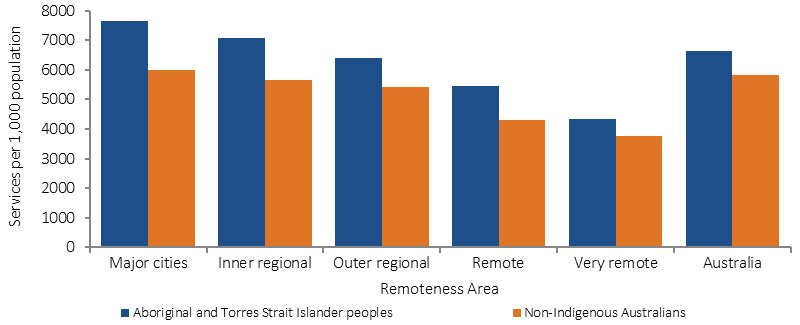
Source: Medical Benefits Division, Department of Health
Figure 3.14-4
Age-standardised rate of specialist MBS services claimed through Medicare, by Indigenous status and remoteness area, 2015–16
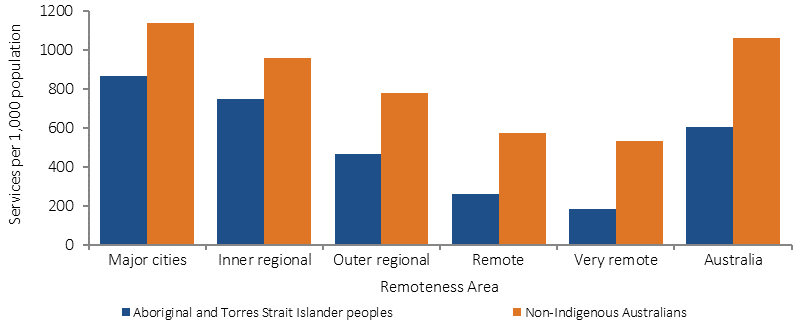
Source: Medical Benefits Division, Department of Health
Figure 3.14-5
Cumulative per cent changes to Indigenous primary health care organisations, 1999–2000 to 2014–15
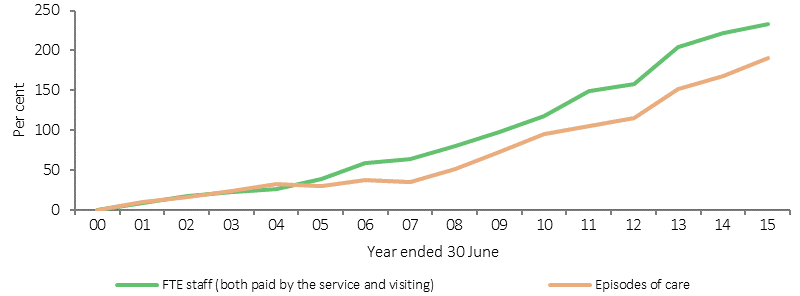
Source: SAR, DSR and OSR data collections
Figure 3.14-6
Age-standardised hospitalisation rates (excluding dialysis) by Indigenous status and remoteness, July 2013–June 2015
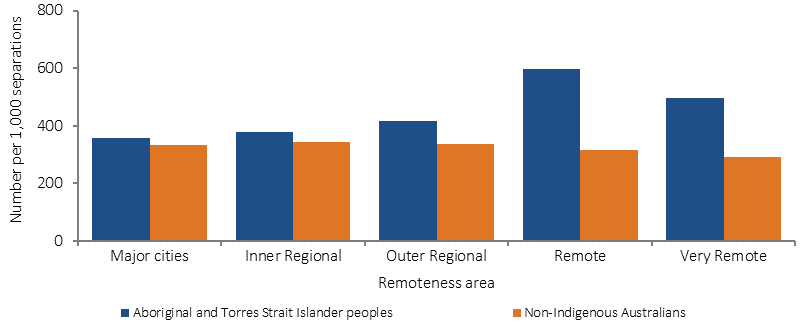
Source: AIHW analysis of National Hospital Morbidity Database
Table 3.14-1
Selected health services by reasons for not going to health care provider when needed, Indigenous Australians aged 2 years and over,
2012–13
| Doctor | Other health professional | Hospital | |||||||
|---|---|---|---|---|---|---|---|---|---|
| Non-remote | Remote | Total | Non-remote | Remote | Total | Non-remote | Remote | Total | |
| Per cent | |||||||||
| Needed to go to health provided in last 12 months but didn't | 15 | 9 | 14 | 10 | 4 | 9 | 6 | 5 | 6 |
| Reasons for not going to health care provider | |||||||||
| Cost of service | 15 | 4 | 13 | 39 | 5 | 35 | 8 | 6† | 8 |
| Waiting time too long or service not available at time required | 23 | 19 | 22 | 16 | † 19 | 17 | 25 | 22 | 25 |
| Transport/distance | 14 | 17 | 14 | 12 | 19† | 13 | 16 | 19 | 17 |
| Service not available in area | 4† | 7† | 5 | † 6 | 9† | 6† | 2# | 8† | 3† |
| Discrimination / not culturally appropriate / language problems | 3† | 2# | 3† | 3 † | 2# | 2† | 4† | 3# | 4† |
| Dislikes services/professional, embarrassed, afraid | 15 | 10 | 14 | 13 | 8† | 13 | 16 | 8† | 14 |
| Felt would be inadequate | 9 | 6 † | 9 | 5 | 4† | 5 | 10 | 8† | 9 |
| Does not trust service/ provider | 6 | 4# | 6 | 3† | 4# | 3 | 8 | 7† | 8 |
| Too busy (work, personal or family responsibilities) | 31 | 25 | 30 | 32 | 36 | 33 | 24 | 18 | 23 |
| Decided not to seek care | 34 | 34 | 34 | 19 | 24 | 20 | 37 | 31 | 36 |
| Dentist | Counsellors | Total health services | |||||||
|---|---|---|---|---|---|---|---|---|---|
| Non-remote | Remote | Total | Non-remote | Remote | Total | Non-remote | Remote | Total | |
| Percent | |||||||||
| Needed to go to health provided in last 12 months but didn't | 22 | 15 | 21 | 10 | 4 | 9 | 32 | 22 | 30 |
| Reasons for not going to health care provider | |||||||||
| Cost of service | 47 | 25 | 43 | 16 | 15† | 16 | 39 | 19 | 36 |
| Waiting time too long or service not available at time required | 20 | 24 | 20 | 11 | 26† | 12 | 27 | 27 | 27 |
| Transport/distance | 9 | 22 | 11 | 11 | 7† | 10 | 15 | 22 | 16 |
| Service not available in area | 5 | 31 | 9 | 5† | 14† | 6 | 6 | 25 | 9 |
| Discrimination / not culturally appropriate / language problems | 2† | 1# | 2† | 3† | 8# | 4† | 4 | 3'† | 7 |
| Dislikes services/professional, embarrassed, afraid | 19 | 16 | 19 | 28 | 18† | 27 | 23 | 17 | 22 |
| Felt would be inadequate | 1† | 1† | 1† | 19 | 12† | 18 | 10 | 6 | 9 |
| Does not trust service/ provider | 4 | 4† | 4 | 12† | 14† | 12 | 9 | 7 | 9 |
| Too busy (work, personal or family responsibilities) | 21 | 19 | 21 | 35 | 29† | 34 | 34 | 28 | 33 |
| Decided not to seek care | 11 | 10 | 11 | 31 | 40 | 32 | 29 | 26 | 29 |
† Estimate has a relative standard error between 25% and 50% and should be used with caution.
# Estimate has a relative standard error greater than 50% and is considered unreliable for general use
Source: ABS & AIHW analysis of 2012–13 AATSIHS
Implications
Access rates vary by type of care. GP care now shows similar rates for Indigenous and non-Indigenous Australians while for hospital care, rates for Indigenous Australians are higher. Indigenous Australians currently experience significantly poorer health and therefore we should expect to see rates of access to health services 2–3 times the non-Indigenous rate. The data also showed that people who did not access their PHC service at all in the previous 12 months were more likely to be hospitalised. Reduced rates of hospitalisation were seen for those with four or more clinic visits per year (Zhao et al, 2013b).
Analysis of available data uncovers an increase in health assessments, GP management plans, team care arrangements and allied health items claimed through Medicare since the implementation of enhanced Indigenous chronic disease initiatives in 2009. There have also been increases in episodes of care provided through Indigenous PHC services. The data also shows that Indigenous Australians have lower levels of private health insurance, are more likely to use public hospital services and have lower rates of elective and preventative surgery.
Barriers to accessing care when needed vary between remote and non-remote areas and service types, suggesting that strategies need to be context-specific and adapted for local circumstances. To be accessible, health care services need to be available, affordable, appropriate and acceptable (Ware, 2013).
Supporting this, there is a need to address recruitment and retention of staff in rural and remote areas (see measure 3.22), ensure the cultural competency of services (see measure 3.08), and consider service delivery options to overcome distance, cost and complicated referral processes. Having Aboriginal and Torres Strait Islander peoples employed within health care services has been identified as an enabler to developing relationships with patients and promoting access (Askew et al, 2014) (see measure 3.12).
Government initiatives to better support efforts to achieve health equality between Indigenous and non‑Indigenous Australians are detailed in the Policies and Strategies section. These include the Australian Government Indigenous Australians’ Health Programme, National Aboriginal and Torres Strait Islander Health Plan 2013–2023 and associated Implementation Plan and state and territory initiatives.
The Australian Government provides subsidised GP services and cheaper medicines through the MBS and PBS. The Practice Incentives Program—Indigenous Health Incentive supports Indigenous health services and general practices to provide better health care for their Indigenous patients.
As announced in the 2014–15 Budget, from 1 July 2015, Medicare Locals have been replaced by Primary Health Networks (PHNs). PHNs are provided flexible funding to enable them to respond to identified national priorities as determined by the Commonwealth, one of which is Aboriginal and Torres Strait Islander health. PHNs are informed by regional needs assessments to prioritise the activities to be funded and will work closely with local Indigenous and mainstream PHC organisations to support the delivery of culturally appropriate health services (see also measure 3.08). From 1 July 2016, PHNs have also had responsibility for further investment of $241.5 million to commission additional drug and alcohol treatment services; with $78.6 million specifically for Indigenous Australians (see measure 3.11).
The Rural Health Outreach Fund (RHOF) consolidates rural health outreach programmes (including the Medical Specialist Outreach Assistance Program) to provide a large flexible funding pool for initiatives aimed at improving access to medical specialists, GPs, allied health and other health providers in regional, rural and remote locations. Up to $121.3 million will be provided under the RHOF from 2013–14 to 2016–17. In 2015–16, more than 247,000 Australians accessed services through this program.
The Australian Government will provide up to $124.51 million under the Medical Outreach Indigenous Chronic Disease Program from 2013–14 to 2016–17 to deliver a wide range of medical specialist, general practice and allied health outreach services to Indigenous Australians, with a focus on regional, rural and remote Australians who are living with a chronic disease. In 2015–16, 209,360 patients accessed a service in more than 390 locations nationally (Department of Health unpublished).
Under the former Health and Hospitals Fund, a number of health service infrastructure projects were funded in states and territories. These included: the construction of 11 remote health centres in the NT; provision of new and improved PHC facilities for AMSs across Australia; construction of a dedicated network of hospital and community based medical education facilities at the Royal Darwin Hospital and a training facility at Alice Springs Hospital; a replacement paediatric unit at the Broome Hospital WA; and construction of a PHC centre with training facilities in Toowoomba Qld.