Life course
Page content
Introduction
As outlined in the National Aboriginal and Torres Strait Islander Health Plan 2012–2013, a life course approach to health acknowledges that there are critical periods of growth and development in-utero, in early infancy, and during childhood and adolescence that impact on social and cognitive skills, habits, coping strategies and physical health (Dept. of Health, 2013). These then interact with biological factors, social experiences and risk behaviours to either attenuate or exacerbate long-term risks to health (Cable, 2014).
There is a substantial body of evidence that the experience of the child in-utero, at the time of birth and in infancy and childhood has the potential to impact on health throughout life (Eades, S, 2004; Barker, 1990; Power et al, 2013).
Advances in neuroscience, molecular biology, genomics and transgenerational epidemiology provide further evidence that exposure to early childhood adversity impacts educational achievement, social and emotional wellbeing and measures of health, such as increased risk of obesity and high blood pressure (Crowell et al, 2016). Even in the absence of health risk behaviours in adulthood, the physiological effects of ‘toxic stress’ during childhood manifest later in life as cardiovascular disease, cancer, poor dental health and depression (Shonkoff et al, 2011).
Engaging with Aboriginal and Torres Strait Islander peoples in priority setting, policy development and programme implementation in a respectful and culturally competent way has been identified as a key success factor for programmes that support healthy lives (Lohoar et al, 2014; Griew et al, 2007).
The measure of community functioning within the HPF provides a range of strengths-based concepts that are critical to underpinning priorities for achieving outcomes consistent with the values of Aboriginal and Torres Strait Islander families and communities (see measure 1.13). Maternal health and parenting Longitudinal research continues to demonstrate the importance of evidence-based investment in prenatal and early childhood periods in order to prevent and reduce poor educational and health outcomes in later life (Ip, 2016; Eckenrode et al, 2010). Antenatal care and sustained home visiting provide opportunities to support healthy behaviours throughout pregnancy and into the early years of childhood. These types of programmes have been associated with positive outcomes in birthweight, maternal nutrition and breastfeeding (Emerson et al, 2015). Access to antenatal care is very high for Indigenous women (99%) but often occurs later in the pregnancy and less frequently than for non-Indigenous women (see measure 3.01). Indigenous women who receive care in the first trimester compared with those who receive no antenatal care are 4 times less likely to have a pre-term or low birthweight baby (see Figure 4).
Maternal health and parenting
Longitudinal research continues to demonstrate the importance of evidence-based investment in prenatal and early childhood periods in order to prevent and reduce poor educational and health outcomes in later life (Ip, 2016; Eckenrode et al, 2010).
Antenatal care and sustained home visiting provide opportunities to support healthy behaviours throughout pregnancy and into the early years of childhood. These types of programmes have been associated with positive outcomes in birthweight, maternal nutrition and breastfeeding (Emerson et al, 2015).
Access to antenatal care is very high for Indigenous women (99%) but often occurs later in the pregnancy and less frequently than for non-Indigenous women (see measure 3.01).
Indigenous women who receive care in the first trimester compared with those who receive no antenatal care are 4 times less likely to have a pre-term or low birthweight baby (see Figure 4).
Figure 4 Relationship for Indigenous mothers between duration of pregnancy at first antenatal care session and low birthweight babies, 2014
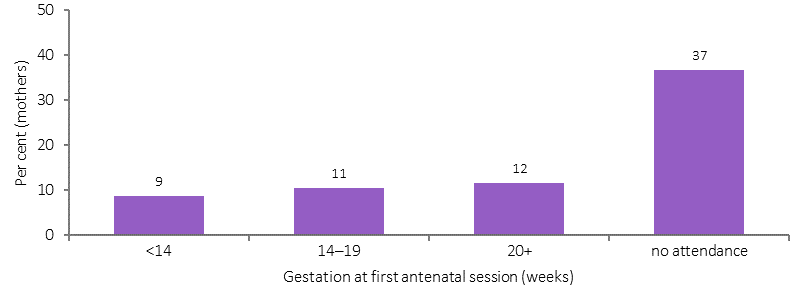
Source: AIHW/NPESU analysis of National Perinatal Data Collection
Smoking increases the risk of adverse events in pregnancy (such as miscarriage, ectopic pregnancy, pre-term labour and antepartum haemorrhage), and is also associated with poor perinatal outcomes (such as low birthweight), and respiratory illnesses (such as bronchitis or pneumonia) during the child's first year of life (see measure 2.21). Smoking is also associated with a higher rate of perinatal deaths (see measure 1.21). Research in WA has found the effects of smoking and other stressors adversely affects several generations (AIHW, 2013c). In 2014, 54% of Aboriginal and Torres Strait Islander mothers did not smoke during pregnancy. However, Indigenous mothers were 3.6 times as likely to smoke during pregnancy as non‑Indigenous mothers (age-standardised).
In addition to addressing health risk behaviours during pregnancy, the social and emotional wellbeing of mothers is also important in reducing early exposure to childhood adversity (Shonkoff et al, 2011). This includes ante/postnatal depression and stress related to income deprivation, housing instability, low levels of educational attainment (particularly for teenage mothers), racism, discrimination and exposure to family violence. For Indigenous females, intimate partner violence was a health risk factor responsible for 6.4% of the burden of disease and injury, having its impact not only through homicide and violence but also anxiety and depression, suicide and other diseases (Ayre et al, 2016). In 2015–16, Indigenous Australians accessed specialist homelessness services at 9 times the non-Indigenous rate of access (AIHW, 2017b). The majority of Indigenous clients were women (62%) andalmost a quarter (23%) of all Indigenous clients were children aged 0–9 years.
A study of deaths of mothers in WA between 1983 and 2010 found a higher proportion of children born to Aboriginal mothers had experienced a maternal loss (5.4%) when compared with other children (1%) (Fairthorne et al, 2016).
Childhood (0–14 years)
Brain development in the early years is greatly influenced by social and environmental factors, and this is a critical phase for establishing healthy cognitive and emotional processes. In the first three years of life, a child’s brain grows from 25% to 90% of its adult size (Emerson et al, 2015).
Most Indigenous babies are born a healthy weight (89% in 2014). However, in 2014, low birthweight was more common for babies born to Aboriginal and Torres Strait Islander mothers (10.5%) than non-Indigenous mothers (4.7%) (excluding multiple births). Low birthweight infants are at a greater risk of dying during their first year of life (see measure 1.21), and are prone to ill-health in childhood and the development of chronic disease as adults (OECD, 2011; Scott, 2014; Arnold, L et al, 2016; Luyckx et al, 2013; Zhang, Z et al, 2014; Hoy, W & Nicol, 2010; White, A et al, 2010).
In 2014, low birthweight rates for babies born to Indigenous mothers were highest in very remote areas, followed by remote areas, outer regional areas, major cities and then inner regional areas. However, for non-Indigenous mothers the rates were lowest in remote areas (4.2%) and ranged from 4.5% to 4.7% in other areas (see Figure 5).
Figure 5
Low birthweight per 100 live born singleton births, by Indigenous status of the mother and remoteness, 2014
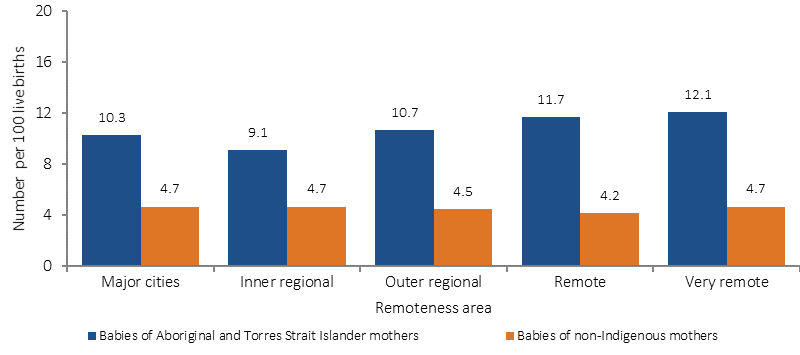
Source: AIHW analysis of the National Perinatal Data Collection
The Millennium Cohort study found a clear social gradient in the types of parenting practices that encourage social and language development (Marmot, 2015). Weisleder et al. (2013), in a study of toddlers, found that the number of child-directed words heard over the course of a day ranged from 670 to 12,000 words. Infants who experienced more child-directed speech became more efficient in processing familiar words in real time and had larger vocabularies by the age of 24 months.
Analysis of the Longitudinal Study of Indigenous Children (LSIC) shows that 77% of Aboriginal and Torres Strait Islander children were at low risk of emotional/behavioural difficulties (Walter et al, 2016). For children in the LSIC, 76% of caregivers often/always showed affection; 48% had a warm relationship with their teacher; 54% had not been bullied; 65% had at least one friend; 9% attend cultural events often, and these factors were significantly associated with resilience.
Another study using data from the LSIC (Dept. of FaHCSIA, 2013) found that the main risk factors for social and emotional difficulties included: having a close family member having problems with the police/jail; being cared for by someone other than their regular carer for at least a week; and children being scared by other people's behaviour (see measures 2.10, 2.11 and 2.12). The 2001–02 WA Aboriginal Child Health Survey found that children were twice as likely to be at risk of emotional and behavioural difficulties if they lived in families with poor communication and decision making, poor emotional support and limited time spent together (Zubrick et al, 2005). Further evaluation is required to assess the effectiveness of Indigenous parenting programmes and how well they attract and retain participants and the cultural competence of the services (Emerson et al, 2015).
Dockery (2011) found an association for Indigenous Australians between strong cultural attachment and positive outcomes on a range of socio-economic indicators including health status, education and employment. Providing children with a positive sense of themselves facilitates a strong foundation in resilience (Eades, S, 2004). Promoting a positive home learning environment is an important contributor to good early learning outcomes, along with regularly participating in high quality early childhood education (Leske et al, 2015).
In 2014–15, 96% of Aboriginal and Torres Strait Islander children aged 0–14 years were involved in informal learning activities with a carer in the last week, 44% of 4–14 year olds had spent time with an Indigenous elder, and 54% of children aged 2–14 years were taught about Indigenous culture at school (see measure 1.13).
After controlling for a range of factors, Arcos Holzinger and Biddle (2015) found at ages five to seven (two years after preschool enrolment) participation in preschool had some positive impact on vocabulary for Indigenous students. Over the longer term (three to five years after preschool enrolment) positive impacts on developmental outcomes, reading and maths achievement were seen for Indigenous students. In 2015, 87% of Indigenous children participated in early childhood education in the year before formal schooling (Dept. of Prime Minister & Cabinet, 2017). Biddle (2011) found decreased preschool attendance of children whose carers experienced feelings of discrimination, demonstrating the importance of cultural competency in services (see measure 3.08).
The Australian Early Development Census (AEDC) is a measure of children's development in the first year of school with teacher assessments across five domains (see Figure 6). As with all assessments the AEDC has its limitations. In 2015, most Indigenous children (58%) were not developmentally vulnerable on any domain (Dept. of Education & Training, 2016). In 2015, 62% of Indigenous children were developmentally on track for physical health and wellbeing; 59% for social competency; 63% for emotional maturity; 63% for language and cognitive skills and 60% for communication and general knowledge.
However, Indigenous children were twice as likely as non‑Indigenous children to be developmentally vulnerable on at least one domain (42% compared with 21%). The gap between Indigenous and non-Indigenous children is starting to close for some AEDC measures. For example, the gap between Indigenous and non-Indigenous children on the language and cognitive skills (school-based) domain fell from 21 percentage points in 2009 to 15 percentage points in 2015.
Figure 6
Percentage of Australian children 'developmentally vulnerable' in the Australian Early Development Census, by Indigenous status, 2015
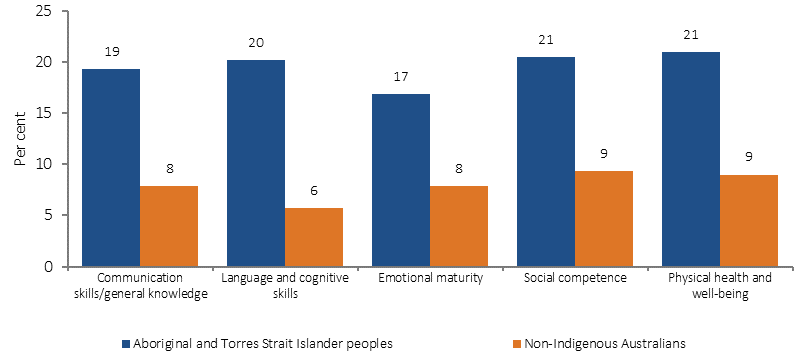
Source: Commonwealth of Australia (2016)
In 2016, the majority of Indigenous school students met the national minimum standard in reading and numeracy. In 2016, around 81% of Indigenous students met the Year 3 national minimum standard in reading, 71% in Year 5, 77% in Year 7, and 74% in Year 9. Around 85% of Indigenous students met the national minimum standard for writing in Year 3, 74% in Year 5, 64% in Year 7, and 53% in Year 9. However, the proportion of Aboriginal and Torres Strait Islander students achieving the reading, writing and numeracy benchmarks remain below the corresponding proportions of non‑Indigenous students (Figure 7 presents results for reading as an example). Guthridge et al. (2015) investigated the association between early life risk factors and NAPLAN results in a large cohort study of children in the NT. They found that, controlling for other factors, low birthweight is associated with poorer numeracy results for Indigenous children.
Figure 7
Proportion of Year 3, 5, 7 and 9 students at or above the national minimum standards for reading, by Indigenous status, 2016
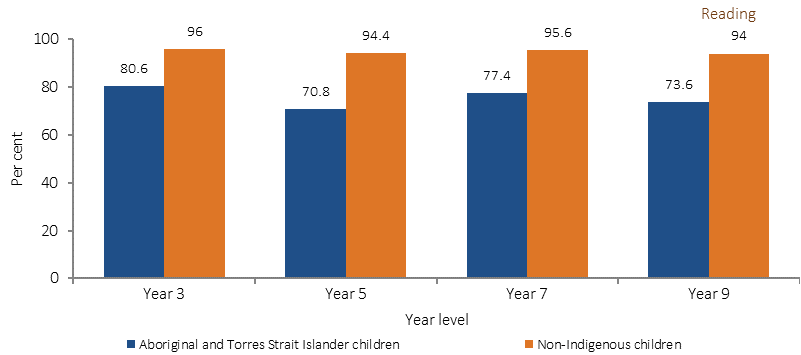
Source: ACARA 2016
NAPLAN test results decline with any absence from school and this accumulates over time (Hancock et al, 2013). In Semester 1 2016, national Indigenous attendance rates were 83.4%, compared with 93.1% for non-Indigenous students. There has been little change in the Indigenous school attendance rate from 2014 (83.5%). All of the changes at the state and territory level were less than one percentage point, apart from the NT (1.6 percentage point fall). Progress will need to accelerate from now on for the school attendance gap to be closed by 2018 (Dept. of Prime Minister & Cabinet, 2017).
Analysis undertaken by the Social Justice Commissioner shows that one of the most common reasons for substantiated child protection notifications for Indigenous children aged 0–17 years in 2014–15 was neglect (38%) (AHRC, 2015). Neglect is strongly associated with poor socio-economic status and refers to ‘the failure to provide for a child’s basic needs, including failure to provide adequate food, shelter, clothing, supervision, hygiene or medical attention’. Malnutrition or ‘failure to thrive’ continues to be a prominent reason for neglect, particularly in remote areas. The other most common reason is ‘emotional abuse’ (also 38% in 2014–15). Exposure to family violence is often categorised as ‘emotional abuse’ by child welfare agencies. A report by the Department for Child Protection and Family Support in WA found that over 50% of all referrals to child protection were related to family and domestic violence; and children were present at 70% of domestic violence incidents attended by police (Dept. for Child Protection & Family Support, 2013). A recent Inquiry in Victoria has found that family violence, in combination with parental alcohol and/or drug abuse, are the leading causes for Aboriginal children’s entry into out-of-home care. Of the Aboriginal children reviewed, 88% were impacted by family violence and 87% per cent were affected by a parent with alcohol or substance abuse issues (Commission for Children and Young People, 2016). Frequently, parents of children who come to the attention of child welfare have themselves been removed from their families as children. The Social Justice Commissioner’s analysis highlights the need for a healing and trauma informed approach to addressing the social determinants of health for Aboriginal and Torres Strait Islander peoples.
Children who live in a dwelling that is badly deteriorated have been found to have poorer physical health outcomes and social and emotional wellbeing compared with those growing up in a dwelling in excellent condition (Dockery et al, 2013). In 2014–15, around one-quarter (26%) of Indigenous households were living in dwellings with major structural problems (including problems such as sinking/moving foundations, sagging floors, wood rot/termite damage and roof defects). Comparisons between Indigenous and non-Indigenous children in the Longitudinal Study of Australian Children (LSAC) show improvements in housing can be expected to translate into gains for Indigenous children's health, social and learning outcomes (Dockery et al, 2013).
Lower levels of education and income, and sub-standard living conditions are also associated with oral disease. In 2014–15, around a third (34%) of Indigenous children aged 4–14 years had teeth or gum problems. In the two years to June 2015, Indigenous children aged 0–4 years were hospitalised for dental conditions at twice the rate of non-Indigenous children (6.9 per 1,000 compared with 3.6 per 1,000). This indicates poor access to, and a large unmet need for, dental care in this age group. Dental disease in childhood is readily treated but cost is a major barrier for Indigenous families (Durey et al, 2016). In 2014–15, 82% of Indigenous children aged under 15 years reported cleaning their teeth once or twice per day.
Immunisation is highly effective in reducing illness and death caused by vaccine-preventable diseases. As at December 2015, immunisation coverage was high for Indigenous children, and by 5 years of age, the immunisation coverage (95%) was slightly higher than for other Australian children (93%) (see measure 3.02).
Hearing loss, especially in childhood, can lead to linguistic, social and learning difficulties and behavioural problems in school. Ear disease (particularly middle ear infections) is significantly higher for Indigenous children aged 0–14 years (2.9 times the non-Indigenous rate in 2014–15 self-reported survey data). In the period from July 2013 to June 2015, Indigenous children aged 0–14 years were hospitalised for tympanoplasty procedures (a reconstructive surgical treatment for a perforated eardrum) at 4 times the rate of non-Indigenous children.
Most Indigenous children have excellent vision. However, in 2014–15, 10% of Indigenous children aged 0–14 years reported eye or sight problems, up from 7% in 2008 (ABS, 2016e). In 2015 the prevalence of active trachoma in children aged 5–9 years in 131 screened at-risk Indigenous communities in NSW, SA, WA and the NT combined was 4.6% (NTSRU, 2017). Vision loss and/or eye disease can lead to learning difficulties and poor education and employment outcomes.
In the two years to June 2015, the hospitalisation rate for respiratory diseases for Indigenous children aged 0–4 years was 1.6 times the rate for non‑Indigenous children. Since 2004–05 there has been a significant increase (24%) in hospitalisation rates for Indigenous children for respiratory diseases and an increase in the difference in rates with non‑Indigenous children (see measure 1.04).
The home is a key setting for exposure to second-hand smoke for pregnant women and young children. Exposure to parents' smoking in childhood is found to have pervasive vascular health effects into adulthood (Gall et al, 2014). In 2014–15, 57% of Aboriginal and Torres Strait Islander children aged 0–14 years were living in households with a daily smoker, however this dropped to 13% where anyone smoked at home indoors. In comparison, 21% of non-Indigenous children within the same age range lived in households with a daily smoker. Socio-economic factors are associated with whether Indigenous children aged 0–14 years live in a household where smoking occurs indoors (see Figure 8). Children in the lowest income households, households under financial stress (where it was not possible to raise $2,000 in an emergency) and households that ran out of money for basic living expenses in the last year were more likely to be exposed to smoke inside their home. Children living in households that were owned rather than rented, or in households that were not overcrowded were less likely to be exposed to smoke inside their home.
Figure 8
Relationship between living in a household where no smoking occurs indoors and socio-economic factors, Indigenous children aged 0-14 years, 2014–15
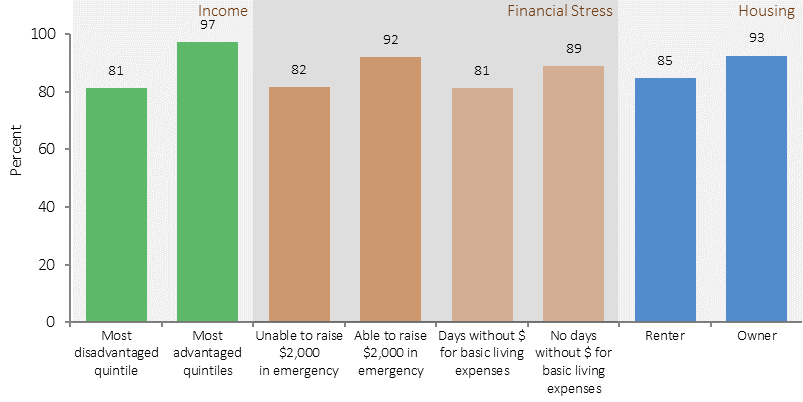
Source: ABS and AIHW analysis of 2014–15 NATSISS
The Aboriginal and Torres Strait Islander burden of disease study found that overall disease burden was not evenly distributed over the different stages of life (AIHW, 2016f). Infants and children aged 0–4 years represented 12% of the Indigenous population, and accounted for 9% of the total burden of disease for Indigenous Australians in 2011. Infant and congenital conditions accounted for a large portion of the burden in this age group, mostly due to pre-term and low birthweight complications, SIDS, and other disorders of infancy and birth.
Children aged 5–14 years represented 24% of the total Indigenous population, but accounted for only 6% of the total burden of disease. The leading causes of health loss for this age group were asthma, anxiety disorders, depressive disorders and conduct disorders.
In 2011–15, the mortality rate for Indigenous children aged 0–4 years was twice the non‑Indigenous rate (165 per 100,000 compared with 80 per 100,000). The leading cause of death for Indigenous infants was conditions originating in the perinatal period; while injury accounted for over half (54%) of the deaths in the 1–4 year old group. Injury was also the leading cause of death for Indigenous children aged 5–14 years (63%). The NT had the highest Indigenous child mortality rates and the largest gap compared with the mortality rates of non-Indigenous children (see Figure 9).
Figure 9
Child (0-4) mortality rates per 100,000, by Indigenous status, by jurisdiction, NSW, Qld, WA, SA and NT, 2011–15
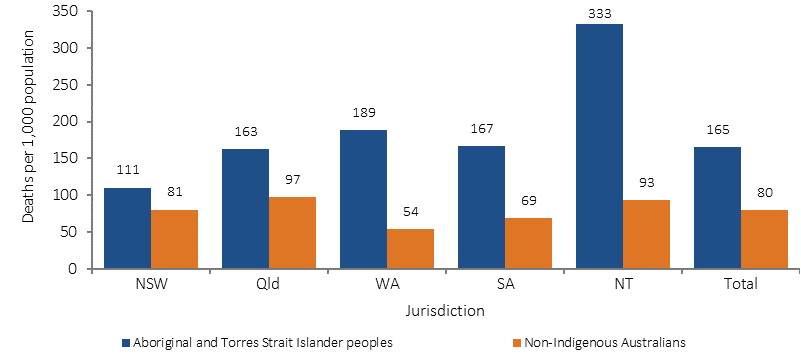
Source: ABS and AIHW analysis of National Mortality Database
Adolescents and youth (15–24 years)
The transition between adolescence and adulthood is a time when young people experience a range of physical, psychological, social and financial changes including changes in their support networks and relationships, educational goals, and responsibilities within their family and community (Mission Australia, 2016).
Studies have found that empowering families and communities to work with youth on preventative health and to develop a positive sense of themselves are important factors for a strong foundation for long and healthy lives (Eades, S, 2004; Williamson et al, 2010). Effective engagement with Aboriginal and Torres Strait Islander youth requires consideration of the impacts of racism, intergenerational trauma and the emergent effects of ‘toxic’ stress (as discussed previously) that can affect young peoples’ ability to cope.
Achievement of educational goals is a key factor for positive health, social and economic outcomes later in life. Although Aboriginal and Torres Strait Islander people comprise 3% of the population, the younger demographic of the Indigenous population means they comprise 6.7% of school enrolments in government schools (ABS, 2016d). The majority of these students (84%) attend government schools. Over time there have been improvements in the proportion of Indigenous students remaining in school to Year 10 and Year 12, although Indigenous retention rates remain lower than for other students (see measure 2.05). Between 2008 and 2014–15, the gap in the Year 12 or equivalent attainment rate for those aged 20–24 years narrowed by 14.7 percentage points and the COAG target to halve the gap by 2020 is currently on track (see measure 2.06). Nationally, the proportion of Indigenous 20–24 year olds who had attained Year 12 or equivalent increased from 45.4% in 2008 to 61.5% in 2014–15. In 2016, the attendance rate for Indigenous students was 83.4%, almost 10 percentage points lower than the comparable rate for non-Indigenous students (93.1%). While this is a sizeable gap, the data tells us that on a given school day the vast majority of Aboriginal and Torres Strait Islander students are attending school. Factors associated with poor school attendance include inadequate housing and health care, mental health issues, family violence and intergenerational unemployment (Mission Australia, 2016).
Young Indigenous women are more likely to plan university study and have higher post-school aspirations than young Indigenous men (Sikora & Biddle, 2015). The 2015 Youth Survey found that financial difficulties were perceived as a barrier to the achievement of study/work goals for both Indigenous and non-Indigenous youth (Mission Australia, 2016).
In 2015, Indigenous young people were more likely than non-Indigenous young people to report plans to go to TAFE or college and get an apprenticeship. Getting a job was also found to be more important to Indigenous than non-Indigenous young people; however, they were less likely to be in paid employment and more likely to be looking for work. The Youth Survey found that half of Indigenous youth were looking for work compared with one-third of non-Indigenous youth.
Remoteness influences the social and environmental context of this transition period, due to factors ranging from cultural identification and social networks through to educational and employment opportunities. In 2011, 21% of Indigenous Australians lived in remote areas. In 2014–15, around 5% of Indigenous youth in non-remote areas spoke an Australian Indigenous language, compared with 54% of youth in remote areas. Indigenous youth in remote areas were more likely to identify with a clan, tribal or language group (75%) compared to youth in non-remote areas (47%). Indigenous youth in remote areas were more likely to have been involved in funerals/sorry business (56%) compared with youth in non-remote areas (22%). Indigenous youth in remote areas were more likely to have daily face to face contact with family or friends from outside their household (73%) compared with youth in non-remote areas (47%), while young people in non-remote areas were more likely to use text messaging (88% compared with 63% in remote areas) or web-based chat (54% compared with 27% in remote areas). Similar proportions of Indigenous youth across remoteness areas felt able to get support in times of crisis (94% in non-remote and 90% in remote areas). Youth in non-remote areas were more likely to report being able to confide in family or friends outside their household (88% compared with 67% in remote areas). Indigenous youth in remote areas were more likely to have cared for a person with a disability, long-term health condition or old age in the last 4 weeks (35% compared with 20% in non-remote areas). Similar proportions of young people felt they have little or no say within their community on important issues (57% in non-remote areas and 60% in remote areas).
In 2014–15, a higher proportion of Indigenous Australians aged 15–24 years living in remote areas reported living in households that were not able to raise $2,000 in a week (65%) compared with non-remote areas (45%). In remote areas, the combined impact of living in areas of socio-economic disadvantage, low-quality housing, overcrowding and family violence are associated with educational disadvantage (Brackertz, 2016). Year 12 attainment among Aboriginal and Torres Strait Islander young people aged 20–24 years varied considerably by remoteness area in 2014–15, ranging from 69% in inner regional areas to 42% in remote and very remote areas. For Indigenous young people in remote areas there are fewer job opportunities (Mission Australia, 2016). In 2014–15, the proportion of Indigenous Australians aged 17–24 years fully engaged in education, training or employment ranged from 58% in major cities to 15% in very remote areas.
Aboriginal and Torres Strait Islander youth experience a number of challenges compared with non‑Indigenous youth, including higher rates of high/very high levels of psychological distress (see measure 1.18). The 2015 Youth Survey found that 18% of Aboriginal and Torres Strait Islander young people surveyed had high levels of concern about suicide (compared with 11% non-Indigenous), 18% were concerned about discrimination (compared with 10% non-Indigenous) and one in five reported bullying and emotional abuse as a concern (Mission Australia, 2016). The same survey also found that young Indigenous males were more likely to report very low levels of happiness (10%) than Indigenous females (5%) or non-Indigenous youth (1.2%).
A 2014 study of 41 Aboriginal communities in the NT, WA and SA found nearly 80% of petrol sniffers were male and over half were aged 15–24 years (d'Abbs & Shaw, 2016) .
The burden of disease study found that the disease burden varied by age (AIHW, 2016f). Indigenous Australians aged 15–24 years represented 20% of the Indigenous population yet accounted for 13% of the total burden of disease for the Indigenous population. Injuries and mental and substance use disorders were the main contributors to the burden for Indigenous Australians in this age group. For Indigenous males in this age group, suicide and self-inflicted injuries, alcohol use disorders and motor vehicle traffic accidents were the leading causes of the burden. For Indigenous females in this age group, anxiety disorders, suicide and self-inflicted injuries, and depressive disorders were the leading causes of the burden.
In the 15–24 year age group, suicide and transport accidents were the leading cause of Indigenous deaths during the period 2011–15; and 64% of all deaths in this age group were males. In 2011–15, for those aged 15–24 years the Indigenous suicide rate was 3.9 times the non‑Indigenous rate and transport accidents were 1.9 times the non-Indigenous rate (ABS, 2016f).
A supportive and stable home environment is a vital foundation for good health and participation in education and employment. In the 2015 Youth Survey 54% of Indigenous young people reported moving house in the last 3 years (compared with 34% of non-Indigenous young people); and 30% reported spending time away from home because they felt they could not go back (compared with 12% of non-Indigenous young people) (Mission Australia, 2016). Family violence is a leading cause of homelessness for Indigenous women and children.
The majority of Indigenous young people reported good relationships with their family. However, a higher proportion of Indigenous young people reported concerns around family conflict (25%) compared with non-Indigenous young people (18%). Additionally, more Indigenous young people reported feeling unsafe in their neighbourhood (19%) compared with non-Indigenous young people (9%). Young people who spend time in juvenile detention are more likely to become homeless, to be unemployed, and to experience mental health issues and family violence (Mission Australia, 2016). In 2014–15, Indigenous males aged 15–24 years were 2.5 times more likely than Indigenous females of the same age to have been arrested by police in the last 5 years (23% compared with 9%), and 5% of males in this age group reported they had been incarcerated. On an average day in 2014–15, 43% of those under youth justice supervision were Indigenous. Given Indigenous youth only make up about 6% of the population aged 10–17 years, they were significantly over-represented in youth justice supervision. Young people may be supervised either in their communities or in secure detention facilities: on an average day most Indigenous youth under supervision are under community-based supervision (81%) with the remainder in detention (19%). Rates of supervision peaked for both Indigenous and non-Indigenous young people in 2010–11, before declining in subsequent years (from 213 to 180 per 10,000 for Indigenous young people, and from 17 to 12 per 10,000 for non-Indigenous young people) (see Figure 10). As at 30 June 2016, 27% of the adult prison population were also Indigenous. Disproportionate representation of Indigenous youth in contact with the justice system impacts on a range of areas including physical health and the social and emotional wellbeing of families and communities.
Figure 10
Rates of young people aged 10–17 years under community-based supervision and detention, by Indigenous status,
2006–07 to 2014–15
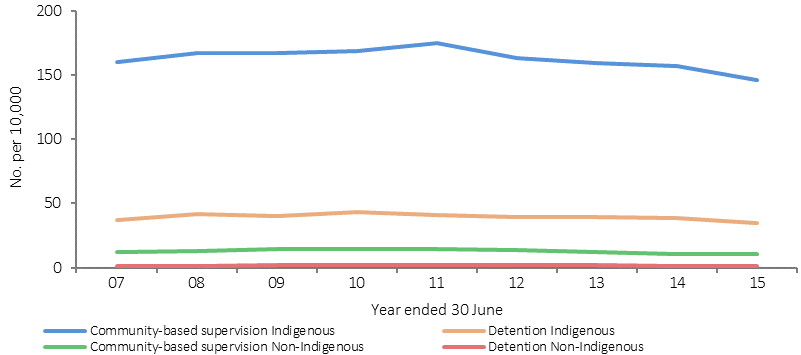
Note: WA and the NT did not supply JJ NMDS data for 2008–09 to 2014–15
Source: AIHW Juvenile Justice National Minimum Dataset, 2014–15
Young people do not use primary health care services as frequently as other age groups. Research suggests social media and digital technologies (Rice et al, 2016), peer education (MacPhail & McKay, 2016) and ‘yarning circles’ (Duley et al, 2016) may be effective forms of health promotion for engaging with this age group. Sexual and reproductive health are particularly important during this stage of the life course. While Indigenous females aged 15–19 years have a higher fertility rate than other Australians of the same age, the median age of Indigenous mothers is 25 years. Teenage pregnancy can adversely affect education and employment opportunities for the mother, which in turn affects the socio-economic environment of her children.
In the 2015 Youth Survey over half of Indigenous youth placed a high personal value on physical and mental health (Mission Australia, 2016). The majority of Indigenous youth reported feeling positive overall about their lives. In 2014–15, the majority (97%) of Indigenous youth had participated in sporting, social or community activities in the previous year. In 2015, the top three sources of support reported by Indigenous youth were friends, parents and relatives/family friends (Mission Australia, 2016).
Smoking rates for Indigenous Australians were lowest for those in the 15–17 year age group (17%) compared with those aged 25–34 and 35–44 years (both 50%). Between 2002 and 2014–15, the greatest decreases in smoking rates have been in the younger age groups—from 58% to 41% for 18–24 year olds and from 33% to 17% among 15–17 year olds.
Adults (25–54 years)
The burden of disease study found variation in disease burden across the life course (AIHW, 2016f). Indigenous adults aged 25–44 years represented 26% of the total Indigenous population in 2011 and contributed 30% to the total burden. For Indigenous males aged 25–44 years, alcohol use disorders were the leading contributor to the burden, followed by suicide and self-inflicted injuries and coronary heart disease. For Indigenous females in this age group, anxiety disorders and depressive disorders were the leading contributors to the burden, followed by other musculoskeletal conditions.
Mortality data for 2011–15 shows that for Indigenous Australians in the 25–34 year age group, external causes (including suicide and transport accidents) were the leading cause of death. Indigenous mortality rates due to ischaemic heart disease were 14 times those of non‑Indigenous Australians in the same age group (ABS, 2016).
In the 35–54 year age groups chronic disease was the leading cause of death. In 2011–15, premature mortality rates from chronic disease (before the age of 75 years) were higher for Indigenous Australians than for non‑Indigenous Australians (5 times for those aged 35–44 years and 3.7 times for those aged 45–54 years). In the 35–44 year age group in the NT, Indigenous mortality rates from chronic disease were 12 times the non‑Indigenous rate (513 compared with 43 per 100,000).
In 2012–13, after adjusting for differences in the age structure of the two populations, Indigenous adults were 1.2 times as likely to have high measured blood pressure as non‑Indigenous adults. For Indigenous Australians, rates started rising at younger ages and the largest gap was in the 35–44 year age group.
While hospitalisations for injury reflect hospital attendances for a condition rather than the extent of the problem in the community, injury was the second most common reason for Indigenous Australians being hospitalised (after dialysis). Indigenous hospitalisation rates for injury peaked in the 25–54 year age groups and have had a much greater impact on the young and middle-aged when compared with non‑Indigenous hospitalisations for injury (with higher rates of falls for elderly people).
In the 2014–15 Social Survey, 61% of Indigenous Australians aged 15–64 years were in the labour force (see measure 2.07). For non-Indigenous Australians of working age, 77% were in the labour force according to the 2014 Survey of Education and Work. The proportion of Indigenous Australians of working age who are not in the labour force has increased from 36% in 2008 to 39% in 2014–15. In 2014–15, 48% of the Indigenous working age population were employed. This was a decline from 2008 where the employment rate peaked at 54%, but an overall increase from 1994 (38%). The non-Indigenous employment rate also declined between 2008 and 2014 (from 75% to 73%) and the gap has not changed (21 percentage points in 2008 and 24 percentage points in 2014–15).
In 2014–15, 92% of unemployed Indigenous Australians reported having difficulties finding work. Main issues reported were no jobs in local area or line of work (41%), transport problems/distance (32%) (measure 2.13), not having a driver’s licence (31%) and insufficient education/training skills (30%). For those not looking for work, the main reasons given were childcare (22%), studying or returning to study (20%) and having a long-term health condition or disability (18%).
55 years and older
The role of leadership in supporting healthy families and communities is important and better measurement of this factor is needed. Leadership is a theme within the measure of community functioning (see measure 1.13) used to describe strong vision and direction from Elders (both male and female) in family and community and strong role models who make time to listen and advise.
In 2014–15, 88% of Indigenous Australians aged 55 years and over reported having at least one long-term health condition and 55% had 3 or more conditions. In 2014–15, older Indigenous Australians were less likely than younger people to report very good or excellent health: 54% in the 15–24 years age group compared with 23% in the 55 years and over age group (see Figure 11).
Figure 11
Self-assessed health status by Indigenous status and age group, persons aged 15 years and over, 2014–15
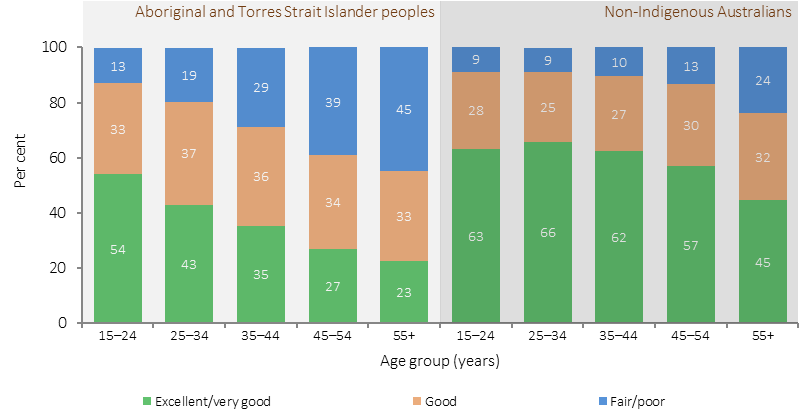
Source: ABS and AIHW analysis of 2014–15 NATSISS
Mortality data for 2011–15 showed that for Indigenous males, deaths were highest in the 50–64 year age groups, while for Indigenous females deaths were highest in the 60–64 year age group. In 2015, chronic disease accounted for the majority of deaths of Indigenous Australians aged 55 years and over. Ischaemic heart disease was the leading cause of death in this age group (15%), followed by diabetes (10%) and respiratory diseases (8%) (ABS, 2016f).
The 2012–13 Health Survey included blood tests for measuring diabetes prevalence (ABS, 2014e). In 2012–13, 11% of Indigenous Australians aged 18 years and over had diabetes. Higher rates of diabetes were evident from 35 years onwards and by 55 years and over, one-third of Indigenous Australians had diabetes (see Figure 12).
Figure 12
Proportion of adults with diabetes, by Indigenous status and age, 2012–13
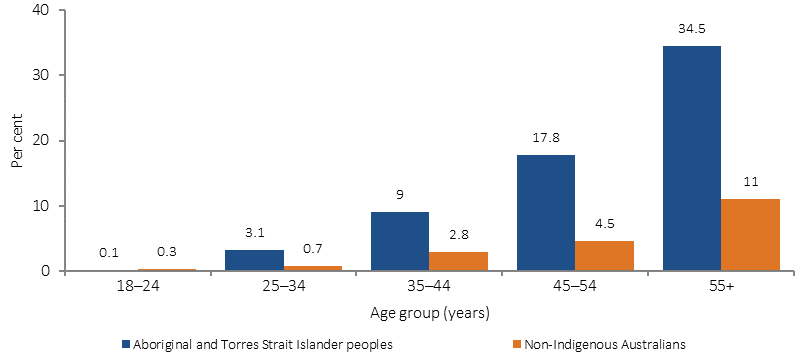
Source: ABS analysis of 2012–13 AATSIHS
The Aboriginal and Torres Strait Islander burden of disease study found different patterns in disease burden in the older age groups (AIHW, 2016f):
- Adults aged 45–64 years represented 15% of the Indigenous population and contributed 30% of the total burden. For Indigenous males aged 45–64 years, coronary heart disease, diabetes and lung cancer were the leading specific diseases contributing to the burden. For Indigenous females in this age group, coronary heart disease, COPD and diabetes were the leading diseases contributing to the burden.
- Indigenous adults aged 65–74 years represented 2% of the Indigenous population, but accounted for 8% of the burden. Coronary heart disease, COPD, lung cancer and diabetes were the major contributors to the burden in this age group. For males, falls was also a main contributor while for females other musculoskeletal conditions and chronic kidney disease were also major contributors to the burden.
- Adults aged 75 years and over comprised only 1% of the Indigenous population, but accounted for 5% of the total burden. Coronary heart disease, dementia, COPD, lung cancer, stroke, and diabetes were responsible for the majority of this burden in this age group.
Longitudinal research suggests the incidence of dementia among Aboriginal and Torres Strait Islander Australians is high, and is associated with a younger onset; and prevalence of head injury (Lo Giudice et al, 2016). A recent study involving Aboriginal and Torres Strait Islander Australians aged 60 years and over from urban and regional areas resulted in a prevalence estimate for dementia of 13% (Radford et al, 2015).
Older people with a reduced degree of functional capacity require a range of services. Aged care is usually provided in combination with basic medical services, prevention, rehabilitation or palliative care services. The age for accessing the Commonwealth Home Support Program has been adjusted to take account of the younger age at which Indigenous Australians may begin to suffer from serious chronic illness. Health literacy in older adults is particularly important in managing complex health problems and responding to age-related issues in vision and hearing deterioration or impairment (CDCP, 2011).