Gender
While many of the issues covered in this report show similarities for males and females, there are some key differences in health outcomes and determinants of health.
In 2010–12, life expectancy for Indigenous males was estimated to be 4 years lower than for Indigenous females. In addition, life expectancy for Indigenous males was estimated to be 10.6 years lower than that of non-Indigenous males and 9.5 years lower for females (see Figure 13).
Figure 13
Life expectancy at birth, Indigenous and non-Indigenous Australians by sex, 2010–12
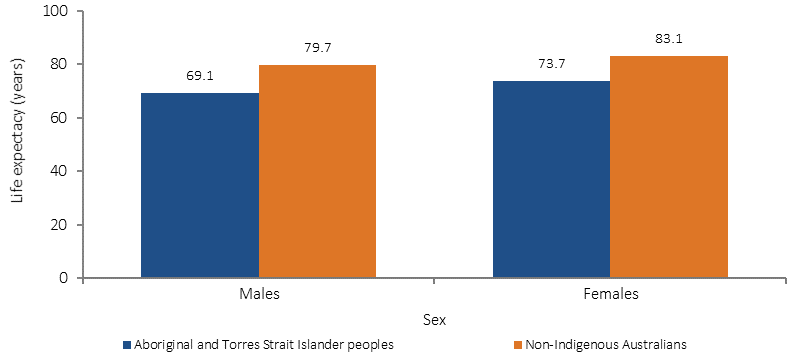
Source: ABS (2013b)
In 2011–15, infant mortality rates for Indigenous boys were 1.9 times as high as for non-Indigenous boys (6.5 per 1,000 live births compared with 3.5 per 1,000). For girls, the Indigenous rate was 1.8 times as high as for non-Indigenous girls (5.7 per 1,000 live births compared with 3.1 per 1,000).
During the period 2011–15, the mortality rate for Indigenous females was 1.7 times the rate for non-Indigenous females (888 per 100,000 compared with 510 per 100,000). The mortality rate for Indigenous males was also 1.7 times the rate for non-Indigenous males (1,110 per 100,000 compared with 658 per 100,000). The rate for Indigenous males was 1.2 times as high as for Indigenous females.
The Aboriginal and Torres Strait Islander burden of disease study found that 54% of the burden of illness and injury for Indigenous Australians was experienced by males and 46% by females (rate ratio of 1.27 times) in 2011 (AIHW, 2016f). The leading causes of the burden varied by sex: injuries were responsible for 19% of the burden for Indigenous males compared with 10% for Indigenous females. For males, injuries were ranked as the second leading cause (behind mental and substance use disorders); while for females, injuries were ranked third (behind mental and substance use disorders and cardiovascular diseases). Indigenous males experienced 68% of the burden from injuries and a greater share of the burden from cardiovascular diseases (58%), infant and congenital conditions (57%) and mental and substance use disorders (56%). Indigenous females experienced a greater share of the burden from blood and metabolic disorders (61%), musculoskeletal conditions (56%), kidney & urinary diseases (55%) and respiratory diseases (55%).
Results from the 2014–15 Social Survey showed that Indigenous females aged 15 years and over had a higher rate of self-reported disability/restrictive long-term health conditions (47%) than Indigenous males (43%).
In the period 2012–14, Indigenous females were 10.2 times more likely to have end stage kidney disease (ESKD) than non-Indigenous females (66 per 100,000 compared with 6.5 per 100,000). The incidence rate for Indigenous males was 4.6 times that for non-Indigenous males (57 per 100,000 compared with 12 per 100,000). As such, rates for Indigenous females were around 1.2 times as high as rates for Indigenous males.
In 2014–15, smoking rates for Indigenous Australian males aged 15 years and over (45%) were slightly higher than for females (40%); with recent research suggesting there are differences in the reasons why men and women take up smoking or decide to quit (Knott et al, 2016).
In 2012–13, 41% of Indigenous females aged 18 years and over drank alcohol at single occasion risky levels (binge drinking) compared with 33% of non-Indigenous females. Indigenous males were also more likely to drink at single occasion risky levels (64%) compared with non-Indigenous males (58%). The proportion for Indigenous males was higher than for Indigenous females (64% compared with 41%). Over the period 2011–15, in NSW, Qld, WA, SA and the NT combined, Indigenous males died from alcohol-related causes at 5 times the rate of non-Indigenous males (33 per 100,000 compared with 7 per 100,000), and Indigenous females at 6 times the rate for non-Indigenous females (13 per 100,000 compared with 2 per 100,000). Over the period July 2013 to June 2015, Indigenous males were hospitalised for diagnoses related to alcohol use at 4.2 times the rate for non-Indigenous males, and Indigenous females at 3.6 times the rate for non-Indigenous females.
Indigenous males aged 15 years and over were more likely to report having used a substance in the last 12 months compared with Indigenous females. Males were more likely to report having used marijuana, hashish or cannabis resin (25%) compared with females (14%) and were also more likely to report having used amphetamines or speed (6%) compared with females (3%). Females were more likely than males to report having used pain killers or analgesics for non-medical purposes (14% compared with 10%).
In 2012–13, Indigenous males aged 18 years and over were more likely to meet the physical activity guidelines for sufficient activity (43%) than Indigenous females (33%). Indigenous women aged 15 years and over had higher rates of obesity (40%) and lower rates of overweight (26%) compared with Indigenous males (34% and 31% respectively) (see Figure 14).
Figure 14
Proportion of Indigenous persons aged 15 years and over by BMI category, by sex, 2012–13
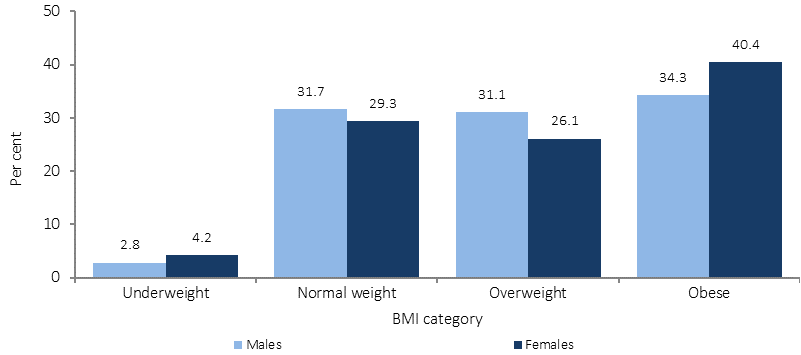
Source: ABS and AIHW analysis of 2012–13 AATSIHS
The 2015 NAPLAN data shows that Indigenous girls are performing better than Indigenous boys in reading across all year levels and across all remoteness areas. For example, in very remote areas, 53% of all Indigenous girls met the national minimum standards for Year 3 reading in 2015 compared with 41% of Indigenous boys. However, there was little difference between indigenous boys and girls in numeracy results. For reading literacy on average, 15-year-old Indigenous females were about one-and-a-third years of schooling ahead of Indigenous males (Thomson, S et al, 2016). While there were no statistically significant differences between Indigenous girls and boys in mathematical literacy and scientific literacy, a recent study by Meehl and Biddle (2016) shows that Indigenous females outperform their male counterparts when maths, reading and science test scores are averaged. The gap between females and males is considerably larger for Indigenous Australians than for non-Indigenous Australians.
In 2014–15, 64% of Indigenous women aged 20–24 years had completed a Year 12 or equivalent qualification; this was slightly more than Indigenous men (60%). Indigenous women aged 20–64 years are as likely as Indigenous men to have a non-school qualification of Certificate III level or above (39% and 40% respectively), but slightly more likely to have a qualification of bachelor and above (7% and 5% respectively). Indigenous women (7%) are much less likely than non-Indigenous women (34%) to have a higher qualification.
Of Indigenous school leavers aged 17–24 years, 35% of women were fully engaged in work or study in 2011; this was substantially lower than for Indigenous men (45%). In 2011, 90% of Indigenous women aged 17–24 years who had at least one child were not fully engaged in work or study, compared with 45% of those without children.
In 2015, the Total Fertility Rate (the average number of babies born to a woman throughout her reproductive life of 15–49 years) for Indigenous women was 2.27, compared with 1.81 for all mothers (ABS, 2016a). The median age of Indigenous women who registered a birth in 2015 was 25.1 years, almost six years lower than the median age of all mothers (31.0 years). In 2014 Indigenous teenagers had a birth rate almost 6 times the non-Indigenous rate. The Indigenous teenage birth rate is at its lowest level since reporting using ABS Birth Registrations began in 2004. A recent study using the 2006–11 Australian Census Longitudinal Dataset found that a lower proportion of those with childcare responsibilities had educational attainment at Certificate level II than those without childcare responsibilities; that the disparity was greater for Indigenous than for non-Indigenous Australians; and that in the 15–24 year age group the disparity was greater for females than for males (Biddle & Crawford, 2015). Childcare responsibilities also have a significant impact on employment, particularly for women. The presence of dependent children is negatively associated with labour force participation for Australian females but not males (Belachew & Kumar, 2014).
In 2014–15, Indigenous males aged 15–64 years had higher rates of employment (54%) than Indigenous females (43%). Figure 15 shows that between 2008 and 2014–15 the employment rate for Indigenous males fell from 63% to 54%; while for Indigenous females there was no statistically significant change (46% compared with 43%). After removing CDEP employment from the trend, there was no statistically significant change in the male non-CDEP employment rate (55.3% compared with 53.9%) or the female non-CDEP employment rate (41.6% in 2008 compared with 43.3%) between 2008 and 2014–15. In 2014–15 the employment gap between Indigenous men and women was 11 percentage points, down from 18 percentage points in 1994. This is partly due to the decline of CDEP disproportionately affecting Indigenous men.
Figure 15
Employment rate, Indigenous Australians aged 15-64 years, by sex, 1994 to 2014–15 (per cent)
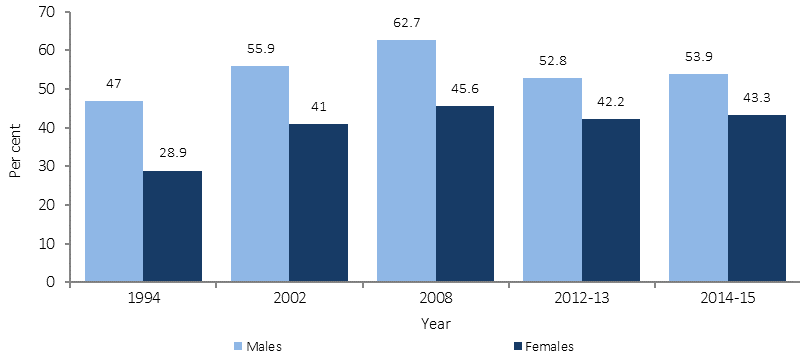
Source: ABS and AIHW analysis of NATSISS 1994, NATSISS 2002, 2008 and 2014–15, AATSIHS (core component) 2012-13
The most common industry of employment for Indigenous women (aged 15 and over) was Health Care and Social Assistance - 25% of employed Indigenous women reported this as the industry of their main job in 2014–15 (compared with 6% of Indigenous men). The most common industry for Indigenous men was Construction, with 16% of employed Indigenous men and only 1% of Indigenous women.
The most common occupation of employment for Indigenous women (aged 15 years and over) was Community and Personal Service Workers - 31% of employed Indigenous women reported this as the occupation of their main job in 2014–15 (compared with 13% of Indigenous men). The most common occupation for Indigenous men was Technicians and Trades Workers; for 25% of employed Indigenous men and only 6% of Indigenous women.
Indigenous women were less likely to have a very high or very low income than Indigenous men. In 2014–15, 8% of Indigenous women aged 15 and over were in the bottom 10% by personal gross weekly income; this is slightly less than for Indigenous men (12%). Only 1% of Indigenous women were in the top 10% by income, compared with 6% for Indigenous men. The proportion of Indigenous women in the middle two deciles by income (23%) was almost 10 percentage points higher than Indigenous men (14%). Over half (57%) of Indigenous women aged 18–64 years had government pensions or allowances as their main source of income in 2014–15; compared with 40% of Indigenous men.
Differences exist in the types of stressors experienced by men and women. In 2014–15, 30% of Indigenous females aged 15 years and over said they had not experienced problems due to any of 25 potentially stressful events in the last year (34% for Indigenous men). The most common stressor was the death of a friend or family member, for both Indigenous females (30%) and Indigenous males (25%). Indigenous females were less likely to have been stressed about not being able to get a job (16%) than Indigenous males (21%). Indigenous males were more likely to report trouble with the police (6% of men compared with 3% of females). Similar proportions of Aboriginal and Torres Strait Islander males and females reported alcohol or drug related problems as a stressor (9%).
Indigenous women were less likely to feel safe walking alone in their local area after dark (51% compared with 83% of Indigenous men) and were less likely to feel safe at home alone after dark (79% compared with 95% of men). Indigenous females were more likely to report an experience of abuse or violent crime (4% compared to 2% of males). In non-remote areas 22% of Indigenous females reported family violence as a neighbourhood problem compared with 15% of males; while in remote areas males and females reported family violence at similar levels (49% of men and 47% of women). In remote areas the largest sex difference for neighbourhood problems was gambling, with 38% of Indigenous women reporting it a problem, 8 percentage points more than Indigenous men.
After adjusting for differences in the age structure of the two populations, Indigenous Australians were hospitalised for assault at 14 times the rate of non-Indigenous Australians. Indigenous females were 30 times as likely to have been hospitalised for assault as non-Indigenous females, and Indigenous males were 9 times as likely as non-Indigenous males. The Indigenous female rate was 53 times the non-Indigenous female rate in remote areas (and 38 times in very remote areas). In 2014–15, Indigenous female family violence-related hospitalisation rates were 32 times the rate for non-Indigenous females and the rate for Indigenous males was 23 times the rate for non-Indigenous males (SCRGSP, 2016b).
In 2014–15, 48% of Indigenous males aged 15 years and over reported that they had been charged by the police in their lifetime, and 20% had been arrested by the police in the last 5 years (compared with 23% and 9% respectively for Indigenous females). As at 30 June 2016, 90% of Indigenous prisoners were male and 10% were female. Indigenous men made up 27% of the total male prisoner population and Indigenous women represented 34% of the female prisoner population. During 2014–15 there were 4,741 Indigenous young people under youth justice supervision (AIHW, 2016ab). Females made up 20% of Indigenous young people under supervision (similar to the non-Indigenous proportion).
While similar proportions of Indigenous males (42%) and females (41%) aged 15 years and over reported that they had experienced being without a permanent place to live, the reasons behind these experiences differed. Women were more likely than men to report violence/abuse/neglect as a reason (8% compared with 3%), while men were more likely to report a work-related reason (5% compared with 2%).
Based on the 2014–15 Social Survey, Indigenous women aged 15 years and over were significantly more likely than Indigenous men to report high/very high levels of psychological distress (39% compared with 26%).
Over the period 2011–15, males made up 71% of suicides among Indigenous Australians. Rates for Indigenous males were highest among those aged 30–34 years (65 per 100,000 population), while rates for non-Indigenous males were highest among those aged 40–49 years (27 per 100,000). Rates for Indigenous females were highest among those aged 20–24 years and 35–39 years (both 26 per 100,000), while for non-Indigenous females rates were highest among those aged 45–49 years (8.7 per 100,000) (see Figure 16).
Figure 16
Mortality from suicide rates per 100,000, by Indigenous status, sex and age group, NSW, Qld, WA, SA and the NT, 2011–15
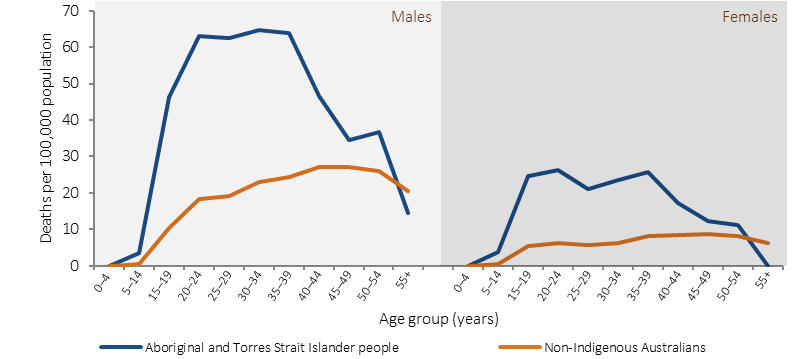
Source: AIHW and ABS analysis of National Mortality Database
Access to health care also varies by gender, with males and particularly teenage males less likely to access care. In the 2012–13 Health Survey, 40% of Indigenous males reported accessing health services in the last 2 weeks (12 months for hospital), compared with 48% of Indigenous females. However, there is a different pattern for Indigenous substance use services, with 54% of Indigenous clients being male and 46% female.
In 2014–15, for those aged 15 years and over, Indigenous women were more likely than Indigenous men to have participated in a cultural event, ceremony or organisation in the last 12 months (66% compared with 59%).