1.10 Kidney Disease
Page content
Why is it important?
The kidneys can be permanently damaged by various acute illnesses or by progressive damage from chronic conditions such as elevated blood pressure and long-standing high blood sugar levels (untreated diabetes). If the kidneys cease functioning entirely (known as end stage kidney disease, or kidney failure), waste products and excess water build up rapidly in the body. This can cause death within a few days or weeks unless a machine is used to filter the blood several times per week (kidney dialysis), or a new kidney is provided by transplant. A lower proportion of Indigenous than non-Indigenous patients receive kidney transplants, so most must have dialysis three times a week for the rest of their lives, impacting quality of life and social and emotional wellbeing for patients (Devitt et al, 2008; AIHW, 2016n; Chadban et al, 2005) and their carers (Rix et al, 2015).
Findings
Chronic kidney disease was responsible for 1.9% of the Indigenous burden of disease in 2011 (AIHW, 2016f). Note: the contribution of kidney disease as an associated cause is not captured in this data. Indigenous Australians experienced 7.3 times the burden of disease due to chronic kidney disease than non-Indigenous Australians. High body mass (37%) and high blood pressure (19%) were key risk factors for kidney and urinary diseases. Between 2003 and 2011, the Indigenous burden of disease due to kidney and urinary diseases was relatively stable. Disease burden for Indigenous Australians due to kidney and urinary diseases increased by remoteness and also with poor socio-economic status; rates were particularly high in the NT.
Based on the 2012–13 Health Survey, nearly one in five (18%) Indigenous Australian adults had blood/urine test results showing signs of kidney problems (infection, acute or chronic condition) (ABS, 2014e). The majority of these showed signs of being in Stage 1 (12%) with very few in Stages 4–5 (1%). Of those with signs of kidney disease, 89% did not have a diagnosis for chronic kidney disease (CKD). The onset of kidney disease tends to be at an earlier age in Indigenous Australians, with rates steadily increasing from the age of 18, compared with rates beginning to climb from 55 years for non-Indigenous Australians. After adjusting for age differences in the two populations, Indigenous adults were twice as likely as non-Indigenous adults to have signs of kidney disease (3 times for Stage 1 and around 5 times for Stages 4–5). Among Indigenous Australians, rates for signs of kidney disease were highest in very remote areas (37%) compared with 12% in major cities.
In 2012–13, 38% of Indigenous Australians with kidney problems also had diabetes. Indigenous Australians with high blood pressure were twice as likely to have kidney problems as those with normal blood pressure (29% compared with 15%). Rates were also higher for those who were obese (20%) compared with underweight/normal weight (13%).
During 2011–15, 2% of deaths among Indigenous Australians (259) were due to kidney disease. After adjusting for the different age profiles of the two populations, the kidney disease mortality rate was 2.6 times the non-Indigenous rate. Kidney disease death rates significantly declined for Indigenous Australians between 2006 and 2015 (by 47%) and the gap halved with non-Indigenous Australians (declined by 54%). In 2011–15, there were also 2,268 deaths among Indigenous Australians where kidney disease was listed as an associated cause of death.
In 2013–15, care involving dialysis was the leading cause of hospitalisation (46%) for Indigenous Australians. Hospitalisation for dialysis was 11 times the non-Indigenous rate. Excluding dialysis there were also 5,790 hospitalisations for Indigenous Australians during this period for chronic kidney disease, 3.6 times the non-Indigenous rate.
The incidence of patients commencing ongoing kidney replacement therapy (KRT) (dialysis or kidney transplantation) for end stage kidney disease (ESKD) is higher for Indigenous Australians than for non-Indigenous Australians. Between 2012 and 2014, there were 777 new Indigenous patients registered as commencing KRT, accounting for 10% of all new registrations. The age-adjusted incidence rate of treated ESKD was 7 times as high for Indigenous Australians as for non-Indigenous Australians. Indigenous Australians commencing KRT were younger, with 57% aged less than 55 years compared with 31% of non-Indigenous Australians. Treated ESKD incidence rate was higher for Indigenous Australians in all adult age groups, with the greatest gap seen in the 55–64 year age group. In the period 2012–14, treated ESKD incidence rates among Indigenous Australians were highest in the NT (192 per 100,000) and lowest in NSW/the ACT (34 per 100,000). Treated ESKD incidence rates were higher in remote (132 per 100,000) and very remote areas (133 per 100,000) than major cities (29 per 100,000), with a female predominance in remote areas (Hoy et al. 2016, AIHW 2016). For non-Indigenous Australians, rates were similar across all regions.
No significant change was found in the rates of treated ESKD for Indigenous Australians between 1996 and 2014. Rates increased for non-Indigenous males. The gap has not changed significantly.
A recent study found that Indigenous Australians on dialysis had a higher death risk than non-Indigenous Australians where diabetes was also present (1.15 times) (Khanal et al, 2016). Research in the NT found that the survival gap between Indigenous and non-Indigenous patients receiving KRT has closed between 1995–99 and 2000–04 (unadjusted), but a significant disparity in survival remained after adjusting for other variables (Lawton et al, 2015).
ESKD patients require either a kidney transplant or dialysis to maintain the functions normally performed by the kidneys. In December 2014, there were 1,771 Indigenous Australians registered for ongoing KRT. Of these, 88% were reliant on dialysis and 12% had received a kidney transplant. In comparison, 52% of non-Indigenous Australians with treated ESKD were reliant on dialysis and 48% had a kidney transplant. After adjusting for differences in the age structure of the two populations, Indigenous Australians with treated ESKD were 9 times as likely as non-Indigenous Australians with treated ESKD to be reliant on dialysis.
Figures
Figure 1.10-1
Age-standardised incidence rates for treated end stage kidney disease, by Indigenous status, 1996 to 2014
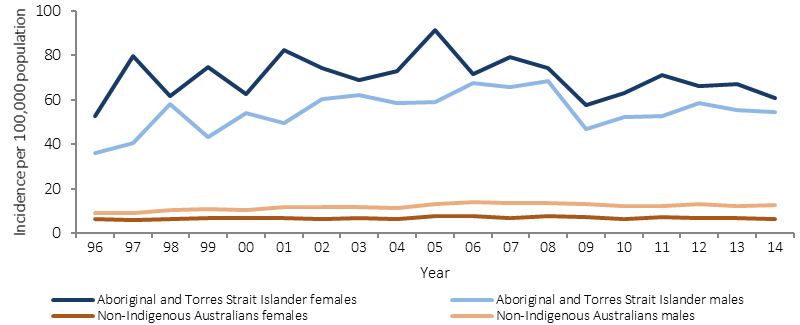
Source: AIHW analysis ANZDATA
Figure 1.10-2
Incidence of treated end stage kidney disease by Indigenous status and age group, 2012–14
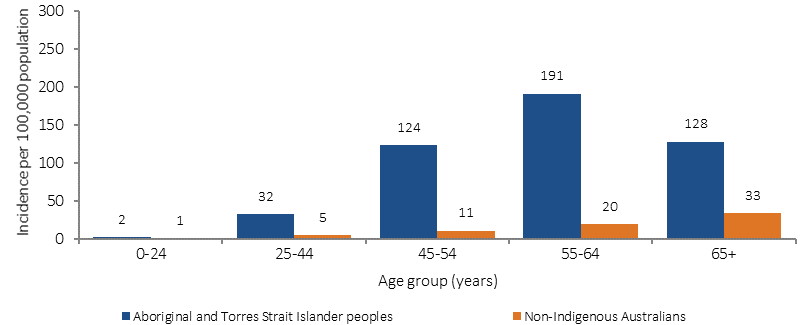
Source: AIHW analysis of ANZDATA
Figure 1.10-3
Age-standardised incidence of treated end stage kidney disease by Indigenous status and remoteness, 2012–14
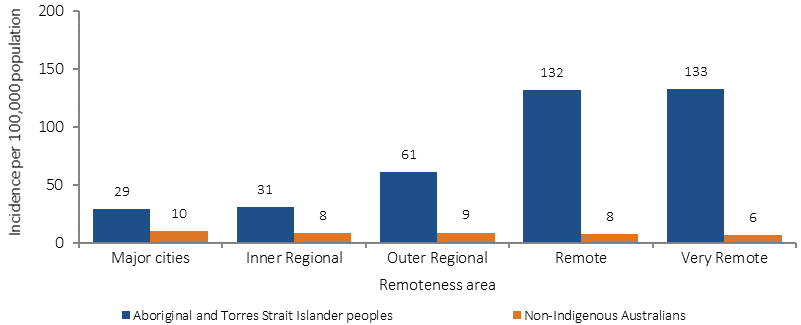
Source: AIHW analysis of ANZDATA
Table 1.10-1
Prevalence of treated end stage kidney disease, by Indigenous status and treatment, 31 December 2014
Treatment: |
Number |
Rate per 100,000 |
Ratio |
||
|---|---|---|---|---|---|
Indigenous |
Non-Indigenous |
Indigenous |
Non-Indigenous |
||
Dialysis |
1,551 |
10,540 |
385 |
41 |
9.4* |
Transplant |
220 |
9,756 |
47 |
40 |
1.2* |
Total |
1,771 |
20,296 |
432 |
81 |
5.3* |
Source: AIHW analysis of ANZDATA
Table1.10-2
Incidence of treated end stage kidney disease among Indigenous Australians, by jurisdiction, 2012–14
Jurisdiction |
Male |
Female |
Persons |
||||||
|---|---|---|---|---|---|---|---|---|---|
No. |
Rate (a) |
Ratio |
No. |
Rate (a) |
Ratio |
No. |
Rate (a) |
Ratio |
|
NSW/ACT |
55 |
30 |
2.6* |
63 |
37 |
5.1* |
118 |
34 |
3.5* |
Vic |
26 |
64 |
5.1* |
11 |
30 |
3.8* |
37 |
47 |
4.5* |
Qld |
64 |
38 |
3.4* |
84 |
45 |
7.0* |
148 |
41 |
4.7* |
WA |
86 |
111 |
10.1* |
82 |
92 |
14.8* |
168 |
101 |
11.6* |
SA |
n.p. |
n.p. |
n.p. |
n.p. |
n.p. |
n.p. |
n.p. |
n.p. |
n.p. |
Tas |
n.p. |
n.p. |
n.p. |
n.p. |
n.p. |
n.p. |
n.p. |
n.p. |
n.p. |
NT |
104 |
150 |
17.9* |
158 |
229 |
33.9* |
262 |
192 |
25.7* |
Australia |
351 |
57 |
4.6* |
426 |
66 |
10.2* |
777 |
62 |
6.6* |
n.p. is ‘not published’ as the rate is based on very small numbers.
(a) Rate per 100,000 population (age-standardised).
Source: AIHW analysis of ANZDATA
Implications
The high level of CKD, including ESKD, among Indigenous Australians is associated with the high rates of diabetes, high blood pressure, obesity, low birthweight, and possibly the high rates of infections in childhood (AIHW, 2011d; Hoy, WE et al, 2016; Kim et al, 2017). These factors, in turn, are associated with determinants of health (see Tier 2) and access to appropriate and timely detection, diagnosis and treatment (Cass et al, 2004).
A study of Australian nephrologists found that, in the absence of robust evidence on predictors of post-transplant outcomes, decisions on which patients to refer for kidney transplantation were influenced by factors such as kidney shortages, compliance with dialysis as a predictor of compliance with transplant regimes (despite large differences in these factors), and experiences with other Indigenous patients (Anderson, K et al, 2012). Indigenous Australians have relatively poorer access to kidney transplants and addressing barriers is important (Cass et al, 2003; Yeates et al, 2009). Given the high cost of dialysis, focusing on prevention and better management of early stage CKD is vital (Reilly et al, 2016; Chen, T & Harris, 2015).
Dialysis is a tertiary hospital service, and is an ongoing state and territory government responsibility through the National Health Reform Agreement. The Commonwealth is also providing $27.5 million for a range of renal activities in the NT/tri state area from 2014–15 to 2017–18. This includes construction and refurbishment of accommodation and infrastructure to assist renal patients to access services. In addition, mobile Dialysis Bus services offer respite dialysis to remote communities in the NT and SA. They allow Aboriginal dialysis patients to visit their home communities for significant events and to spend time on country with family and friends. Projects funded in WA include:
- $45.769 million to expand 10 hospitals across the Kimberley, Pilbara, Goldfields and Midwest; providing 17 additional renal dialysis chairs and 46 patient accommodation units
- $8.6 million to establish the Derby and Kununurra satellite dialysis services
- $2.552 million to expand the service at Bunbury
- $0.466 million for a mobile medical team in Kalgoorlie.
These options are important for remote communities, where people with ESKD often need to travel long distances, or permanently relocate, to receive dialysis.