1.03 Injury and poisoning
Page content
Why is it important?
Injuries can cause long-term disability and disadvantage including reduced opportunities in education and employment, communication impairment and burden on caregivers (Stephens et al, 2014). Indigenous Australian children suffer a disproportionately high burden of unintentional injury (Möller et al, 2017).
Findings
Injury was the second leading cause of disease burden for Indigenous Australians, representing 15% of the burden; and 14% of health gap between Indigenous and non-Indigenous Australians in 2011 (AIHW, 2016f). Most injury burden was due to early death (84%); predominantly in the 15–44 year age group; and for males. Injury represented 19% of the burden for Indigenous males and 10% for Indigenous females. Suicide and self-harm accounted for 30% of the total injuries burden, followed by road traffic injuries (17%) and homicide and violence (12%).
External causes (injury and poisoning) was the third leading cause of death, accounting for 15% of deaths among Indigenous Australians in 2011–15, in the five jurisdictions with adequate data for reporting (NSW, Qld, WA, SA and the NT combined). Mortality rates for Indigenous males were twice the rate for Indigenous females. There has been no significant change since 1998. Indigenous Australians died from external causes at twice the non-Indigenous rate (after adjusting for age).
The most common external causes of Indigenous mortality were intentional self-harm (690 deaths), followed by transport accidents (434 deaths), accidental poisoning (276 deaths) and assault (200 deaths). Indigenous Australians died from intentional self-harm (suicide) and transport accidents at 2.1 and 2.6 times the rate of non-Indigenous Australians respectively. Indigenous Australians died from assault at 7.2 times the non-Indigenous rate. Aboriginal mothers died from external causes of death at rates 6.6 times non-Indigenous mothers in WA between 1983 to 2010; mainly from transport accidents (Fairthorne et al, 2016).
Based on the 2012–13 Health Survey, 19% of Indigenous Australians had experienced injuries in the 4 weeks prior to the survey, with falls (45%) and hitting or being hit by something (19%) being the most common events causing injury. The main types of injuries were open wounds (35%) and bruising (28%). Action was taken by 46% of those injured, and of those who were treated, 11% were injured while under the influence of alcohol/drugs (15 years and over). Of those with a long-term health condition, 27% reported that it was as a result of injury or an accident. In 2012–13, Indigenous Australians (aged 15 years and over) experienced stress due to a serious accident at 1.8 times the non-Indigenous rate.
Hospitalisations for injury reflect hospital attendances for the condition rather than the extent of the problem in the community. Injury was the second most common reason for hospitalisation for Indigenous Australians (57,639 separations) in the two years to June 2015 (after dialysis). The injury hospitalisation rate among Indigenous Australians was 1.8 times the non-Indigenous rate. For non-Indigenous Australians, injury hospitalisation rates were much higher for those aged 65 years and over than in younger age groups. This reflects higher rates of falls for elderly people. There was a different pattern for Indigenous Australians: injury had a greater impact on the young and middle-aged. Rates varied across jurisdictions, with the highest rates in the NT and WA.
Injury hospitalisation rates among Indigenous Australians have increased by 38% since 2004–05 in the six jurisdictions with adequate data for trend reporting (NSW, Vic, Qld, WA, SA and the NT combined). Rates increased faster for Indigenous Australians compared with non-Indigenous Australians, resulting in an increase in the difference between the two populations.
For Indigenous males, falls were the leading cause of injury hospitalisation (20%) followed by assault (17%). For Indigenous females, assault was the leading cause (24%), followed by falls (20%). After age-standardising, hospitalisation rates for assault were much higher for Indigenous men (8.5 times as high) and Indigenous women (30 times) than for non-Indigenous men and women. Rates of hospitalisation for assault for Indigenous Australians were highest in remote (22 per 1,000) and very remote areas (21 per 1,000) and lowest in inner regional areas (3 per 1,000). Indigenous Australians are also more likely to be re-admitted to hospital as a result of interpersonal violence than other Australians (Berry, JG et al, 2009; Meuleners et al, 2008). Other leading causes of injury hospitalisation for Indigenous Australians include complications of medical care (14%), exposure to inanimate mechanical forces (13%), and transport accidents (9%). Over the period 2005–06 to 2009–10, 60% of transport-related fatal injuries among Indigenous Australians involved car occupants and 26% involved pedestrians (Henley & Harrison, 2013). Indigenous hospitalisation and mortality rates were substantially higher in Indigenous than non-Indigenous Australians, with an increase over the period 1997–2011. This highlights the need to develop a comprehensive injury prevention strategy in the NT (Foley et al, 2014).
Based on GP survey data (2010–15), injuries accounted for 5% of all problems managed by GPs among Indigenous patients. The most common injury problems were musculoskeletal and skin injuries. After age-standardisation, the rate of injuries managed per 1,000 GP encounters was similar for Indigenous and other Australian patients (70 and 66 per 1,000 encounters respectively). While assault/harmful event accounted for only 0.2% of all problems managed by GPs for Indigenous patients, the rate per 1,000 GP encounters was 4 times that for other Australian patients.
Figures
Figure 1.03-1
Age-standardised death rates for external causes, by Indigenous status and sex, 2011–15
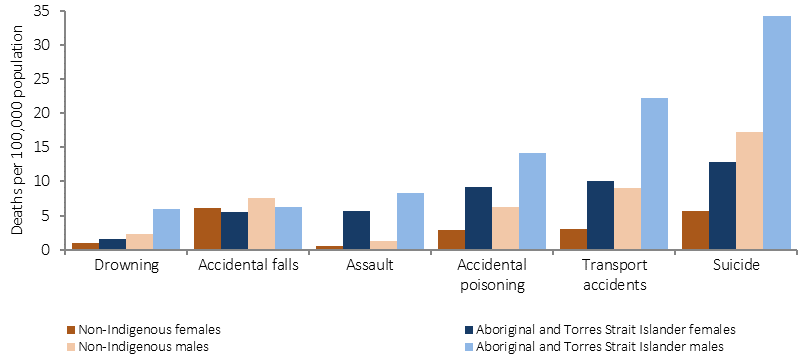
Source: ABS and AIHW analysis of National Mortality Database
Figure 1.03-2
Age-specific hospitalisation rates for injury and poisoning, by Indigenous status and sex, July 2013–June 2015
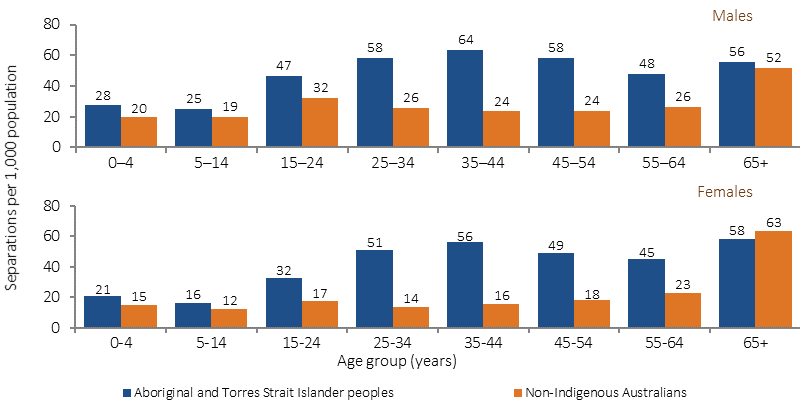
Source: AIHW analysis of National Hospital Morbidity Database
Table 1.03-1
Age-standardised hospitalisations for external causes of injury and poisoning for Aboriginal and Torres Strait Islander peoples by sex and cause, July 2013–June 2015
External Cause: |
Males |
Females |
Persons |
||||||
|---|---|---|---|---|---|---|---|---|---|
% |
Rate(a) |
Ratio |
% |
Rate(a) |
Ratio |
% |
Rate(a) |
Ratio |
|
Assault |
17.2 |
8.5 |
8.5 |
23.6 |
9.3 |
30.3 |
20.1 |
8.9 |
13.6 |
Falls |
19.8 |
10.6 |
1.4 |
19.6 |
10.4 |
1.2 |
19.7 |
10.7 |
1.3 |
Exposure to inanimate mechanical forces |
15.4 |
6.4 |
1.5 |
8.9 |
3.0 |
2.0 |
12.5 |
4.7 |
1.6 |
Complications of medical and surgical care |
11.5 |
7.8 |
1.6 |
15.9 |
8.1 |
1.8 |
13.5 |
7.9 |
1.7 |
Transport accidents |
11.1 |
4.8 |
1.3 |
6.5 |
2.4 |
1.4 |
9.0 |
3.6 |
1.4 |
Intentional self-harm |
5.2 |
2.5 |
3.1 |
10.5 |
3.8 |
2.5 |
7.6 |
3.2 |
2.7 |
Other accidental exposures |
6.8 |
3.3 |
1.0 |
5.7 |
2.4 |
1.2 |
6.3 |
2.9 |
1.0 |
Exposure to animate mechanical forces |
5.8 |
2.4 |
2.1 |
3.2 |
1.1 |
1.8 |
4.6 |
1.8 |
2.0 |
Exposure to electric current/smoke/ fire/animals/nature |
3.1 |
1.4 |
2.2 |
2.1 |
0.7 |
2.3 |
2.7 |
1.0 |
2.2 |
Accidental poisoning by and exposure to noxious substances |
2.2 |
1.1 |
2.4 |
2.3 |
0.9 |
2.5 |
2.3 |
1.0 |
2.5 |
Other external causes |
1.8 |
0.8 |
3.4 |
1.6 |
0.7 |
3.4 |
1.7 |
0.7 |
3.4 |
Total |
100.0 |
49.8 |
1.8 |
100.0 |
43.1 |
2.0 |
100.0 |
46.5 |
1.8 |
Total number of hospitalisations for injury or poisoning: |
31,623 |
26,015 |
57,639 |
||||||
(a) Per 1,000 persons, directly age-standardised using the Australian 2011 standard population.
Source: AIHW analysis of National Hospital Morbidity Database
Figure 1.03-3
Age-standardised hospitalisation rates for injury and poisoning, by Indigenous status, NSW, Vic, Qld, WA, SA and the NT,
2004–05 to 2014–15
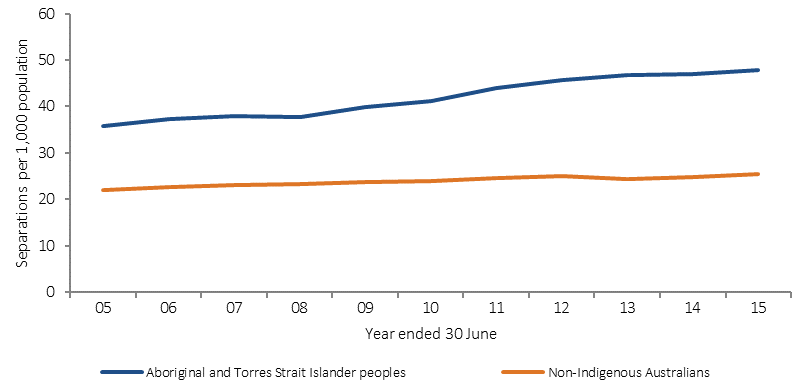
Source: AIHW analysis of National Morbidity Database
Figure 1.03-4
Age-standardised hospitalisation rates for external causes of injury and poisoning by Indigenous status and jurisdiction,
July 2013–June 2015
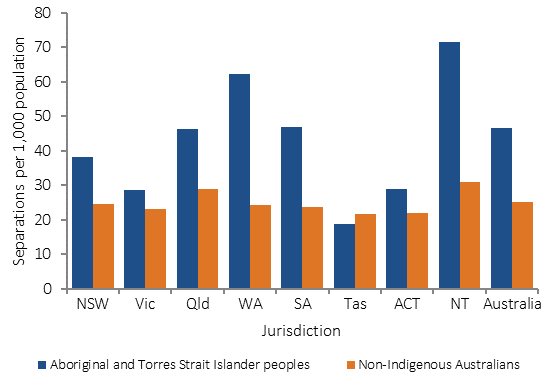
Source: AIHW analysis of National Hospital Morbidity Database
Implications
Among Indigenous Australians, suicide is the leading cause of death from external causes (see measure 1.18), followed by transport accidents (MacRae et al, 2013). Assault and falls are the most important injury Australians were 3.3 times as likely as non-Indigenous Australians to die of a transport-related injury as a car occupant.
A long-term NT study showed injury prevention issue in relation to hospitalisations (Lukaszyk et al, 2016; AIHW & Pointer, 2015). Policy responses to these varied safety issues need to be multidimensional including prevention and health care responses. Alcohol and substance use has been found to be a factor in suicide (Robinson, G et al, 2011) and transport accidents (West, C et al, 2014; Fitts et al, 2017) as well as assault (Mitchell, 2011).
An objective of the National Road Safety Strategy 2011–2020 is to ensure Indigenous Australians have access to graduated driver licensing and to safe vehicles. Most jurisdictions have either specific licensing programs for remote areas or other assistance such as mentoring and access to vehicles for learner drivers. WA has recently distributed information on safer vehicles which meet the needs of people in remote areas, online and in a brochure; and is working with Aboriginal Corporations on safer fleet vehicle purchases. There are also a number of child car safety programmes such as Buckle Up Safely (Hunter, K et al, 2016).