1.17 Perceived health status
Page content
Why is it important?
Self-assessed health status provides a measure of the overall level of a population’s health based on individuals’ personal perceptions of their own health. Health is recognised as having physical, mental, social and spiritual components. Therefore, the measurement of health must go beyond quantifying levels of morbidity and mortality. Part of this broader approach is to ask people to assess the state of their own health.
Self-assessed health status is dependent on an individual’s awareness and expectations regarding their health. It is influenced by various factors, including access to health services and information, the extent to which health conditions have been diagnosed and level of education (Delpierre et al, 2009). Social constructs of health also influence this assessment, such as culturally distinct views of health and wellbeing held by Aboriginal and Torres Strait Islander peoples, the existing level of health within a community and judgments concerning the person’s own health compared with others in their community (Vass et al, 2011; OECD, 2015).
Self-assessed health status correlates with measures of health, such as reported long-term health conditions, recent health-related actions, and the presence of disability. However, many Aboriginal and Torres Strait Islander people rate their health as good or excellent despite significant health problems. Self-assessed health status is a useful measure of overall health status and future health care use, but is not an objective measure and needs to be interpreted with caution.
Findings
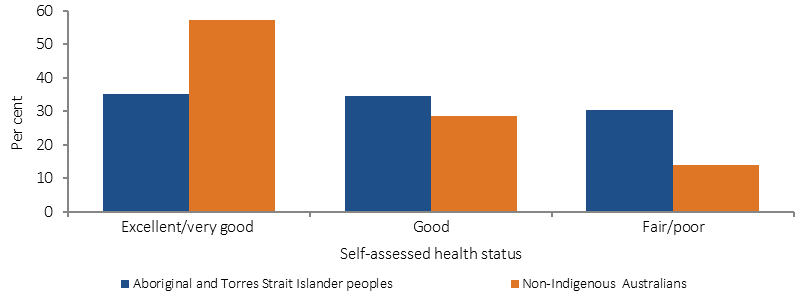
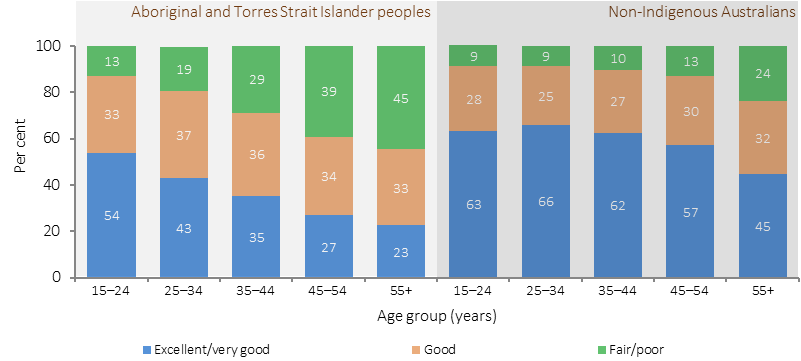
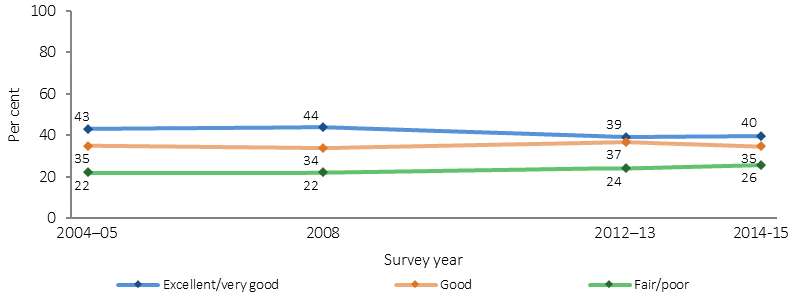
Based on responses from the 2014–15 Social Survey, 40% of Aboriginal and Torres Strait Islander peoples aged 15 years and over reported their health as being excellent or very good, 35% reported their health as being good, and 26% reported their health as being fair or poor (ABS, 2016e). There has been a decline in the proportion of the population rating their health as excellent/very good between 2008 (44%) and 2014–15 (40%). Older people were less likely than younger people to rate their health as excellent/very good—23% of those aged 55 years and over compared with 54% of 15–24 year olds. A smaller proportion of females than males reported excellent or very good health (37% compared with 43%). Aboriginal and Torres Strait Islander peoples were less likely than non-Indigenous Australians to report excellent or very good health, particularly among those in older age groups. After adjusting for differences in the age structure of the two populations, Aboriginal and Torres Strait Islander peoples were twice as likely as non-Indigenous Australians to report their health as fair or poor.
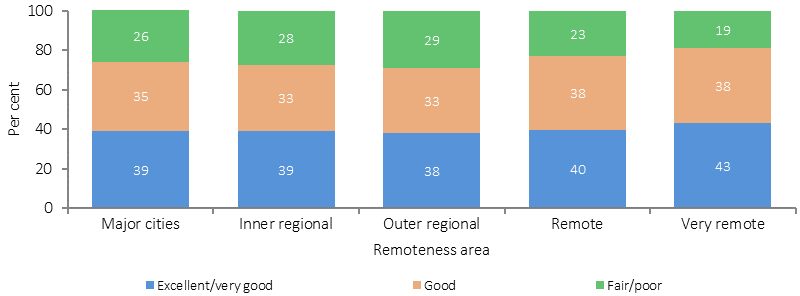
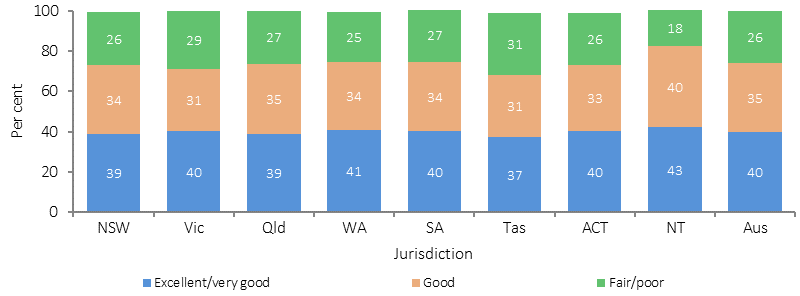
The proportion of Aboriginal and Torres Strait Islander peoples reporting fair or poor health was higher in Tasmania (31%), Victoria (29%) and Qld (27%) than in the NT (18%). Indigenous Australians aged 15 years and over living in remote/very remote areas were less likely to report their health as being fair or poor (20%) compared with those living in non-remote areas (27%). Despite these results there is evidence that a number of health conditions such as circulatory disease (see measure 1.05) and kidney disease (see measure 1.10) and risk factors such as smoking (see measure 2.15) are worse in remote areas. Interpretation of the question will be influenced by the person’s view of ‘health’ and whether the concept is perceived holistically to include social, cultural, emotional and spiritual wellbeing or as a biomedical concept linked to the absence of disease and incapacity (NAHSWP, 1989; Vass et al, 2011). It can also be influenced by whether health conditions have been diagnosed. In 2015–16, there was a clear gradient, reducing by remoteness, in rates of Medicare service claims for GPs and therefore rates of diagnosis are likely to be lower in remote areas. Self-assessed health can also be influenced by how an individual assesses their own health relative to other people around them.
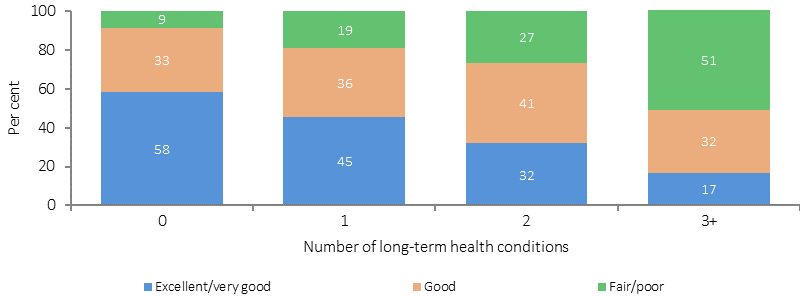
The proportion of Aboriginal and Torres Strait Islander peoples reporting fair or poor health increases with the number of long-term health conditions reported.
In 2014–15, 52% of Indigenous Australians living in households in the highest income quintile reported excellent/very good health status, compared with 37% of those in the lowest quintile. Approximately 50% of those who had completed Year 12 reported excellent/very good health, compared with 34% of those who had completed Year 10 or below. Note: this analysis does not control for age. In 2014–15, excellent/very good self-assessed health status was associated with feeling safe, feeling able to have a say with family or friends and within the community, having daily contact with family or friends outside the household, having friends and family outside the household to confide in, no community problems reported and agreeing that most people can be trusted (see measure 1.13).
Figures
Figure 1.17-1
Self-assessed health status (age‑standardised) by Indigenous status, persons aged 15 years and over, 2014–15
Source: ABS and AIHW analysis of 2014–15 NATSISS
Figure 1.17-2
Self-assessed health status by Indigenous status and age group, persons aged 15 years and over, 2014–15
Source: ABS and AIHW analysis of 2014–15 NATSISS
Figure 1.17-3
Self-assessed health status, Indigenous Australians aged 15 years and over, by remoteness, 2014–15
Source: ABS and AIHW analysis of 2014–15 NATSISS
Figure 1.17-4
Self-assessed health status, Indigenous Australians aged 15 years and over, by number of long-term health conditions, 2014–15
Source: ABS and AIHW analysis of 2014–15 NATSISS
Figure 1.17-5
Self-assessed health status, Indigenous Australians aged 15 years and over, by state/territory, 2014–15
Source: ABS and AIHW analysis of 2014–15 NATSISS
Figure 1.17-6
Self-assessed health status, Indigenous Australians aged 15 years and over, 2004–05, 2008, 2012–13 and 2014–15
Source: ABS and AIHW analysis of 2012–13 AATSIHS and 2014–15 NATSISS
Implications
Reflecting higher prevalence and earlier onset of many chronic diseases, Aboriginal and Torres Strait Islander people are around half as likely as non-Indigenous Australians to have rated their health as excellent or very good (rate ratio 0.6). This is consistent with other measures of overall health status. Those living in remote areas are less likely to rate their health as fair/poor than those in non-remote areas. This could be related to perceptions of ‘health’, whether health conditions have been diagnosed and also how an individual assesses their own health relative to other people around them. On some measures such as the prevalence of diabetes, end stage kidney disease, eye health and smoking there is a worsening of health by remoteness (see measures 1.09, 1.10, 1.16 and 2.15).
An evaluation of the Victorian government’s Koolin Balit investment will conclude in 2016, and is showing that there has been considerable progress in some critical areas, including:
- the gathering place model (13 examples across Victoria were examined) is making substantial contributions to improving their local communities’ health and wellbeing
- some intensive case management models are improving health and wellbeing outcomes for some of the most complex children, families and individuals they are working with, and include some strategies that are replicable to other communities
- improvements in some Victorian hospitals’ cultural responsiveness and cultural safety for Aboriginal people.