2.08 Income
Page content
Why is it important?
A range of studies across different countries have found a gradient in health outcomes associated with income (Marmot, 2002). Income itself is highly correlated with educational attainment, employment and a range of social indicators (Deaton, 2003). Therefore, the relationship between income and health is complex and linked to other factors such as the capacity to live a healthy life including being able to afford nutritious food and quality housing; cost barriers to health care including health insurance and access to transport; risk behaviours including substance use and social participation (WHO, 2017; Marmot, 2016). The level of income inequality within a society has been found to be associated with social function (e.g. levels of violence, imprisonment, levels of trust, exclusion, insecurity, stress and educational performance) which mediate the relationship between income inequality and health outcomes (Marmot, 2016; Wilkinson & Pickett, 2009; Wolfson et al, 1999). Children’s health has been found to be associated with household income, the effects of which accumulate over children’s lives (Case et al, 2002).
Biddle (2015a) found a correlation between income and measures of happiness and sadness for Indigenous males living in non-remote areas. However, relationships were weaker for females and those living in remote areas.
The statistical measure adopted here is ‘equivalised gross household income’, which adjusts reported incomes to take into account the number of people living in a household, particularly children and other dependants, as well as economies of scale within households. Household incomes are then divided into five equal groups, called ‘quintiles’.
Findings
In 2014–15, more than one-third (36%) of Indigenous adults were living in households in the lowest income quintile. This was twice the proportion of non-Indigenous adults (17%). Only 6% of Indigenous adults lived in households with an equivalised gross weekly income in the highest quintile compared with 22% of non-Indigenous Australians. The proportion of Indigenous adults living in households in the lowest income quintile varied by jurisdiction: from 55% in the NT to 21% in the ACT.
Also reflecting differences in income distribution by remoteness, 61% of Indigenous adults in very remote areas lived in households in the lowest income quintile compared with 25% in major cities, and between 33% and 46% elsewhere. Conversely, major cities had the highest proportion of Indigenous adults living in households in the highest income quintile (9%), while very remote areas had the lowest proportion (3%).
The proportion of Indigenous adults in each of the equivalised household income quintiles has not changed significantly between 2004–05 and 2014–15, though there have been fluctuations in the lowest quintiles during that time.
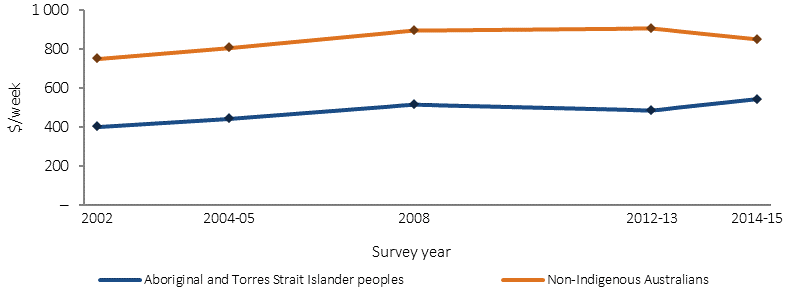
In 2014–15, the median equivalised gross weekly household income for Indigenous adults was $542 compared with $852 for non-Indigenous adults. After adjusting for inflation, there was a statistically significant increase from $402 per week in 2002 to $542 per week in 2014–15 for Indigenous adults, and for the first time there was a narrowing in the gap with non-Indigenous Australians (from $349 in 2002 to $310 in 2014–15).
These national estimates mask considerable geographic variation. For example, the median gross weekly equivalised income for Indigenous adults in 2014–15 ranged from $430 in the NT to $805 in the ACT. There was also variation by remoteness; from $398 in very remote areas to $633 in major cities.
Biddle (2013) examined Census personal income data for Indigenous Australians and reported variations in disposable income by age (40–44 year olds had a disposable income 3.9 times as high as 15–19 year olds) and sex (1.2 times as high for males) as well as variations in average income by region (ranging from $258 per week in Apatula, NT, to $783 per week in South Hedland, WA).
In 2014–15, 50% of Indigenous Australians were living in households reporting that they could not raise $2,000 within a week in an emergency (indicating financial stress). Households in remote areas were more likely to report that they could not raise $2,000 within a week than those in non-remote areas (64% compared with 46%). Approximately 28% of Indigenous Australians aged 15 years and over were living in households that had experienced days without money for basic living expenses in the last 12 months.
In 2012–13, more than one in five (22%) Aboriginal and Torres Strait Islander people were living in a household that in the previous twelve months had run out of food (ABS, 2014e).
An indication of the relationship between low income and poorer health is provided by the 2014–15 Social Survey. Indigenous adults living in households in the lowest income quintile were more likely to be a current smoker, to report fair/poor health, high psychological distress and three or more long-term health conditions than those in households in the highest income quintiles (see measure 1.17). Relationships between income and educational attainment and employment are also evident.
A recent study found that Indigenous Australians had lower total personal incomes than other Australians across all labour force categories, particularly for those who were employed full-time (Howlett et al, 2015). This is partly due to lower wages (around 18% lower for Indigenous men), which can be explained by lower levels of education, poorer access to ’good’ jobs and less weeks worked per year on average. This paper finds that Indigenous Australians have considerably less income from other private sources (business and investment income) than other Australians. A higher proportion of Indigenous incomes come from government payments. Based on responses from the 2014–15 Social Survey, 47% of Indigenous Australians aged 18–64 years received a government cash pension or allowance as their main source of income, compared with 14% of non-Indigenous Australians.
Figures
Figure 2.08-1
Proportion of persons aged 18 years and over in each equivalised gross weekly household income quintile, by Indigenous status, 2014–15
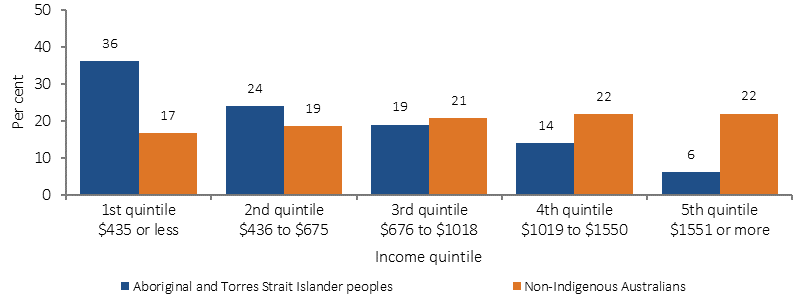
Source: ABS and AIHW analysis of 2014–15 NATSISS and 2014–15 NHS
Figure 2.08-2
Proportion of Indigenous Australians aged 18 years and over in each equivalised gross weekly household income quintile, 2004–05, 2008, 2012–13 and 2014–15
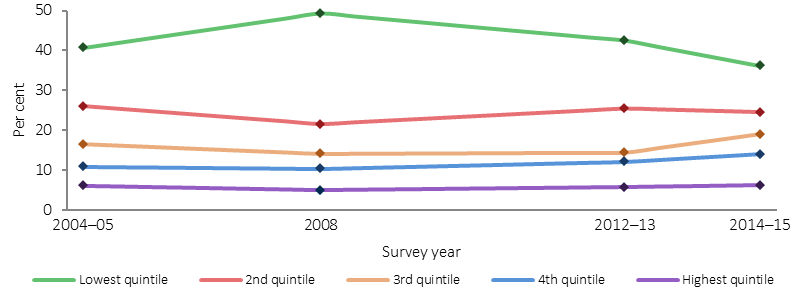
Source: ABS and AIHW analysis of 2014–15 NATSISS, 2012–13 AATSIHS, 2008 NATSISS and 2004–05 NATSIHS
Figure 2.08-3
Proportion of persons aged 18 years and over in each equivalised gross weekly household income quintile, by Indigenous status and remoteness, 2014–15
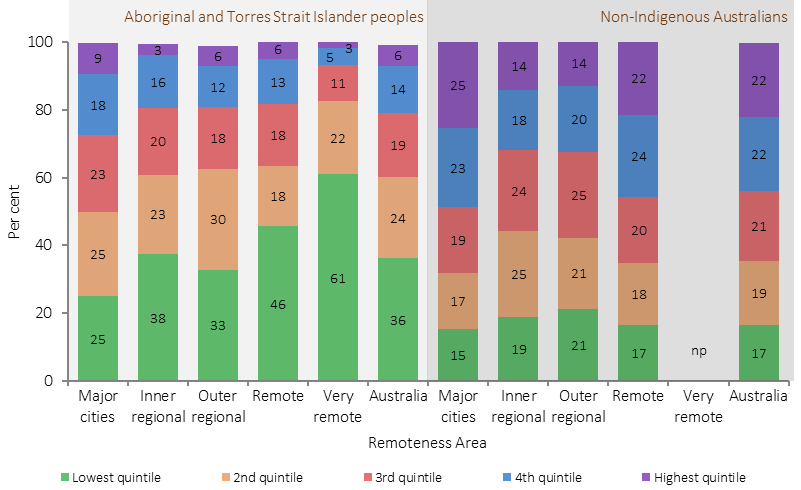
Source: ABS and AIHW analysis of 2014–15 NATSISS and 2014–15 NHS
Figure 2.08-4
Proportion of Aboriginal and Torres Strait Islander peoples aged 18 years and over in the lowest equivalised gross weekly household income quintile, 2014–15
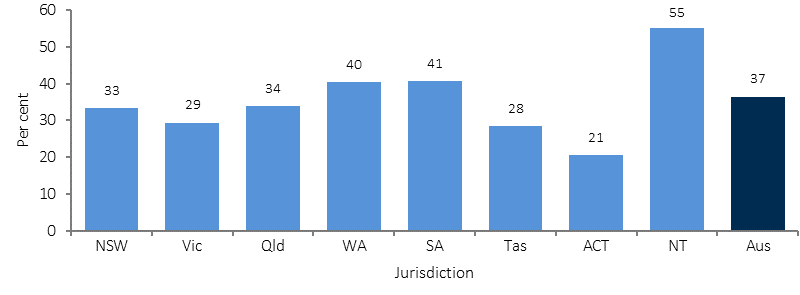
Source: ABS and AIHW analysis of 2014–15 NATSISS
Figure 2.08-5
Median equivalised gross weekly household income, persons aged 18 years and over, by Indigenous status, 2002, 2004–05, 2008, 2012–13, 2014–15
Source: ABS and AIHW analysis of 2014–15 NATSISS, 2014–15 NHS, 2012–13 AATSIHS, 2011-13 AHS, 2007–08 NHS, 2008 NATSISS, 2004–05 NATSIHS, 20004-05 NHS, 2002 NATSISS and 2002 GSS
Implications
The disparity in incomes between Indigenous and non-Indigenous Australians has important implications for health. These implications include reduced capacity to access goods and services required for a healthy lifestyle, including adequate nutritious food, housing, transport and health care.
Other factors that may exacerbate the situation faced by low income households include resource commitments to extended families and visitors (SCRGSP, 2007). Income discrepancies may reflect uneven access to education and employment opportunities . There is evidence that labour market discrimination against Indigenous Australians exists, that is wage and employment differentials, which cannot be explained by educational gaps or other factors (CEDA, 2015).