2.11 Contact with the criminal justice system
Page content
Why is it important?
Aboriginal and Torres Strait Islander peoples experience higher rates of arrest and incarceration than non-Indigenous Australians. Imprisonment impacts on family, children and the broader community. It increases stress, affects relationships and has adverse employment and financial consequences.
The impact of child removals, poverty, unemployment, lower levels of education, higher rates of stressful life events, psychological distress, mental health issues and substance use are linked to higher rates of contact with the criminal justice system (AMA, 2015). In 2015, Indigenous prison entrants were more likely than non-Indigenous entrants to report having had parents or carers in prison during their childhood (26% and 13% respectively). Indigenous prison entrants were less likely to have completed Year 12 or equivalent than Indigenous Australians in the general community and non-Indigenous Australians (prisoners and general community). Indigenous prison entrants were also 1.4 times as likely to have been unemployed in the month prior to imprisonment in 2015 (AIHW, 2015d).
There is an over-representation in prison populations of people with mental health and substance use problems, cognitive impairment, hearing loss, learning difficulties and histories of physical and sexual abuse (Heffernan et al, 2012; Levy, 2005; AMA, 2015). Putt et al (2005) found that 69% of male Indigenous prisoners had used alcohol at the time of arrest compared with 27% of non-Indigenous prisoners; Indigenous prisoners were also more likely to attribute their crime to drug or alcohol intoxication (AMA, 2015; Kariminia et al, 2012; ANCD, 2013). In a recent survey of 5 metropolitan police stations, 41% of Indigenous detainees were methamphetamine users compared with 34% of non-Indigenous detainees (Goldsmid & Willis, 2016).
Findings
Youth justice supervision
During 2014–15 there were 4,741 Indigenous young people under youth justice supervision (AIHW, 2016ab).
On an average day in 2014–15, 43% of those under youth justice supervision were Indigenous (around 2,433 out of 5,629) (including estimates for WA and the NT). Given Indigenous youth only make up less than 6% of the population aged 10–17 years, they were significantly over-represented in youth justice supervision. Young people may be supervised either in their communities or in secure detention facilities: on an average day most Indigenous youth under supervision are under community-based supervision (82%) with the remainder in detention (19%). However, of the 883 young people in detention on an average day, half (54%) were Indigenous (including estimates for WA and the NT).
In 2014–15, the rate of Indigenous 10–17 year olds under some form of supervision was 180 per 10,000 on an average day. This was 15 times as high as the non-Indigenous rate (12 per 10,000). Males made up 80% of Indigenous young people under supervision (similar to the non-Indigenous proportion). Indigenous 10–17 year olds were 14 times as likely to be in community-based supervision and 24 times as likely to be in detention as non-Indigenous young people (including estimates for WA and the NT) (AIHW, 2016ab). Rates of supervision peaked for both Indigenous and non-Indigenous young people in 2010–11, before declining in subsequent years (from 213 to 180 per 10,000 for Indigenous young people, and from 17 to 12 per 10,000 for non-Indigenous young people in 2014–15. However, there was also a decline for non-Indigenous young people and the level of Indigenous over-representation has increased from 13 to 15 times the non-Indigenous rate.
Over-representation of Indigenous young people aged 10–17 years in youth justice supervision occurred in all jurisdictions where data was available. WA had the highest level of over-representation in youth justice supervision (the Indigenous rate was 27 times higher than the non-Indigenous rate) and the highest rate of Indigenous young people under supervision (285 per 10,000 on an average day) and Tasmania the lowest Indigenous rate (32 per 10,000 and lowest level of over-representation). In the NT, Indigenous young people constitute 45% of the population aged 10–17 years, but made up 92% of those aged 10–17 years under supervision on an average day in 2014–15. Indigenous young people in the NT were about 17 times as likely as non-Indigenous young people to be under youth justice supervision (rates of 112 and 7 per 10,000).
On an average day in 2014–15, 29% of Indigenous youth under supervision were aged 10–14 years, more than twice the non-Indigenous proportion (14%).
In 2014–15, a higher proportion of Indigenous young people completed multiple periods of supervision than non-Indigenous young people (18% compared with 13%). Indigenous youth released from sentenced community-based supervision in 2013–14 were more likely than non-Indigenous to return to sentenced supervision within 12 months: 54% of Indigenous males (compared with 45% of non-Indigenous males) and 44% of Indigenous females (compared with 42% of non-Indigenous females). Young Indigenous males released from sentenced detention were more likely to return to sentenced supervision within 12 months than non-Indigenous males (76% and 70% respectively). While for females, proportions were higher for non-Indigenous (79%) than Indigenous females (73%).
For those under supervision in 2014–15, the average length of time under supervision was a week longer for Indigenous young people (187 days) than non-Indigenous young people (180 days).
In 2014–15, on an average day there were 267 Indigenous young people in unsentenced detention. The rate of Indigenous young people on remand was 22 times the rate for non-Indigenous youth. The majority of young people in unsentenced detention (84%) were in the 14–17 year age group. Indigenous youth spent about 1 week longer in unsentenced detention during the year than non-Indigenous youth (46 days compared with 38 days, on average). Indigenous youth were 22 times as likely as non-Indigenous youth to have 6 or more completed periods of unsentenced detention during the year.
One-third (32%) of young people under youth justice community-based supervision in 2014–15 were also in the child protection system, including 44% of Indigenous females and 31% of Indigenous males. In 2014–15, 41% of young people in detention were also in the child protection system at some time that year, including 52% of Indigenous females and 36% of Indigenous males (AIHW, 2016ab).
In 2011–12 to 2014–15, Indigenous Australians represented 39% of youth who had been under youth supervision and who had also accessed specialist services.
Indigenous young people are also more likely to reappear as adults in the justice system (Chen, S et al, 2005). In NSW prisons, Aboriginal inmates were twice as likely to report a history of juvenile detention compared with non-Indigenous inmates, and Aboriginal men were more likely to have been in juvenile detention five or more times compared with non-Indigenous men (Indig & Wales, 2010). In NSW, a higher proportion of young Aboriginal youth in juvenile detention had been placed in out-of-home care as a child (38%) than non-Indigenous (17%) (Indig et al, 2011) (see measure 2.12). In the adult population, nearly half of all Aboriginal inmates in NSW prisons were placed in care as children, twice the non-Indigenous rate (Indig & Wales, 2010). Aboriginal inmates were also more likely to report their parents had been placed in care as a child (27% of Aboriginal women and 14% of Aboriginal men).
Children of parents who have been incarcerated (particularly boys whose fathers have a criminal record) are more likely to also be in the criminal justice system (Goodwin & Davis, 2011). Aboriginal youth in custody in NSW were twice as likely to have ever had a parent in prison (61% compared with 30%) and 16% had a parent in prison at the time of being surveyed (compared with 4% of non-Indigenous youth). In NSW prisons, one in three Aboriginal inmates had a parent imprisoned during their childhood (3 times the non-Indigenous rate). Aboriginal inmates were also more likely than non-Indigenous inmates to have dependent children (Indig & Wales, 2010).
Aboriginal youth in NSW juvenile custody were three times more likely than their non-Indigenous counterparts to have a possible intellectual disability (Haysom et al, 2013) 92% had a psychological disorder and 83% were risky drinkers (Wallace, GP, 2014).
Figures
Figure 2.11-1
Rates of young people aged 10–17 years under community-based supervision and detention, by Indigenous status, 2006–07 to 2014–15
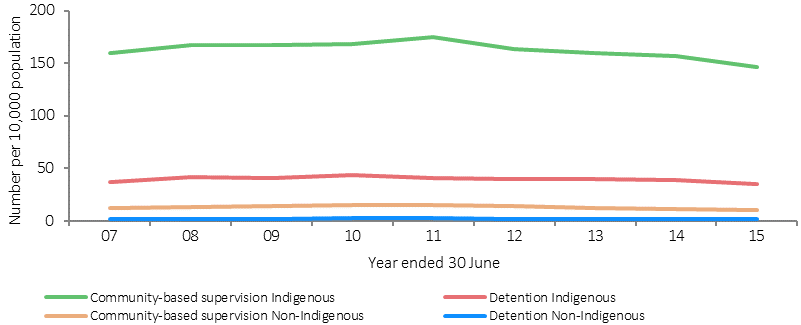
Note: WA and the NT did not supply JJ NMDS data for 2008–09 to 2014–15
Source: AIHW Juvenile Justice National Minimum Dataset, 2014–15
Figure 2.11-2
Rates of young people aged 10–17 years who completed a period of unsentenced detention, by number of periods and Indigenous status, 2014–15
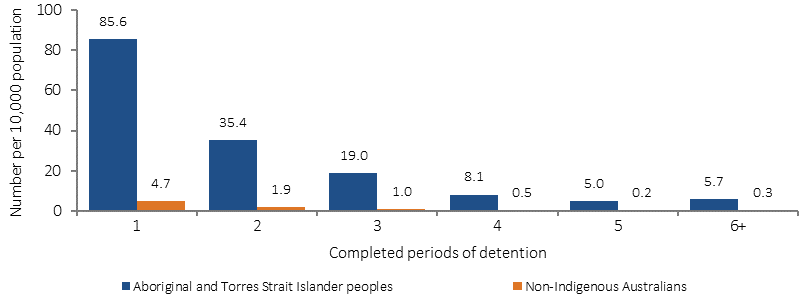
Note: excludes WA and NT
Source: AIHW Juvenile Justice National Minimum Dataset, 2014–15
Figure 2.11-3
Proportion of Indigenous Australians aged 15 years or less when first formally charged by police, by age and sex, 2014–15
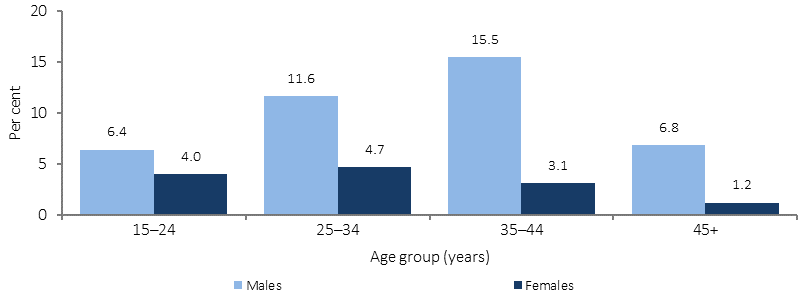
Source: AIHW and ABS analysis of 2014–15 NATSISS
Figure 2.11-4
Proportion of people aged 10–16 years released from sentenced supervision in 2013–14 who returned to sentenced supervision within 12 months, by Indigenous status and sex
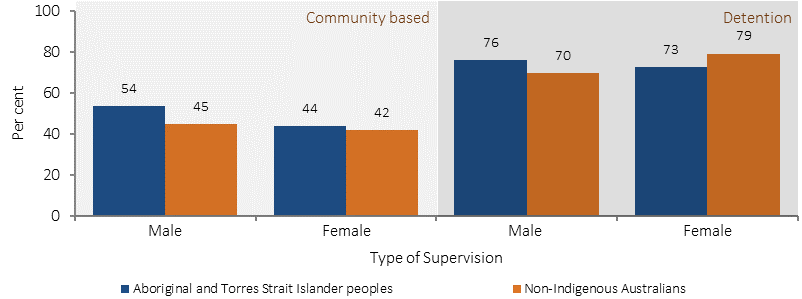
Note: excludes WA and NT
Source: AIHW Juvenile Justice National Minimum Dataset, 2000-01 to 2014–15
Adult imprisonment
As at 30 June 2016, there were 10,596 adult prisoners who identified as Aboriginal and Torres Strait Islander in the National Prison Census, representing 27% of all prisoners (ABS, 2016b). After adjusting for differences in the age structure of the two populations, the Indigenous imprisonment rate was 13 times the rate for non-Indigenous Australians. Since 2006, there has been a 53% increase in imprisonment rates for Indigenous Australians and the gap has widened (compared with a 2% increase for non-Indigenous Australians).
At 30 June 2016, the median age of adult Indigenous prisoners was 31 years compared with 36 years for non-Indigenous prisoners. Indigenous men made up 27% of the total male prisoner population. Indigenous women were also over-represented in the prison population, representing 34% of the female prisoner population. Of all Indigenous prisoners, 90% were male.
At 30 June 2016, the highest rates of imprisonment of Indigenous Australians were reported in WA followed by the NT and with the lowest in Tasmania. In the September Quarter 2016, there were also 13,214 Indigenous Australians in community-based corrections, representing 20% of those in community-based corrections (ABS, 2016c).
At 30 June 2016, there were proportionally more Indigenous prisoners (76%) than non-Indigenous prisoners (49%) who had a prior adult imprisonment under sentence (ABS, 2016b). Longitudinal analysis shows Indigenous Australians are around 1.7 times as likely as non-Indigenous Australians to be re-imprisoned within 10 years of release (ABS, 2014d; Zhang, J & Webster, 2010).
Three-quarters (77%) of Indigenous sentences are under 5 years. The median aggregate sentence for Indigenous prisoners was lower than for non-Indigenous prisoners (2.0 years compared with 3.5 years) (ABS, 2016b).
A larger proportion of Indigenous prisoners had a most serious offence/charge of acts intended to cause injury (33%) compared with non-Indigenous prisoners (17%). As at 30 June 2016, the majority (63%) of Indigenous prisoners had been incarcerated due to violence-related offences and offences that cause harm. Indigenous prisoners were less likely than other prisoners to be in prison for illicit drug offences (3% compared with 17%) and homicide (5% compared with 9%) (ABS 2016).
In 2014–15, one in 5 (22%) of Indigenous males aged 35 years and over reported having been incarcerated at some time in their life. Proportions were highest in remote (31%) and very remote areas (27%). In addition, 48% of Indigenous males aged 15 years and over reported that they had been formally charged by the police, 20% had been arrested in the previous 5 years and 5% had been incarcerated in the previous 5 years (ABS, 2016e).
In 2014–15, Indigenous men aged 25 years and over who had been incarcerated were around twice as likely to have a below year 10 level of education (44%) as those who had never been incarcerated (21%). The equivalent proportions for Indigenous women in the same age group were 44% and 24% respectively. Only 28% of Indigenous men aged 35–64 years who had been incarcerated were employed compared with 66% of Indigenous men who had never been to jail. One study found that the differences in arrest rates between Indigenous and non-Indigenous Australians may explain around 15% of the difference in employment outcomes (Borland & Hunter, 2000). By age 23, more than three-quarters (76%) of the NSW Indigenous population have been cautioned by the police, referred to a youth justice conference or convicted of an offence in a NSW criminal court (the comparable non-Indigenous figure was 17%) (Weatherburn, 2014).
Within the prison population in 2015, 40% of Indigenous prison entrants had completed a level of schooling to Year 10 or below compared with 29% of non-Indigenous prison entrants (AIHW, 2015d). Indigenous prison entrants were more likely than non-Indigenous prison entrants to have been unemployed 30 days prior to imprisonment (60% compared with 43%), and were also more likely to be facing homelessness on release (38% compared with 28%) (see measure 2.01).
In 2015, 26% of Indigenous prison entrants reported they had a parent or carer in prison during their childhood compared with 13% of non-Indigenous entrants.
In 2015, the proportion of prison entrants who were smokers was higher than in the general population (82% of Indigenous and 72% of non-Indigenous entrants); and higher than the total Indigenous population smoking rates (45% of those aged 18 years and over in 2014–15). Half (54%) of Indigenous prison entrants reported a high risk of alcohol-related harm in the last 12 months compared with 33% of non-Indigenous prison entrants. In 2015, Indigenous prison entrants were more likely to test positive to hepatitis B virus (25%) than non-Indigenous entrants (15%) (see measure 1.12).
Notably, Indigenous prison dischargees were less likely to have visited the prison health clinic (76%) than non-Indigenous (88%). Indigenous prison dischargees were more likely to report not having a Medicare card available on release (20%) than non-Indigenous dischargees (12%) (AIHW, 2015d).
An NT study of Indigenous inmates found that 94% had significant hearing loss (Vanderpoll & Howard, 2012). Hearing loss was associated with altercations with others due to misunderstandings and difficulties communicating within the criminal justice system, including during hearings.
National Deaths in Custody data show rates of deaths in prison custody have declined for both Indigenous and non-Indigenous Australians. In 2013 there were 1.1 deaths per 1,000 Indigenous Australians in prison custody compared with 3.4 per 1,000 in 2000. For non-Indigenous Australians, rates were 2.0 per 1,000 in 2013 compared with 2.8 per 1,000 in 2000. Data from 2012–13 indicate that there were 13 deaths of Indigenous Australians in all forms of custody and 58 non-Indigenous deaths. Four of the Indigenous deaths occurred in police custody, 9 in prison and none in juvenile justice/welfare custody. Seven of these Indigenous deaths were due to natural causes, 4 were accidents and 1 was self-inflicted.
Figure 2.11-5
Age-standardised rate of persons in prison, by Indigenous status, 2006 to 2016
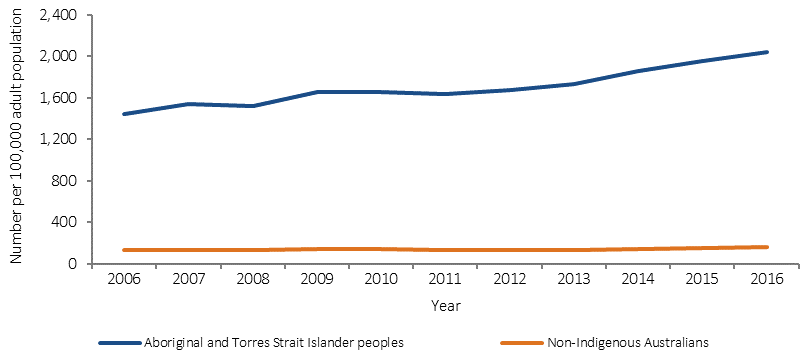
Source AIHW and ABS analysis 2016 Prison Census
Table 2.11-1
People in prison custody by Indigenous status, sex and state/territory, 30 June 2016
| Indigenous Number | Age Standardised rate (a) |
Non-Indigenous Number | Rate ratio (b) |
Rate difference (c) |
|||||
|---|---|---|---|---|---|---|---|---|---|
| Males | Females | Persons | Males | Females | Persons | ||||
| NSW | 2,724 | 309 | 3,037 | 1,992 | 8,951 | 632 | 9,586 | 11.3 | 1,816 |
| Vic | 491 | 44 | 535 | 1,565 | 5,593 | 387 | 5,979 | 11.7 | 1,432 |
| Qld | 2,228 | 234 | 2,461 | 1,626 | 4,837 | 447 | 5,281 | 10.5 | 1,470 |
| WA | 2,109 | 291 | 2,403 | 3,383 | 3,586 | 337 | 3,927 | 16.4 | 3,177 |
| SA | 518 | 50 | 571 | 2,008 | 2,235 | 142 | 2,381 | 9.8 | 1,804 |
| Tas | 78 | 19 | 92 | 523 | 424 | 45 | 476 | 3.5 | 372 |
| ACT | 94 | 7 | 105 | 1,904 | 311 | 20 | 328 | 17.7 | 1,797 |
| NT | 1,294 | 108 | 1,393 | 2,504 | 244 | 20 | 270 | 13.0 | 2,311 |
| Australia | 9,534 | 1,062 | 10,596 | 2,039 | 26,190 | 2,033 | 28,216 | 12.5 | 1,876 |
(a) Number per 100,000 adult population
(b) Rate ratios and differences are age-standardised
(c) Rate difference is the Indigenous age-standardised rate
Source AIHW and ABS analysis 2016 Prison Census
Implications
Findings show a high level of inter-generational disadvantage associated with contact with the criminal justice system, including high rates of parental incarceration and experiences of being placed in care (see measure 2.12). Efforts to reduce Indigenous over-representation in the criminal justice system require recognition of the health and social issues associated with recidivism and non-compliance with court orders.
Primary responsibility for criminal justice issues sits with state and territory governments. The states and territories deliver a range of programmes to reduce levels of Indigenous incarceration and re-offending, including diversionary programmes (e.g. cautions and conferencing), ‘circle sentencing’ and Indigenous courts, and prisoner through-care arrangements. Crime prevention strategies that consider the needs of victims and communities through justice reinvestment have also been recommended (AHRC, 2013). Circle sentencing offers an inter-sectoral strategy to work with communities to address trauma, social difficulties, substance use, low self-esteem and mental health issues (Wallace, GP, 2014). There are gaps in the evidence on the effectiveness of various interventions. While not conclusive, Indigenous tailored employment and diversionary programmes could improve employment opportunities and reduce recidivism particularly for those on shorter sentences (Spiranovic et al, 2015; AMA, 2015).
The Australian Government funds a number of initiatives through its Indigenous Advancement Strategy's Safety and Wellbeing Programme designed to address the factors contributing to Indigenous Australians’ high rates of contact with the criminal justice system. For example, the Government funds a range of prisoner through-care and youth diversion activities that seek to support safer communities by reducing Indigenous offending, targeting Indigenous youth and adults who are currently in or recently exited from the criminal justice system.
The Australian Government also funds initiatives through the Indigenous Australians’ Health Programme enabling preventive interventions to reduce the burden that trauma has on Aboriginal and Torres Strait Islander children.
The Australian Government is also working with states and territories to develop nationally comparable Indigenous offending and victimisation data sets that will assist with identifying areas of greatest need and significant trends. More evidence is required about what prevention strategies and interventions are effective in reducing victimisation, offending and reoffending, and consequent contact with the criminal justice system. There are also a number of gaps in evidence for youth justice supervision including the reasons for detention, factors contributing to the high rate of Indigenous youth supervision, tracking movement into adult detention, and the health of those under youth justice supervision.
Weatherburn (2014) identifies four key risk factors for Indigenous offending: exposure to child neglect (see measure 2.12); school attendance and performance (see measure 2.05); unemployment (see measure 2.07); and drug and alcohol abuse (see measures 2.16 and 2.17). Findings from these measures combined show Indigenous Australians fare worse across all factors, which all play a significant role in contact with the criminal justice system. Weatherburn suggests that child and maternal health services provide opportunities to address antecedents of child neglect (substance abuse and maternal depression resulting from poor health, family violence, financial stress, homelessness and traumatic life events). State and territory youth justice agencies provide programmes designed for Indigenous Australians focusing on family violence, alcohol and drug use, education and employment, counselling and family support (AIHW, 2014j).
For individuals in contact with the prison system, access to health services is pertinent both prior to imprisonment and post-release (Lloyd et al, 2013). Accessing health care post-imprisonment requires reapplying for a Medicare number, which creates an additional barrier to addressing health issues while managing competing priorities of re-establishing housing, employment and relationships with family and community. Some Aboriginal health organisations have developed their own health programmes for prisoners and their families (Tongs et al, 2007; Nettleton et al, 2007). In 2015, 13% of Indigenous prisons received health care from an Aboriginal health service (AIHW, 2015d).